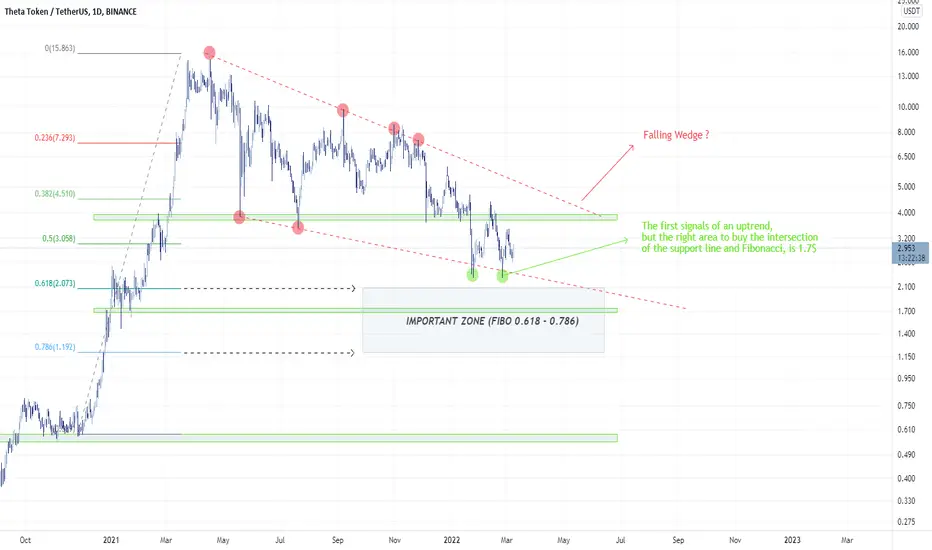
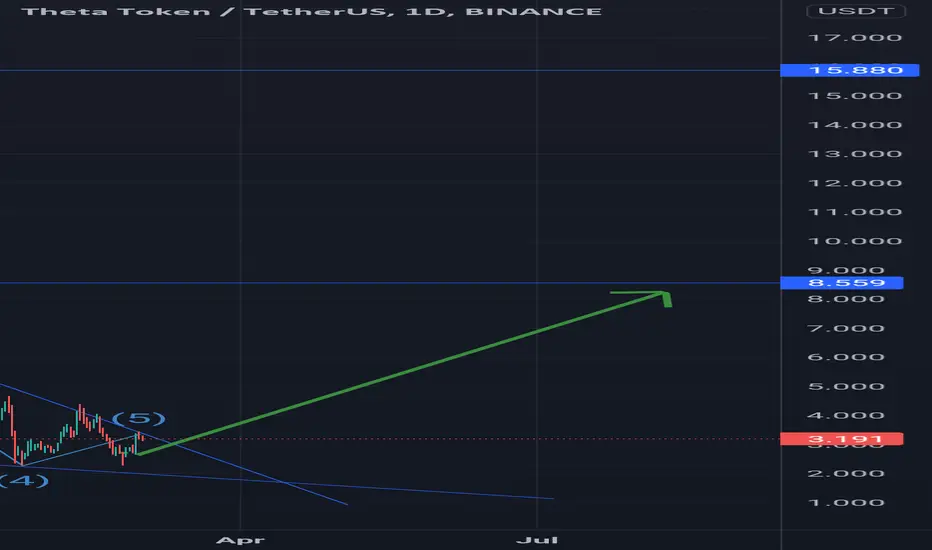
THETA Bullish Trend The first signals of an uptrend,
but the right area to buy the intersection of the support line and Fibonacci, is 1.7$
What do you think?
THETAUSDT.P trade ideas
THETAUSDT (Long)THETAUSDT is bouncing up from a strong support level
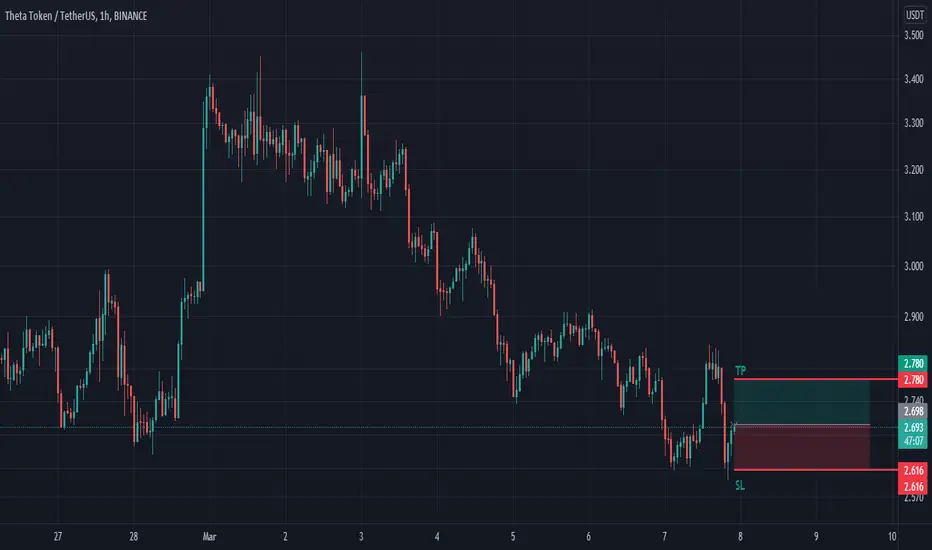
Long
Entry at 2.698
Take Profit at 2.780
Stop loss at 2.616
Risk/reward ratio of 1:1
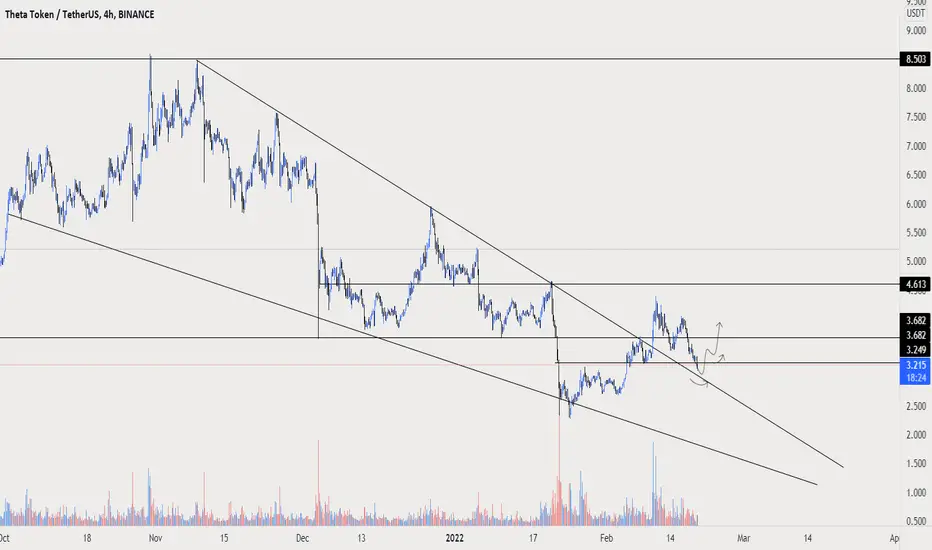
Theta: Symmetrical Trianglethe main pattern, descending triangle, has reached the middle of the target
now there is a symmetrical triangle forming which could lead to the continuation of the bearish trend if broken below 2.27 or upwards above 4.05

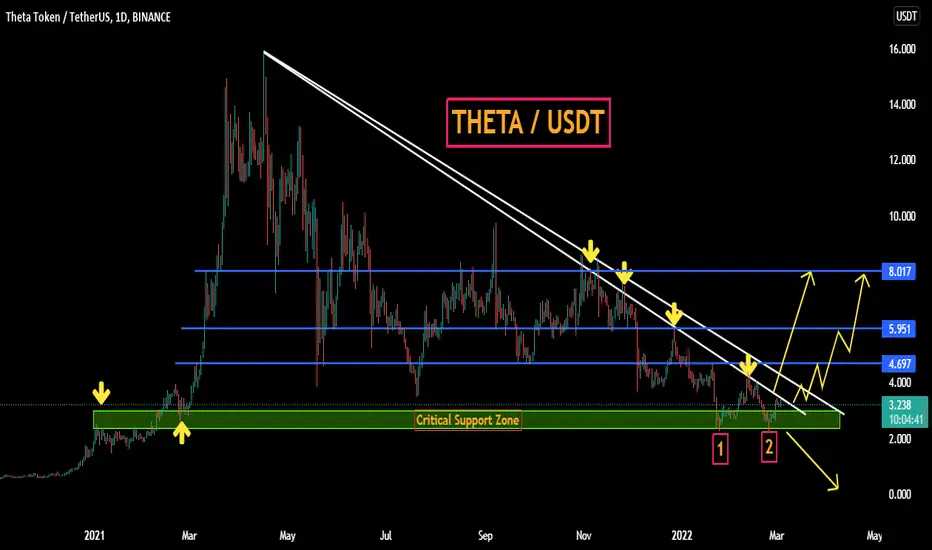
THETAUSDT - SETUPTHETAUSDT price has reached the apex of the triangle and now hovering around the critical support zone, but when the bulls will charge themself it is a big question. On the breaking of this triangle will leads to a good upside move, So be patient and wait for the price action
Theta My idea of Theta is that I think Theta can behave like it did in the past and, can see good prices.
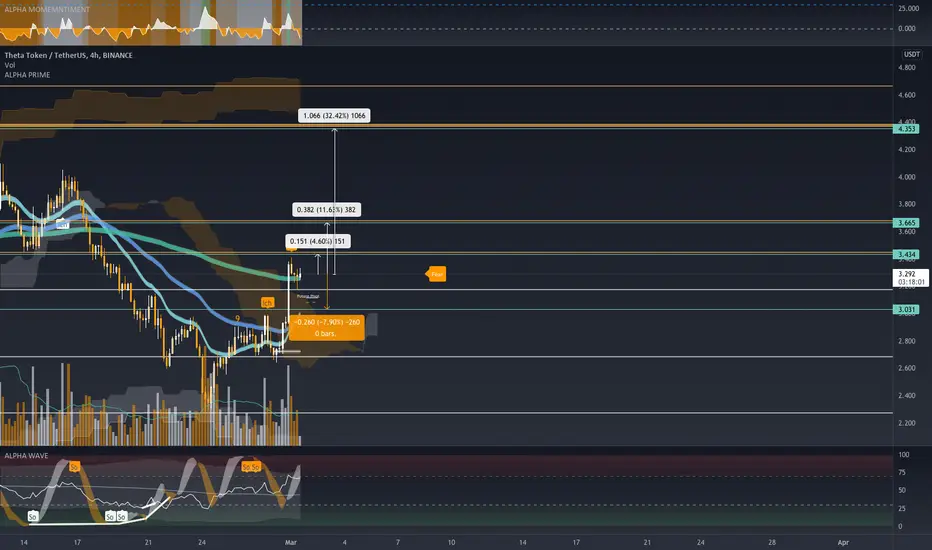
THETAUSDT - Long - Potential 32.42%THETAUSDT - Long - Potential 32.42%
Exchanges: Huobi.pro, Binance, KuCoin
Signal Type: Regular (Long)
Entry Targets:
1) 3.290
Take-Profit Targets:
1) 3.434
2) 3.665
3) 4.353
Stop Targets:
1) 3.031
Entry Triggers - slight pullback entry from yesterdays market pump. May retrace to Pivot at 3.11 but high probability of trailing BTC's bullish pump if we hold above EMA200
$THETA Key levels, Analysis & TargetsTHETA/USDT Key levels, Analysis & Targets
Time frame D1 Bullish Divergences in MACD Indicator
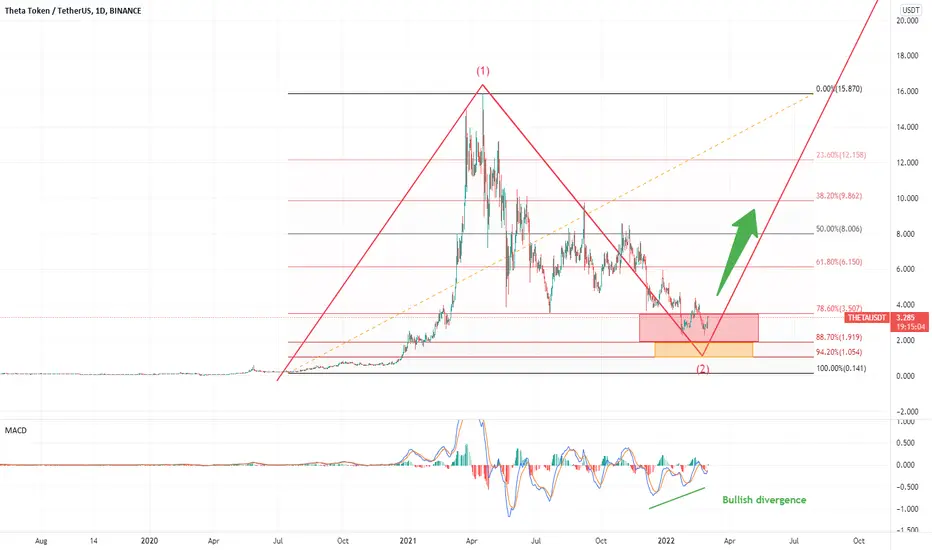
Pivotal Moment for THETA - Breakout or Go DownSummary:
THETA is hitting a pocket of resistance with the first major test at the horizontal yellow line.
Once cleared, the sloped angle line is the next resistance line followed uptrend dotted Fib lines in the Green Pitchfork.

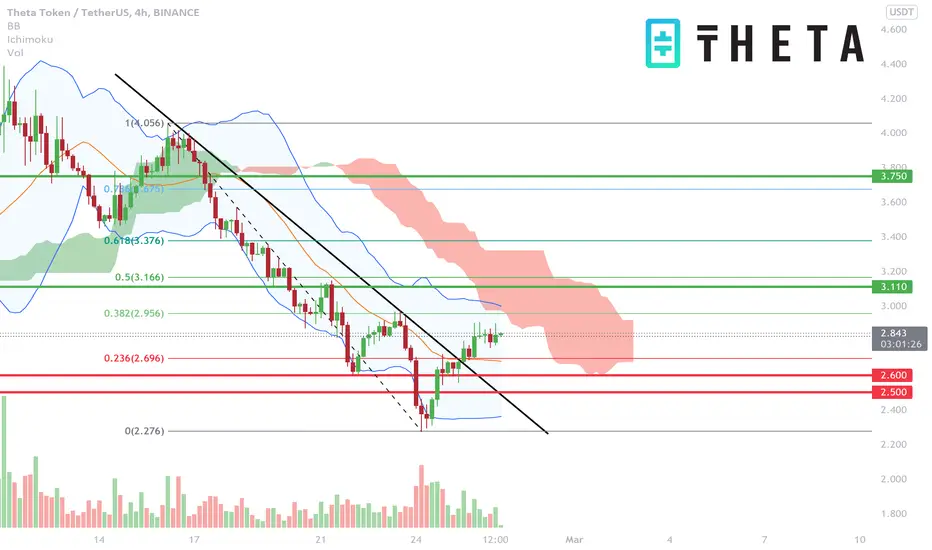
THETA - Compounding CorrectionsThe long correction in THETA looks to be coming to an end, as long as support of the Triangle formation holds. If a break above the resistance line of the triangle holds then continuation of the prior price appreciation trend can begin.

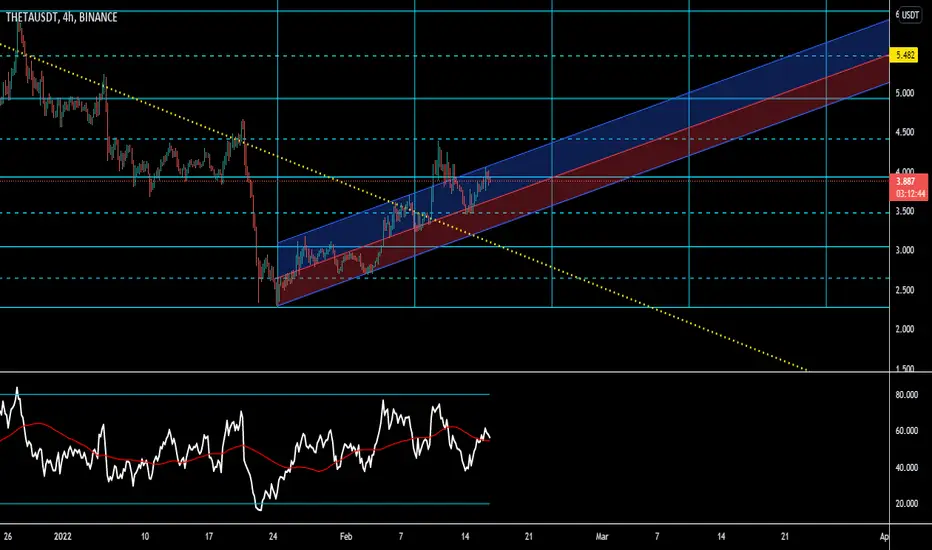
THETA - AnalysisOn a 4-hour timeframe, a suitable output can be seen from the two ranges of static and dynamic resistance, and it has targets of 3.11 and 3.75 in front of it. If it reaches the range of 2.5 and 2.6, it can be suitable for step entry.
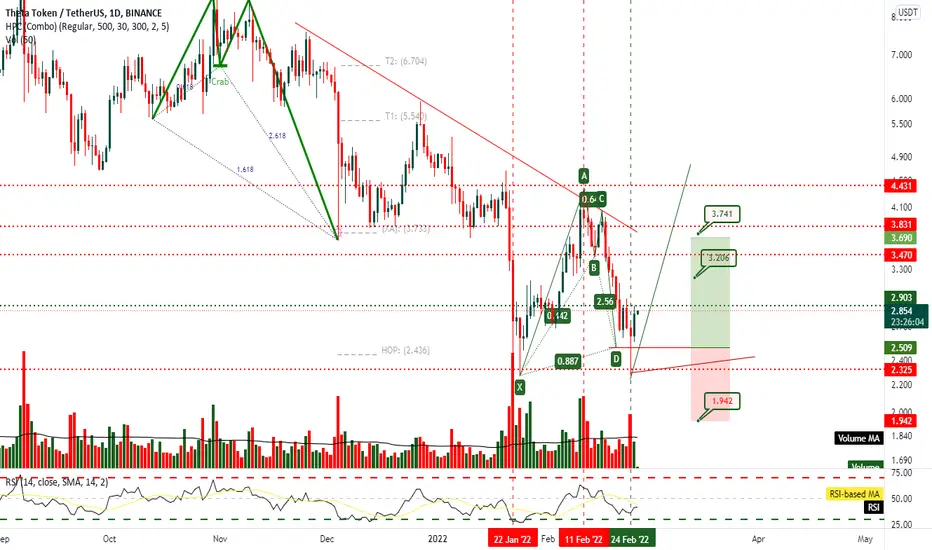
THETAUSD Daily Bullish Bat
Price need to follow GREEN TREND LINE and hit Target 1 & 2 , else if Price BREAKS RED TREND LINE is EXIT
POTENTIAL BUY
THETA/USDT 1 HOURS ANYLYSISWelcome to this quick Update, everyone.
If you are reading my updates for the first time do follow me to get more complex charts in a very simplified way.
I also post altcoin setups on Spot, Margin, and Futures.
I have tried my best to bring the best possible outcome in this chart.
THETA/USDT is making this bullish expanding Triangle pattern.
Entry: CMP and upside the 2.88
Targets: 20%
Stop Loss: $2.75
Stay tuned
What's your thought on this?
Do hit the like button if you like this update and share your views in the comment section.
Thank you
#PEACE

TehtaBINANCE:THETAUSDT
We have exactly the right climbing conditions that can
Give us a good profit, then do not miss it

LONG We see a harmonic pattern in the 4-hour timeframe. We are also on an important dynamic support level.

$THETA/USDTTHETA after breakout still waiting for retest to take place right now we are above 0.61fib level probably we will bounce from this level or we could make a deviation to retest the trend line , but any place here it's good entry for THETA .
THETA up to break the triangle$THETA is up to break the long triangle. Will it break above finishing this long time of accumulation? The support at $2.3 did a great job holding, next resistance it's at $4.3 level, over that the volume should come in an hopefully break the triangle with a target t $14.

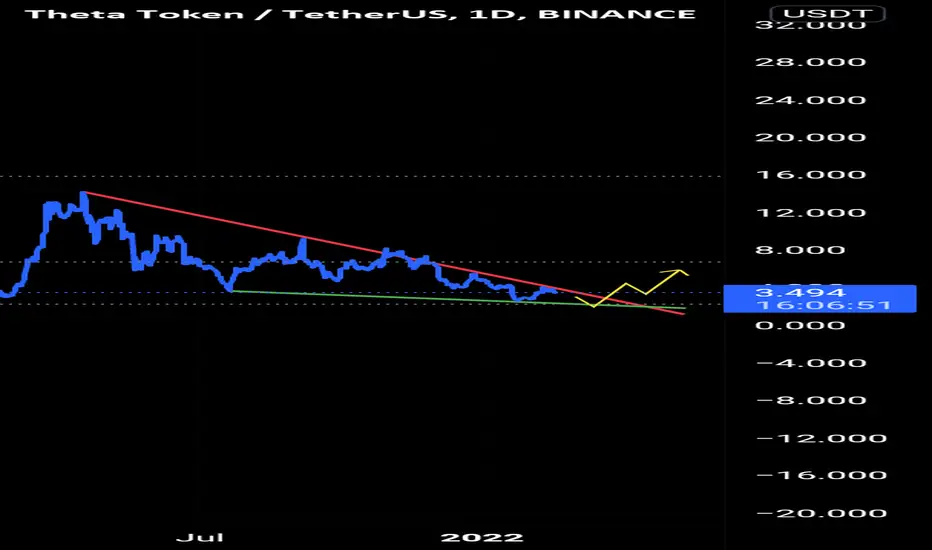
ThtaTheta (1d)
Theta will have an uptrend in the one-day timeframe.
So it's a good time to enter into a deal.
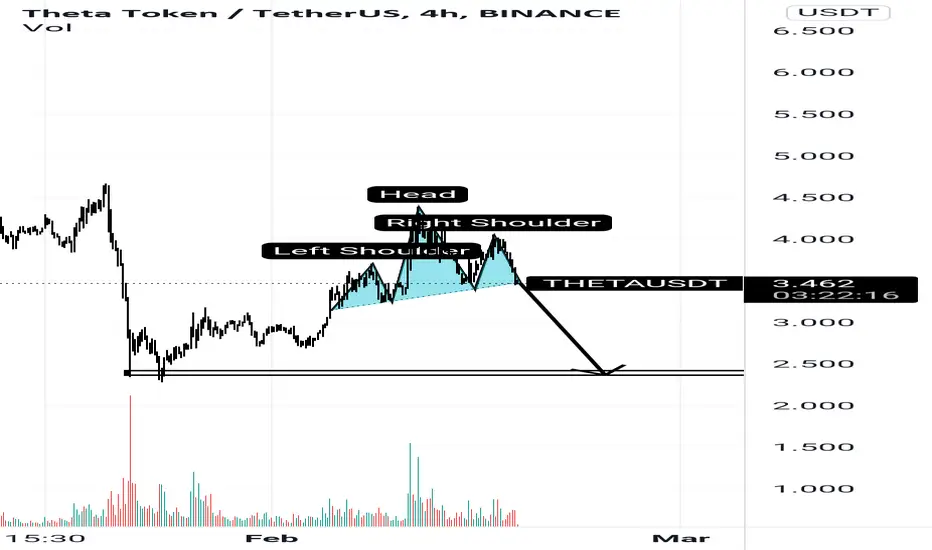
Thetausdt head and shouldersThis is my analysis of Theta
In my opinion, the possibility of falling is greater than climbing
The market is not in a good position in my opinion, especially the Altcoins
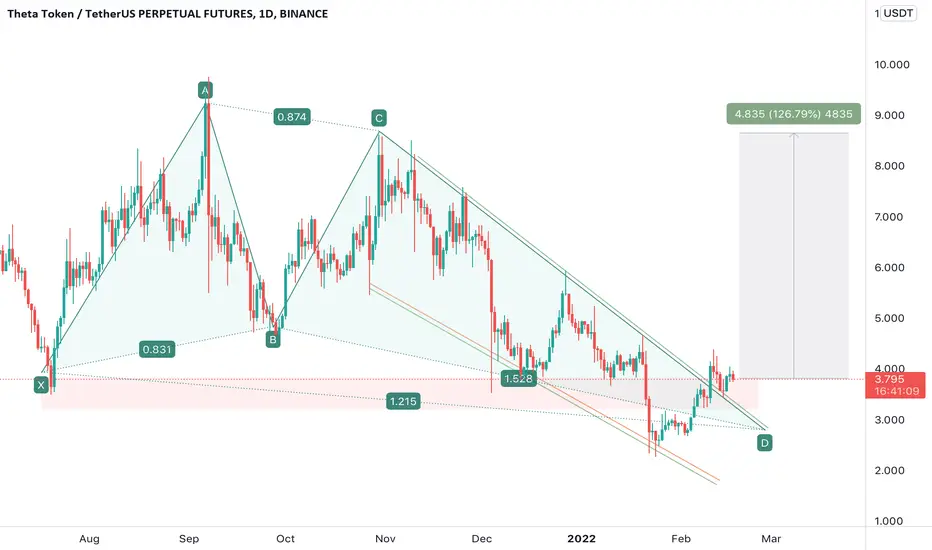
THETA 130% growth potentialTHETA TOKEN has completed a harmonic pattern, in addition to exiting a bullish wedge pattern as a double confirmation. It has an upside potential of 127%. You can start collecting the token in parts to dollar cost average. It could also be a low leverage swing trade in futures.
theta usdtIt runs in an internal geometry
It is one of the most difficult forms of trading
clearly
Do not buy except the bottom of the ascending channel, and if you are lucky buy after testing the yellow bearish trend. Take levels seriously
Theta Breakout on the Horizon!!?Theta is starting to look good we are currently trading inside of a bullish triangle sort of a larger scale one but we are steadily moving our way to the upside. We are currently battling a heavy resistance level and looking for a break to the upside, ultimately a break out and up of this triangle is the whole goal, now i wouldn't be surprised if we do overtake this current resistance level we have tested it multiple times and weakening it day after day recently! Now for support we are looking good we have the midline on the pivot bands which i will talk about next but we also have underlying support outside of this triangle, so a false breakout and bounce back in wouldn't be unheard of either. Now the pivot bands, same as the bollinger bands our midline currently serves as support and same goes if we break below it will then be resistance. But my main point with this indicator is that if we do slip out of the bottom of this triangle we will most likely see a bounce back in shortly after, price action touching the green band over and over shows a bounce is likely coming and vise versa with the red top band. Now our RSI is looking bullish aswell, we are finally above the midline once again and this reclaims a confirmed uptrend if we can hold above the 50. the midline serves as support aswell as the yellow SMA which is closely tailing the RSI slightly underneath! Overall we are looking bullish like the majority of the market and i think a breakout to the upside of this bullish triangle is likely coming soon in the next week or a bit more! Not financial advice just my opinion!

THETAUSD 1HR Confluence of MULTIPLE TIME FRAMES Bullish Patterns LEVELS STRONG POTENTIAL REVERSAL ZONE
Price need to follow GREEN TREND LINE and hit Target 1 & 2 , else if Price BREAKS RED TREND LINE is EXIT
POTENTIAL BUY
