ThetausdtTheta double bottom on Daily TF also the coin is supported with strong fundamentals. Targets in green. Entry can be taken after breakout and retest or before depending on BTC.
I'm new if u like my work please support me so that i can DCA some of my old holdings any amount is welcome. Thanks
Trc20 usdt:-
TNZYq3agpLhZxgZwho1BGeqkpQ2gBAiyWR
THETAUSDT.P trade ideas
Theta analysis for the upcoming 6 monthsThis is a brief technical analysis for Theta price action in the first six months of 2022
Checkout our youtube channel for a complete overview: CryptoOracles

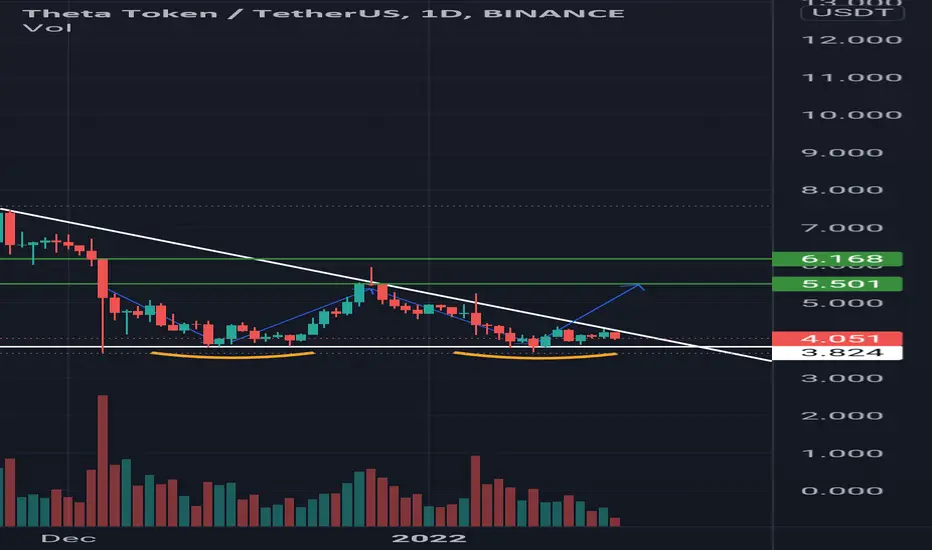
$THETA - Double bottom here.Break through this and we should be able to see Theta finally come back alive.
3$ is the safe demand zone right now.
Anyway it does look like its ready for a moon season.
Targets shown in TA
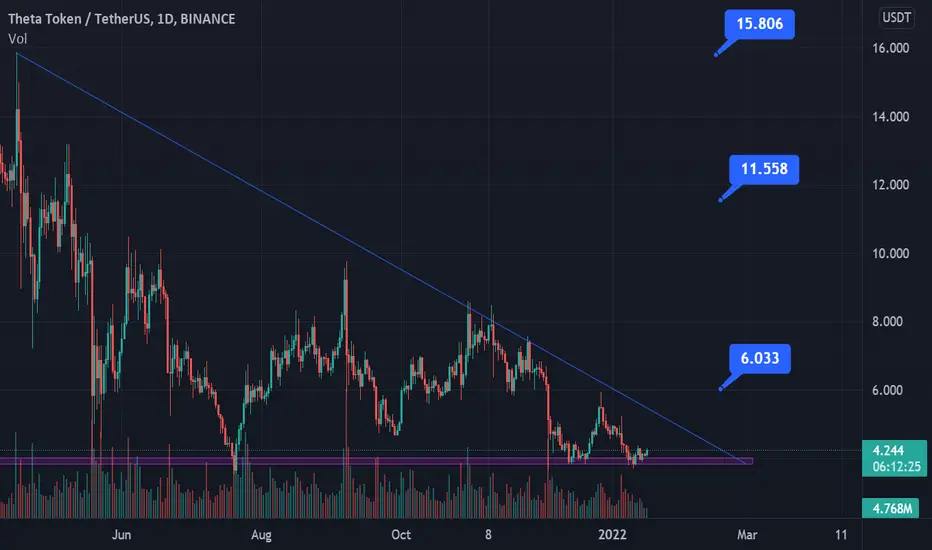
THETA ... its time to wake up ... now or never tp 1 can reach ...
for get the tp2, just wait to theta break that level, show us the stabilization and enter it for reaching tp2 .

THETAUSDTPE 2022 Buy Signal FORECAST NEXT DAYLY TREND CHARTTHETAUSDTPE 2022 Buy Signal FORECAST NEXT DAYLY TREND CHART
Technically we are still overall bearish and here are the possible scenarios:
If you like this analysis, smash the "like button" and leave a comment below to share your thoughts
or let me know what crypto you want to see!
Trading is a reflection of yourself. Learn more daily and be ready for every opportunity.
Have a nice trading!

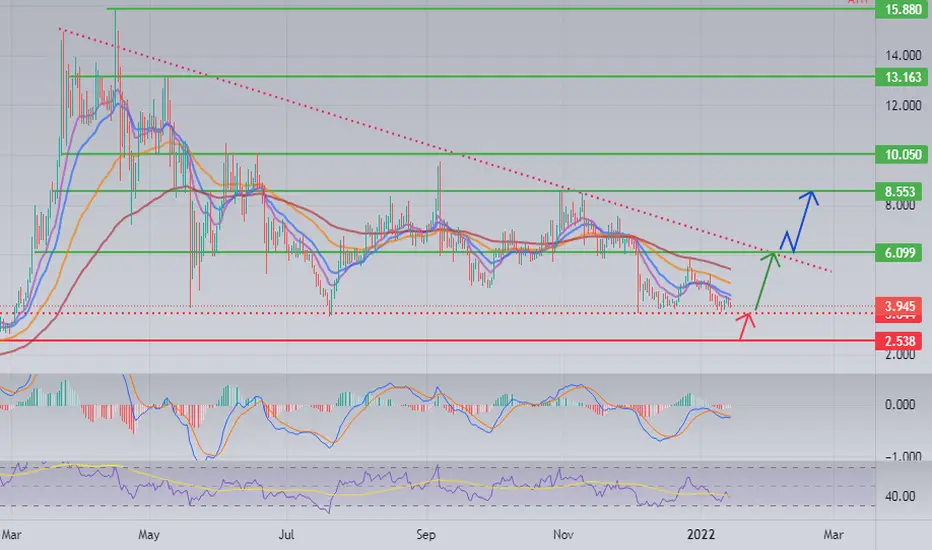
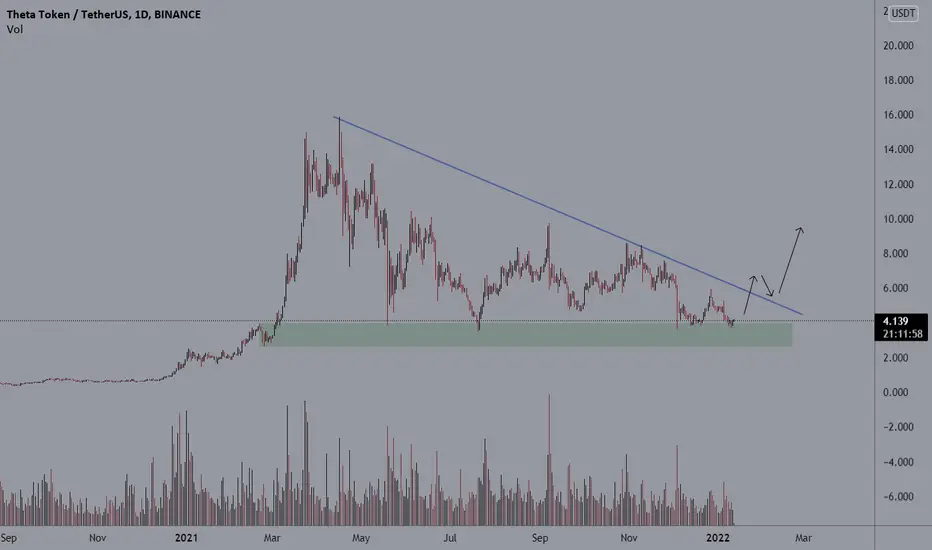
THETATHETA right now at its strong support level, if it fail to maintain its support level then it can we can make a pending buy order at 2.6$, our first profit target can be 6$ and second profit target can be 8.5$
Theta Already big moveTheta is about take off, Already accumulation and ready for big move in this years.

super buy OPP.Hello traders. Wave C is about to end and after that price will violently go up in 5 section. be happy (wink)

Theta THETAUSDT - Bearish descending triangle on the weekly!- Theta was one of the most bullish altcoins in 2020-2021, but now the situation has changed.
- As always i checked all altcoins on Binance and 95% of them are turning bearish, the situation is not looking good.
- The price broke out of the ascending channel on the weekly scale.
- Also we can see a huge descending triangle, which is very close to break down in the near future.

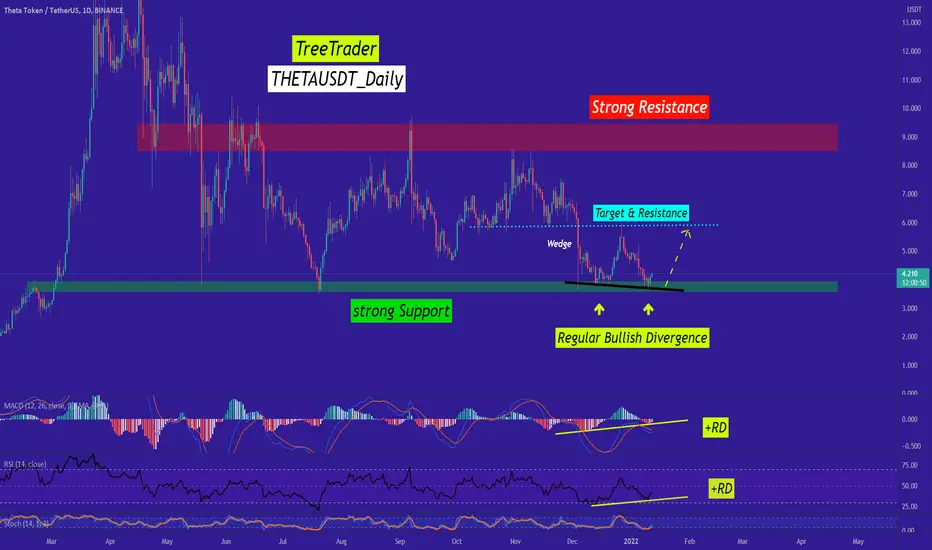
THETA's Future bullish Movement Explained.Hi every one
THETA TOKEN / TETHERUS
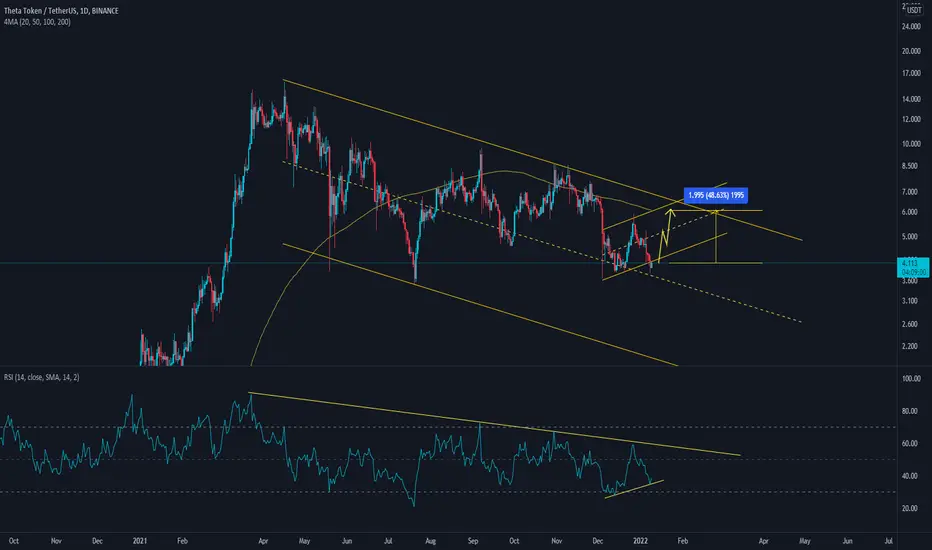
we Want To Review Theta To See what is going To happen to it. The Resistance & Support zones are Shown in The Picture. If we consider The Support & Resistance , and make a Parallel Channel out of It, we can Understand That The Price is at the bottom of The Channel & Is ready to ascend Further because There are Regular Bullish Divergence (+RD) On Both MACD & RSI so we can Expect a Good Bullish Movement From Here. another Thing is That if This Expected Bullish Movement Happens, We can See Formation of a Double bottom Pattern is More Likely to happen, which Double Bottom Pattern will also Help The Bullish Situation to Reach the Top of The Parallel Channel.
This is only an idea and not a financial advise ( NFA )🔴
💎Traders, if you liked this idea or have your opinion on it, write in the comments, We will be glad.
Thank you for seeing idea .
Have a nice day and Good luck
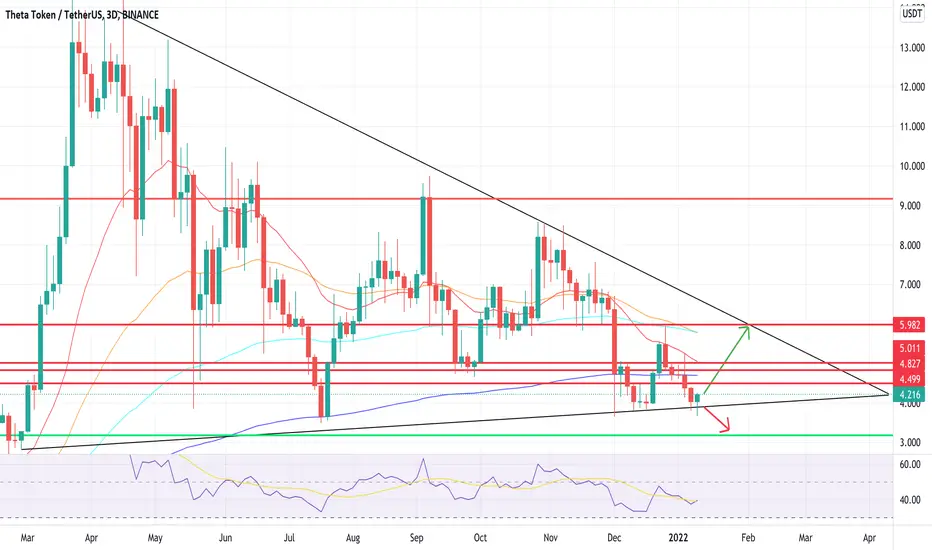
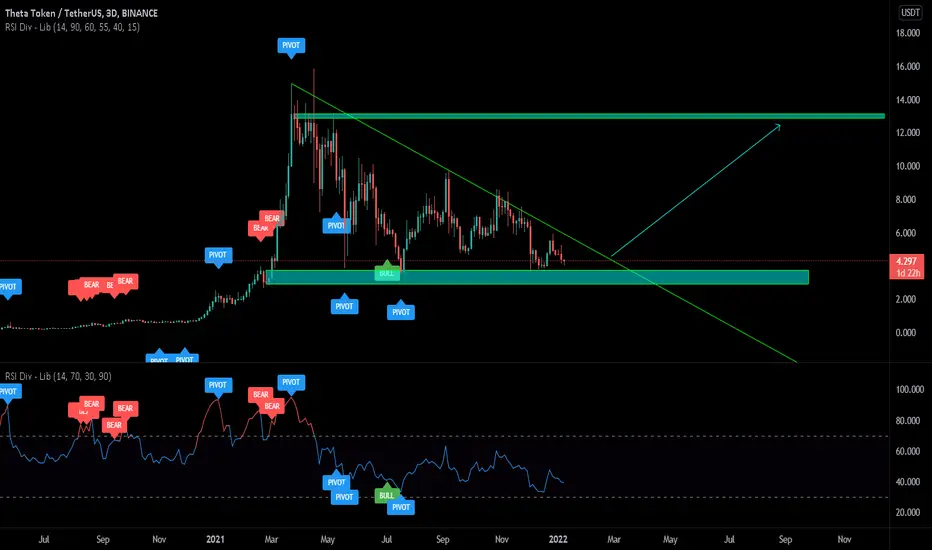
THETA angling for successTHETA has been holding its support on the 3D timeframe since February 2021 and even with BTC’s recent downtrend, it has been able to (just about) keep above the ascending support (black line).
With BTC finding local support, many alts have begun to push back up into previous channels and I believe THETA may also push toward the upper line in the long-term. I have marked the potential points of resistance (red lines) on its journey toward the upper trendline. If BTC has another sharp drop in the short-term, THETA will most likely head toward its support at ~3.19 (green line) which will be a 20% fall from current prices (~4.22).
With the current market conditions, I have found that trading with tighter TP targets has proved well.
Please note I am not a financial advisor and this is not financial advice. All ideas are for educational purposes only :)
Please feel free to leave your comments and thoughts below!

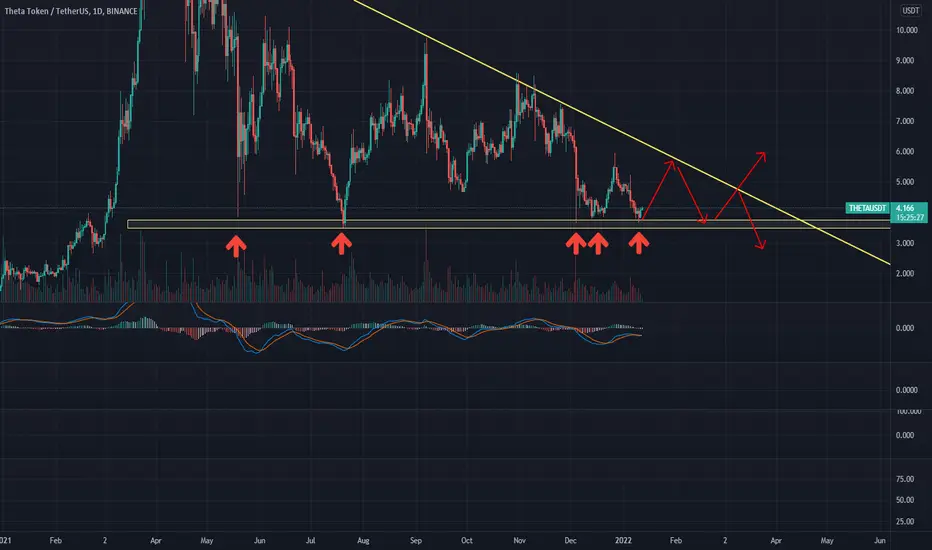
THETA, bottomed out.The following content is machine translation:
The pattern is the fifth dip recently.
Every dip gets a bounce.
Blocked at the downtrend line.
In operation, pay attention to the bottom support and the downtrend line to make short-term transactions. When the support rebounds, the resistance level of the downtrend line will return to the short-term. If the breakthrough is stable, it can be used for the medium and long-term.
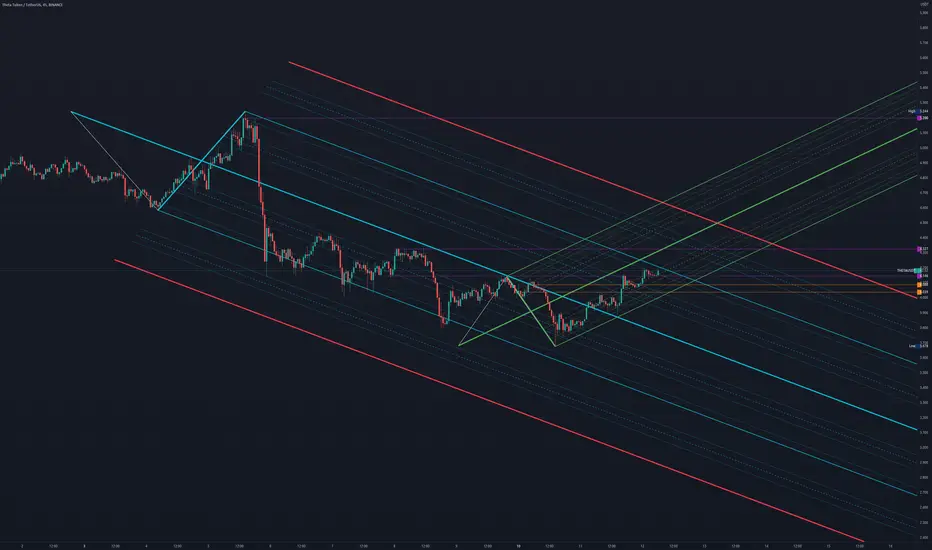
THETA: Price Action Poetry
THETA seems well positioned for a long with a minimal downside with a tight stop-loss.
A counter short could also be an option with a even better stop-loss than a long.
THETA good level to collect some moreAs you can see at the strong support level and price can hold at this level.
I think we should collect/buy some more THETA tokens.

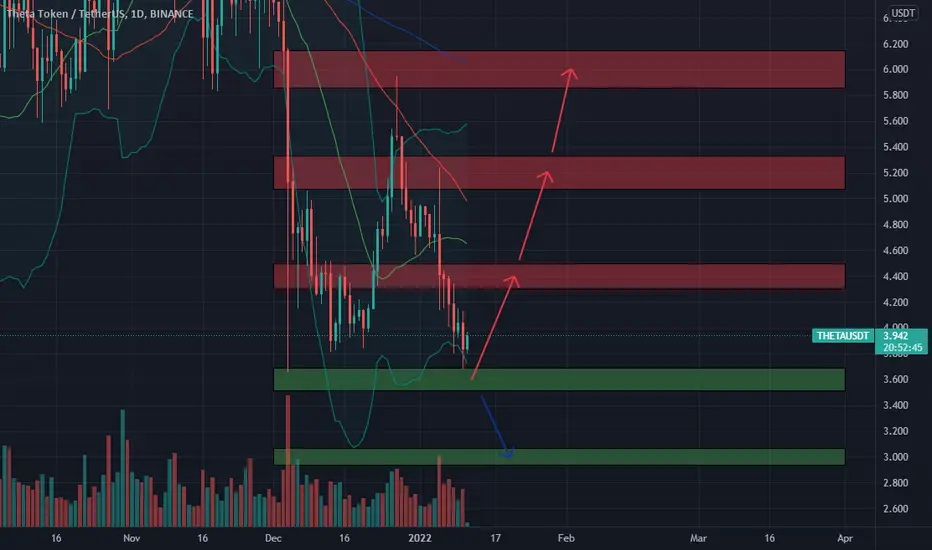
🆓THETA (THETA) Jan-11 #THETA $THETA
.
📈RED PLAN
♻️Condition : If 1-Day closes ABOVE 3.6$ zone
🔴Buy : 3.6
🔴Sell : 4.4 - 5.2 - 6
📉BLUE PLAN
♻️Condition : If 1-Day closes BELOW 3.6$ zone
🔵Sell : 3.6
🔵Buy : 3
❓Details
🚫Stoploss for Long : 10%
🚫Stoploss for Short : 5%
📈Red Arrow : Main Direction as RED PLAN
📉Blue Arrow : Back-Up Direction as BLUE PLAN
🟩Green zone : Support zone as BUY section
🟥Red zone : Resistance zone as SELL section
THETAUSDT Ready for Move ?! 🔥🔥 💎 THETAUSDT / Daily 💎
we have many support here ! Double bottom + Bearish channel midline as support + RSI bullish trend line
THETA can Claim MA200 On Daily Time Frame !
Theta USDT TA FA CryptoKenRFFor Spot Trading
Entry Price: 6.50
TP1 - 8.50 (31%)
TP2 - 10.50 (62%)
TP3 - 12.50 (92%)
TP4 - 14.50 (123%)
TP 5 - 16.50 (153%)
SL - 2.5 (57%)
Possible Entry: January 2022 (1st week to 2nd week)
Wait for the breaking of resistance and retest

THETA TOKEN HAS HIDDEN BULLISH DIVERGENCETHETA TOKEN: HIDDEN BULLISH DIVERGENCE
IN THIS WEEKLY CHART. Theta has been super bullish for nearly 600 days, yes we
did see a long consolidation period, but its coming to a decision time on
the weekly chart. looking at the RSI, its about to break resistance and
remain bullish for a large move up. If history would repeat itself, look
at the projected numbers from a bars pattern perspective. Another note
is that THETA LABS is the only crypto that has the patents to expand
broadband internet. They have said to have nearly 100 patents in the
future. just looking at the chart and some fundamentals. not advice, just
charts here. If you look at what Solana has done, these #'s are possible.

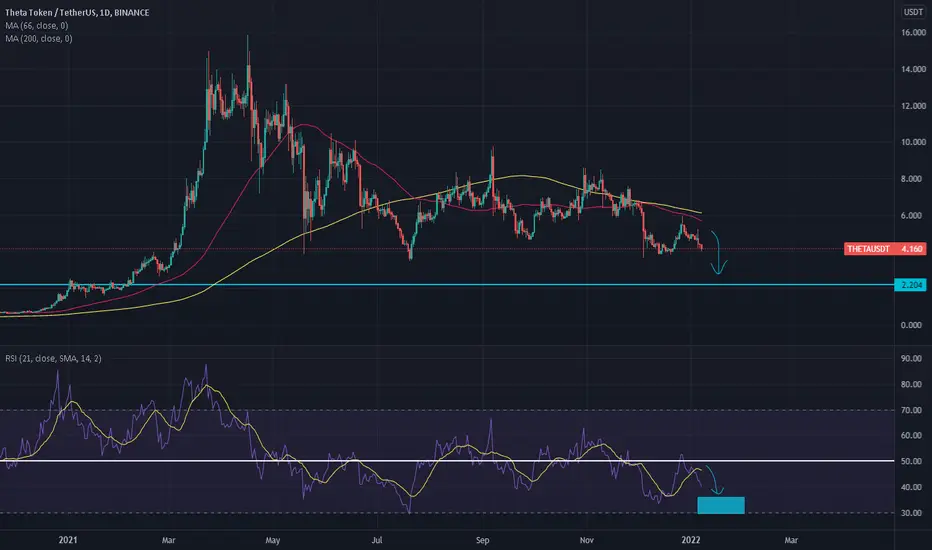
Theta 2 year moving averageLooks like theta is quickly approaching the 2 year moving average... may bounce off or may dip below...

Theta/USDTLooks like theta still has some room to the downside...
1. RSI below 50
2. 66 & 200 trending down
My guess is it will find support between $3-4