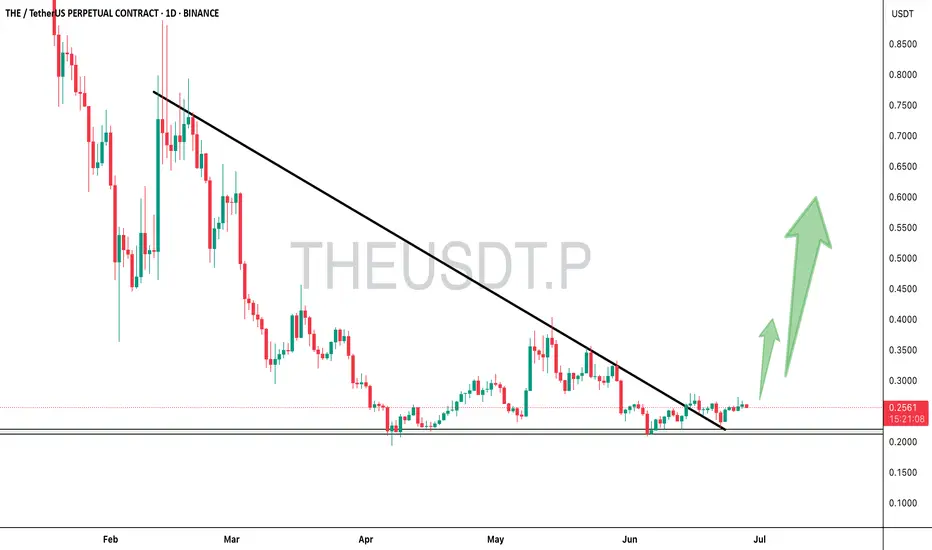
$THE Holding Strong, Next Stop: $0.60?TSX:THE looks good here, accumulated it before the bounce.
Now holding steady above the key support zone.
If this level continues to hold, a move toward $0.40–$0.60 could be next.
Retweet if you're watching TSX:THE
DYOR, NFA
#THE #CRYPTOMOJO_TA
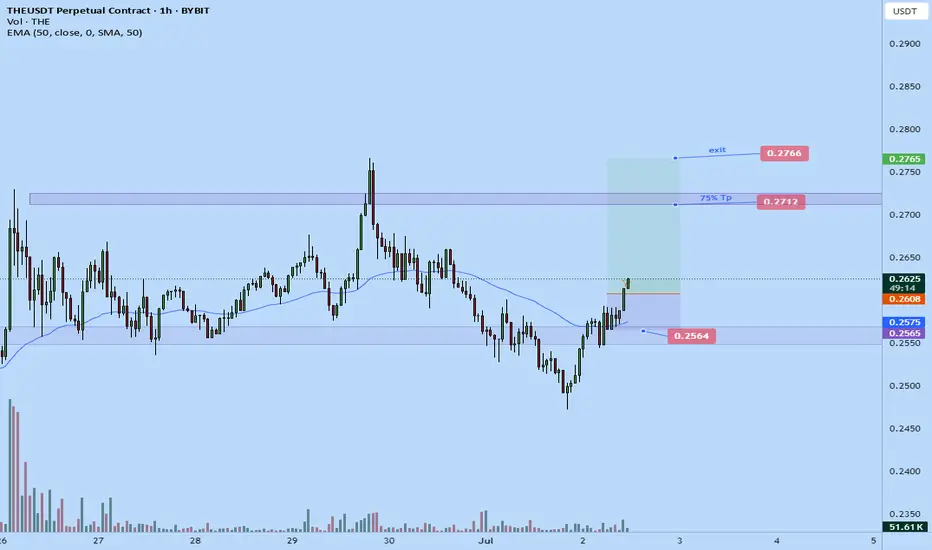
THEUSDT longTook a long position on #THEusdt
Aiming for $0.2712-0.2766 daily HH area
Time sensitive
Stop is at $0.2564
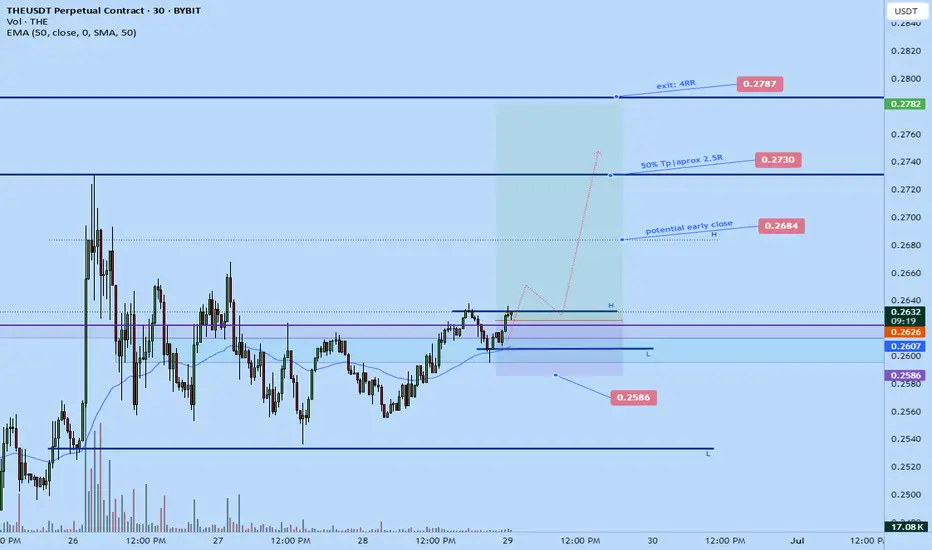
THEUSDT Expected Pumpt to $0.2787Just now opened a long position on THEusdt.
For this setup, I could have waited more for a tighter stop but I opt for a very clear invalidation stop which still gives me good RR. Though later on given I see more confirmation I might scale in a bit so that at $0.2684 potential early close area it's
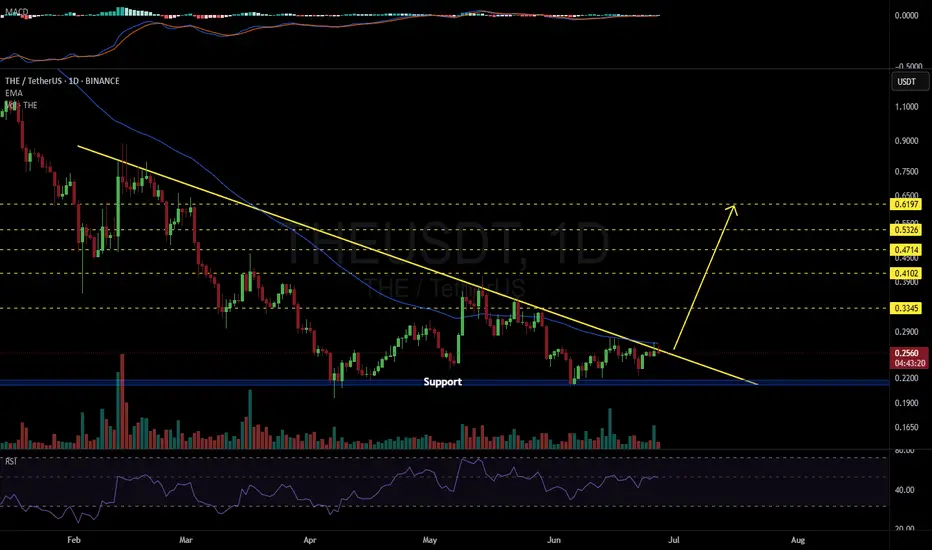
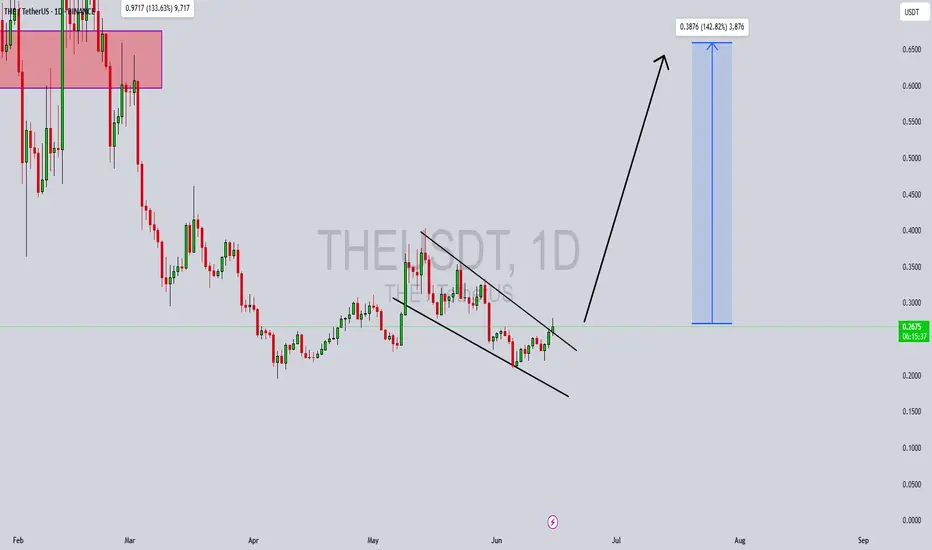
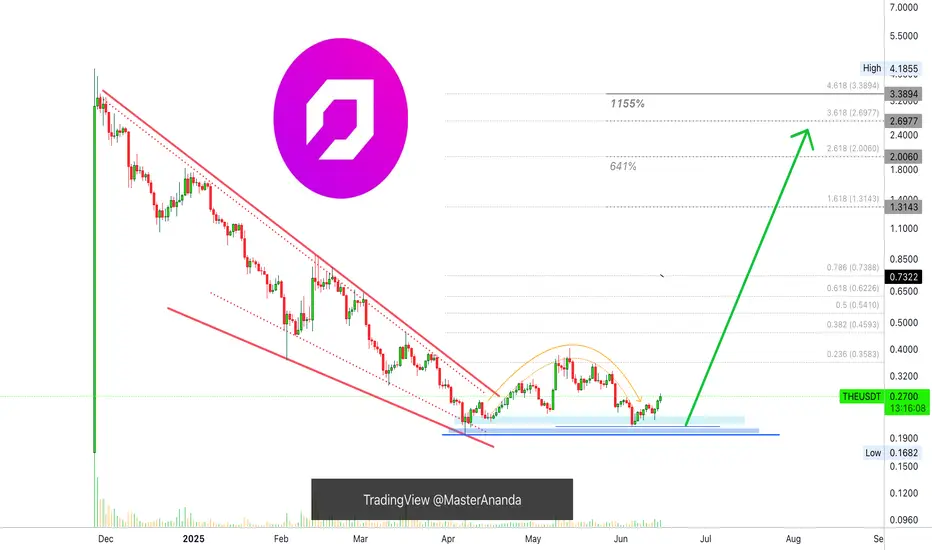
THEUSDT 1D#THE is trading inside a descending triangle on the daily chart.
In case of a breakout above the triangle resistance and the daily EMA50, the targets are:
🎯 $0.3345
🎯 $0.4102
🎯 $0.4714
🎯 $0.5326
🎯 $0.6197
⚠️ Always use a tight stop-loss to manage risk and protect your capital.
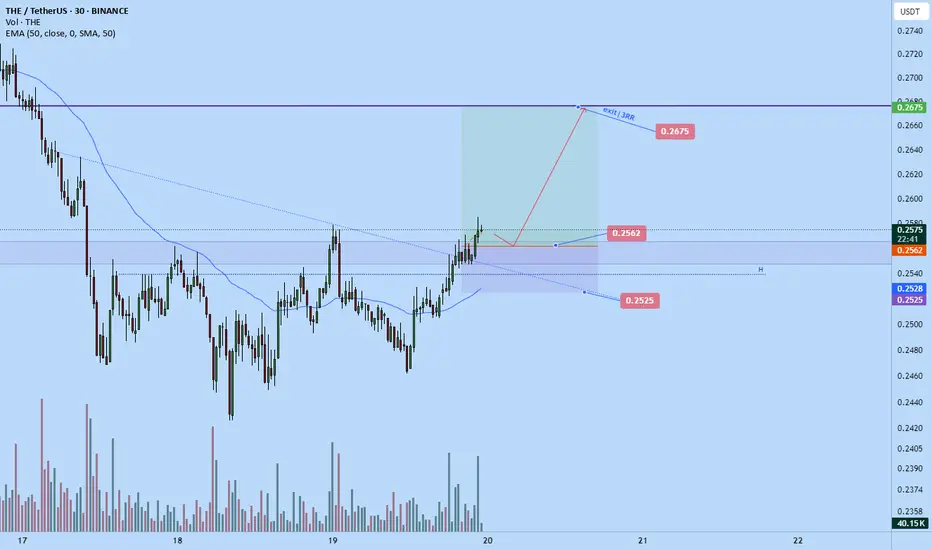
THEUSDT pump URGENT!Theusdt limit long order.
3RR trade
Limit entry price area: $0.2562
Stop: $0.2525
Target: $0.2675
Time sensitive
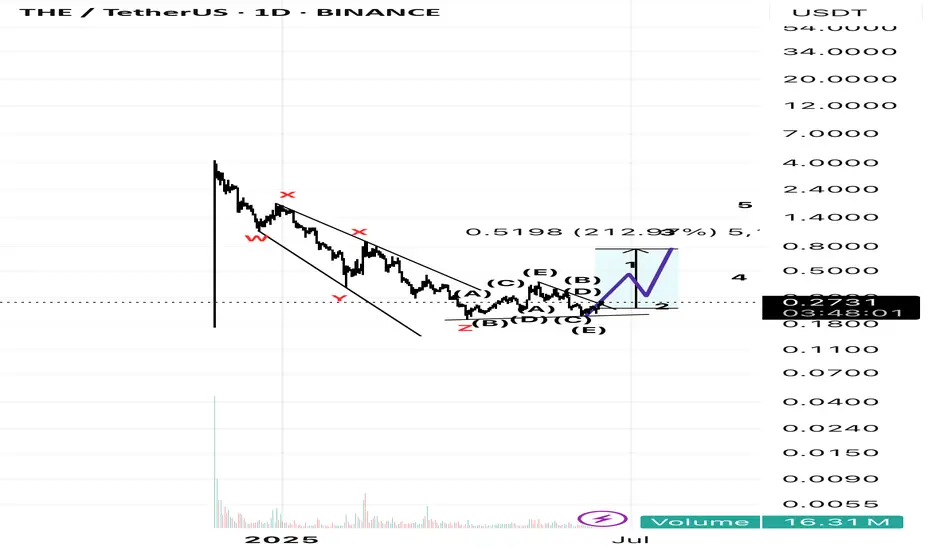
Altusdt time DI have another neat chart for you The chart in question, after a nearly flag-like pattern has recorded its entire corrective pattern, as well as its post-pattern and new movement The pattern with waves w.x.y.x.z It has managed to pass the double-combination correction It seems that we have entered a
THE Getting Ready For A Dump The is following a pattern in a channel that it can show dump Upto 0.185 - 0.171
Can Try to Make a Long From Support Level 0.185 - 0.171
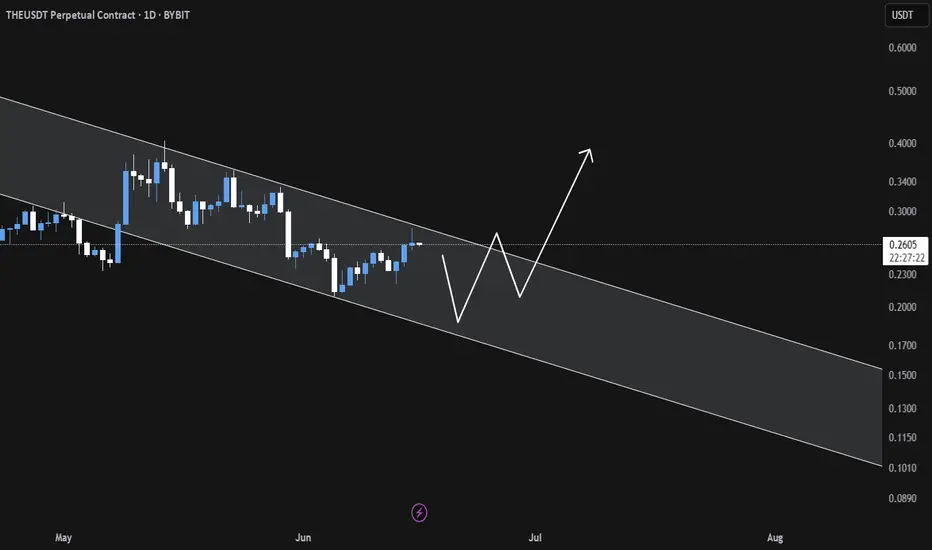
THEUSDT Forming Falling Wedge BullishTHEUSDT is showcasing a strong technical breakout from a falling wedge pattern, a formation widely regarded as bullish in the world of crypto trading. This structure typically signals the end of a downtrend and the potential start of a strong upward movement. With price action now breaching the wedg
Thena Ready To Move Now! Strong Short- & Long-Term (1,155% PP)I don't like to post the same charts because there are just too many options and we cannot even get close to looking at all those, specially with a limit of only ten post per day. But, with that said, here we have Thena again, THEUSDT, why? Because it is ready to move and a great time-based opportun
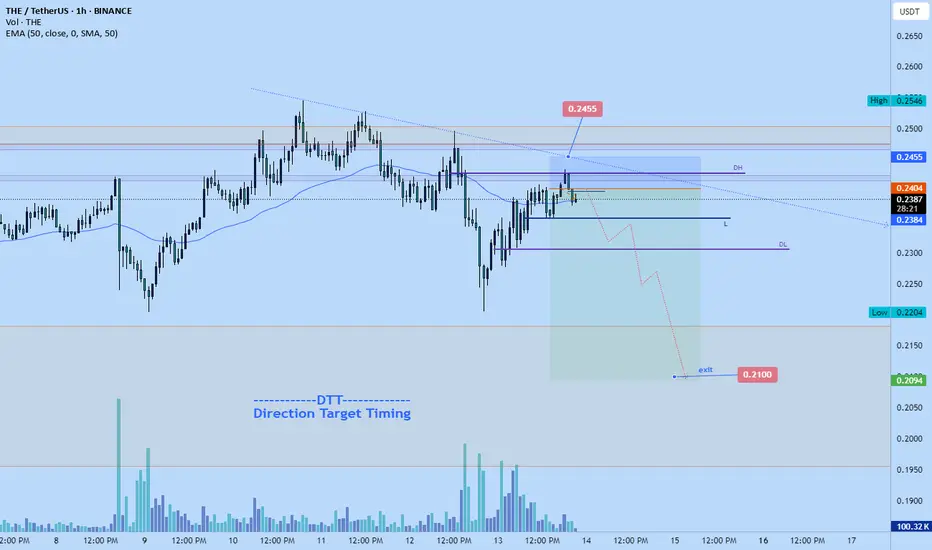
THE big weekendshort to $0.21stop: $0.2455
Tp: $0.21
6RR approximately from my entry.
Market seems more probable to continue trending down this weekend. Especially with the Israel Iran War fud happening.
The moment they start fighting each other again the market might react quickly and trend aggressively to its technical tar
See all ideas
Summarizing what the indicators are suggesting.
Oscillators
Neutral
SellBuy
Strong sellStrong buy
Strong sellSellNeutralBuyStrong buy
Oscillators
Neutral
SellBuy
Strong sellStrong buy
Strong sellSellNeutralBuyStrong buy
Summary
Neutral
SellBuy
Strong sellStrong buy
Strong sellSellNeutralBuyStrong buy
Summary
Neutral
SellBuy
Strong sellStrong buy
Strong sellSellNeutralBuyStrong buy
Summary
Neutral
SellBuy
Strong sellStrong buy
Strong sellSellNeutralBuyStrong buy
Moving Averages
Neutral
SellBuy
Strong sellStrong buy
Strong sellSellNeutralBuyStrong buy
Moving Averages
Neutral
SellBuy
Strong sellStrong buy
Strong sellSellNeutralBuyStrong buy
Displays a symbol's price movements over previous years to identify recurring trends.