US30 i dont know why you bought today, it was pretty clear that 43200 will be touched, i fact i hoped for 43000 to come to place a buy position, 44000 was a good point to sell also 43700, today it was selling day like yesterday,, please please wait a bit and focus at 43000 to buy
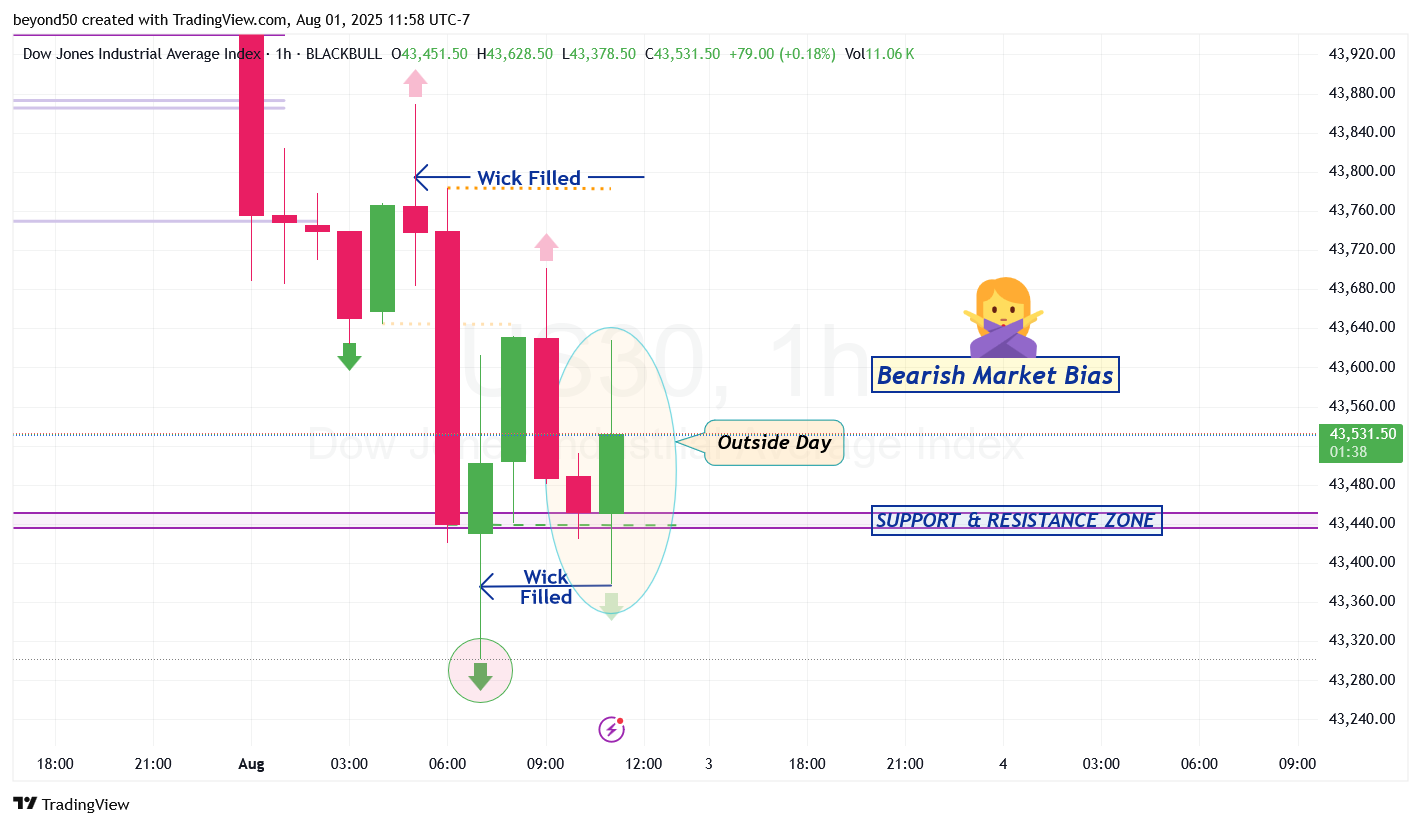
US30 *Last Call for This Session: On the Hourly chart, an Outside Day pattern showed up. That means that after this bull run is over, you'll see an immediate retrace to the downside.
Also, notice the blue arrows that indicate a wick has been filled. You can see that after a wick fill, the market can go in the opposite direction of the wick fill in a big way.
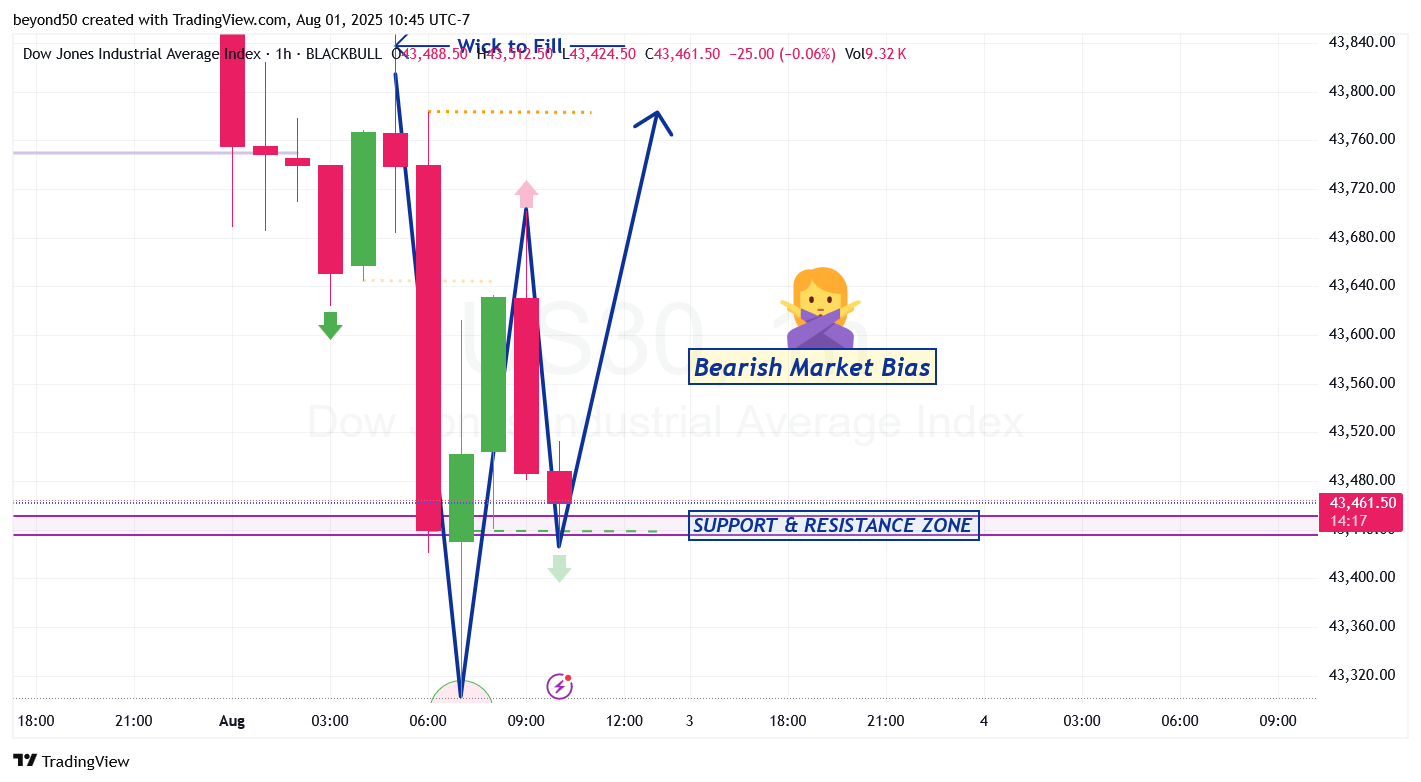
US30 If we're lucky, we'll get a simple W-shaped pattern right away on the Hourly. That would mean that the last and 4th leg would be a long bullish trend. Let's see if that can happen. (Drawn in Chart Below)
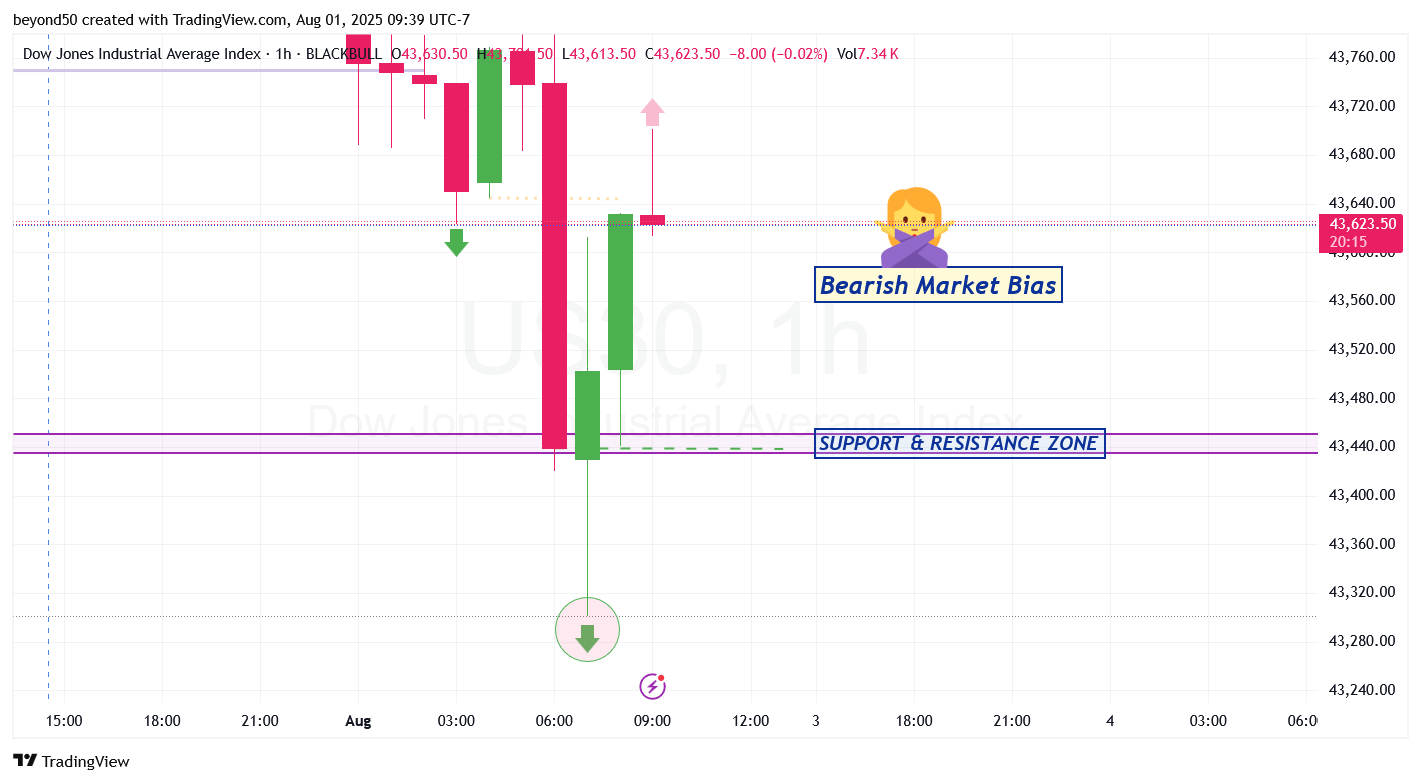
US30 A very tall W-shaped pattern is forming, which typically happens around a Pivot Low (shown as a circled arrow).
This bullish retrace is the 2nd leg of the W-shaped pattern to form the neckline. Afterwards is the bearish drop down for the 3rd leg to create another "V" point. The bears will show their hand soon for a descent towards the S&R Zone (that starts at 43,451.