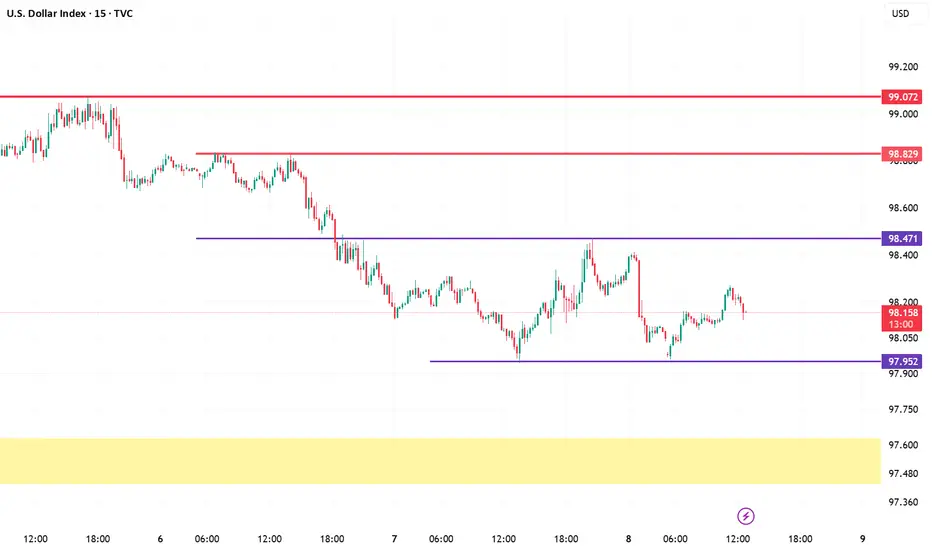
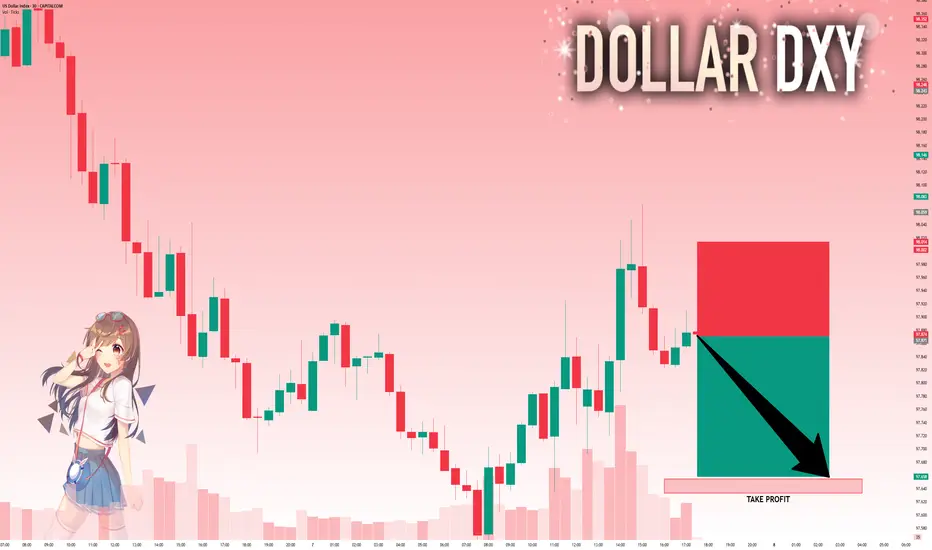
U.S. Dollar Index (DXY) – 15M Chart Analysis | Aug 8, 20251. Market Structure:
DXY is trading in a short-term range between 98.471 resistance and 97.952 support, following a sharp downtrend from the 99.072 high.
2. Supply Zone Pressure:
The 98.471 level acts as a strong intraday supply, repeatedly rejecting price and limiting bullish momentum.
3. Demand Zone Cushion:
The 97.952 level is holding as immediate support. Below that, the yellow zone around 97.60–97.45 is a major demand area where buyers may step in.
4. Momentum Bias:
Lower highs from the recent peaks signal ongoing bearish pressure. Short-term rallies are getting sold into, suggesting sellers control the market.
5. Next Move:
Bullish: Break above 98.471 opens path to 98.829–99.072 .
Bearish: Break below 97.952 targets the 97.60–97.45 demand zone.
USDINDEX trade ideas
DXY: Absolute Price Collapse Ahead! Short!
My dear friends,
Today we will analyse DXY together☺️
The market is at an inflection zone and price has now reached an area around 98.553 where previous reversals or breakouts have occurred.And a price reaction that we are seeing on multiple timeframes here could signal the next move up so we can enter on confirmation, and target the next key level of 98.471.Stop-loss is recommended beyond the inflection zone.
❤️Sending you lots of Love and Hugs❤️

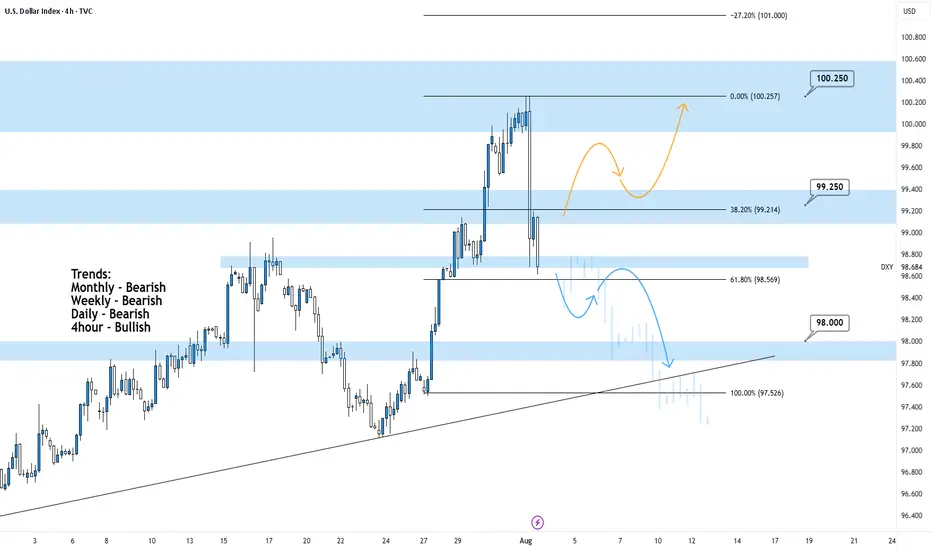
DXY 4Hour TF - August 3rd,2025🟦 DXY 4H Analysis Neutral idea
📅 August 3, 2025
🔹 Top-Down Trend Bias:
• Monthly – Bearish
• Weekly – Bearish
• Daily – Bearish
• 4H – Bullish
The dollar index is in a larger bearish cycle but just bounced from near-term resistance around 100.250. While the 4H shows temporary strength, we’re trading into major resistance and we may see it short lived.
🔍 Key Levels to Watch
• Support: 98.00
• Resistance Zones: 99.25 and 100.25
• 61.8% Fib: 98.57
Price is currently testing structure after rejecting from the 100.25 resistance zone. This area remains a strong ceiling unless the higher timeframe structure shifts.
✅ Scenario A: Bearish Continuation (Blue Path)
1. Bearish Structure confirmation below the current zone
2.If bearish rejection confirms, expect price to continue toward 98.00, possibly 97.50
3.Clean confluence with the higher timeframe trend
⚠️ Scenario B: Bullish Extension (Orange Path)
1.If price breaks and holds above 99.25, we may see a continuation toward 100.25
2.Short-term bullish strength, but against HTF bias
3.Must treat as a counter-trend idea unless confirmed with HTF structure shift
🧠 Final Notes
• 98.50 is the key decision zone, watch reaction closely
• Trend remains bearish on all major timeframes
• Don’t force the long, lean bearish unless structure proves otherwise
DXY to go extremely low due to Tariffs and Market ManipulationDXY to go extremely low due to Tariffs and Market Manipulation Reports
- The US Debt is almost over $38 Trillion in under 3 months
- Continue to monitor for weekly bearish signals on the chart
TVC:DXY
OANDA:USDCAD
OANDA:NZDUSD
Dollar Falls as Traders Price In Two 2025 Rate Cuts on Weak JobsDollar Falls as Traders Price In Two 2025 Rate Cuts on Weak Jobs Data
Introduction
In a significant turn of events for the global currency markets, the U.S. dollar has taken a sharp tumble as traders brace for a more dovish Federal Reserve. A weaker-than-expected U.S. employment report for July 2025 has prompted market participants to price in two interest-rate cuts by the Fed before the end of the year. This shift in monetary policy expectations comes during a time of heightened global uncertainty, much of it triggered by President Donald Trump's aggressive trade policies, which have already disrupted the $7.5 trillion-a-day foreign exchange market.
The Bloomberg Dollar Spot Index, a key gauge of the dollar’s strength against major currencies, plunged as much as 1%—marking its worst single-day performance since April 21, 2025. The greenback’s decline was mirrored by strong gains in rival currencies, with the Japanese yen appreciating 2.2% and the euro climbing more than 1% against the dollar.
This article delves into the recent developments surrounding the U.S. dollar, the implications of weak jobs data, the Federal Reserve’s likely response, and how Trump’s trade policies are shaping the broader economic landscape.
________________________________________
Weak Jobs Data Sparks Policy Shift
The July 2025 employment report came in well below expectations. Non-farm payrolls growth fell short, and revisions for May and June showed fewer jobs were added than previously reported. These figures suggest that the U.S. labor market is cooling more rapidly than anticipated, raising concerns about the sustainability of the post-pandemic economic recovery.
According to Helen Given, a foreign exchange trader at Monex Inc., “It’s now clear that the U.S. labor market is cooling fairly sharply. There’s a good chance that Trump’s crusade against Chair Powell ratchets up further in the coming days, and there could be further losses for the dollar to come as a result.”
The disappointing employment data has led traders to adjust their expectations for U.S. monetary policy. Futures markets are now pricing in two 25-basis-point rate cuts by the end of 2025, a stark reversal from the earlier outlook that suggested the Fed would remain on hold or even consider tightening if inflation remained sticky.
________________________________________
The Federal Reserve’s Dilemma
The Federal Reserve now finds itself in a precarious position. On one hand, inflation has moderated in recent months, giving the central bank more room to maneuver. On the other hand, a weakening labor market could indicate a broader slowdown that might require immediate action to prevent a recession.
Fed Chair Jerome Powell has come under increasing political pressure from President Trump, who has publicly criticized the Fed for keeping rates too high. Trump argues that rate cuts are necessary to support U.S. exporters and counteract the negative effects of his own tariffs and trade restrictions.
Historically, the Fed has maintained its independence from political influence, but in an election year, the pressure to act can become intense. If the Fed moves to cut rates, it will be seen as responding to both economic data and political dynamics—a delicate balancing act.
________________________________________
The Global Currency Market Reacts
The ripple effects of the dollar’s decline are being felt across the globe. The $7.5 trillion-a-day foreign exchange market, already under strain from geopolitical uncertainty and shifting central bank policies, has seen increased volatility in recent weeks.
The Japanese yen, often viewed as a safe-haven currency, surged 2.2% against the dollar following the release of the jobs data. Meanwhile, the euro gained over 1%, reflecting investor sentiment that the greenback’s era of dominance may be waning—at least for now.
Emerging market currencies also found some relief, as a weaker dollar generally eases pressure on countries with large dollar-denominated debts. However, the overall picture remains complex, as trade tensions and capital flow volatility continue to weigh on risk sentiment.
________________________________________
Trump’s Trade Policies: A Double-Edged Sword
President Trump’s trade strategies have been a central feature of his second term in office. From imposing tariffs on Chinese imports to renegotiating trade agreements with the European Union and Canada, Trump has sought to reshape the global trading system in favor of American manufacturers.
Yet these policies have produced mixed results. While some sectors have benefited from protectionist measures, others—particularly those reliant on global supply chains—have suffered from rising costs and retaliatory tariffs. The uncertainty generated by these policies has also dampened business investment, slowed global trade, and disrupted financial markets.
“The dollar had tumbled this year as Trump’s aggressive trade policies rocked the $7.5 trillion-a-day currency market, weighing on global growth outlook,” Bloomberg reported.
Investors are increasingly concerned that continued trade friction, combined with growing political pressure on the Fed, could lead to policy missteps that undermine the U.S. economy and erode confidence in the dollar.
________________________________________
Market Implications
The dollar’s recent decline has far-reaching implications for various asset classes:
1. Equities
U.S. equities have shown mixed reactions. While lower interest rates are typically supportive of stock prices, the underlying reason—economic weakness—has investors on edge. Sectors such as technology and consumer discretionary are expected to benefit from cheaper borrowing costs, but cyclical sectors may struggle if growth slows further.
2. Bonds
Treasury yields have fallen sharply as traders anticipate rate cuts. The 10-year yield dropped below 3.8%, its lowest level in months. The yield curve has also flattened, a potential warning sign of slowing economic momentum.
3. Commodities
A weaker dollar typically supports commodity prices, as most are priced in dollars. Gold, oil, and industrial metals all saw gains in the wake of the jobs report. However, demand-side concerns stemming from a global slowdown could limit the upside.
4. Emerging Markets
For emerging markets, a softer dollar offers both relief and risk. On the positive side, it reduces debt servicing costs and can attract capital flows. On the negative side, if the dollar’s weakness reflects a broader global slowdown, risk appetite could remain subdued.
________________________________________
Looking Ahead: What to Watch
As markets digest the latest economic data and policy signals, several key developments will be closely monitored:
1. Upcoming Fed Meetings
The Federal Open Market Committee (FOMC) will meet again in September. Markets will be keenly watching for any changes in tone or new forward guidance. A rate cut in September now appears increasingly likely, especially if subsequent data confirms a labor market slowdown.
2. Inflation Trends
While inflation has moderated, it remains a key concern for policymakers. If inflation rebounds unexpectedly, it could complicate the Fed’s ability to cut rates without stoking price pressures.
3. Geopolitical Risks
Trade tensions, particularly with China and the EU, remain unresolved. Any escalation could further destabilize markets and weigh on the dollar. Additionally, developments in the Middle East, Eastern Europe, and Southeast Asia could add to the uncertainty.
4. U.S. Presidential Politics
With the 2026 presidential election campaign already underway, Trump’s rhetoric and policy decisions will continue to influence market sentiment. His ongoing criticism of the Fed could erode confidence in U.S. institutions, particularly if it leads to perceived politicization of monetary policy.
________________________________________
Conclusion
The sharp fall in the U.S. dollar following weak July jobs data marks a pivotal moment in 2025’s economic narrative. With traders now pricing in two Federal Reserve rate cuts by year-end, the stakes have never been higher for policymakers, investors, and political leaders.
While a softer dollar can provide some temporary relief to exporters and boost inflation expectations, it also reflects deeper concerns about the strength of the U.S. economy and the unintended consequences of aggressive trade policies. President Trump’s confrontational approach to global trade, combined with mounting pressure on the Fed, is creating a complex and potentially volatile environment for markets.
As the year progresses, all eyes will be on the Federal Reserve’s response, the resilience of the U.S. labor market, and the evolving political landscape. In a world where headlines can move markets in seconds, clarity, stability, and sound policy have never been more critical.
________________________________________
Disclaimer: This article is for informational purposes only and does not constitute financial or investment advice.
DXYBack to the initial direction which is bullish momentum acoording to cot report. And I'm expectiong more continuation till maket close of before
DOLLAR INDEXDepartments Responsible for Each Economic Report
Indicator Responsible Department/Source
Average Hourly Earnings m/m U.S. Bureau of Labor Statistics (BLS), part of the Department of Labor
Non-Farm Employment Change BLS (Establishment Survey)
Unemployment Rate BLS (Household Survey)
Final Manufacturing PMI S&P Global/Markit (private company)
ISM Manufacturing PMI Institute for Supply Management (ISM, private sector)
ISM Manufacturing Prices Institute for Supply Management (ISM)
Revised University of Michigan (UoM) Consumer Sentiment University of Michigan (private/public university)
Construction Spending m/m U.S. Census Bureau, Department of Commerce
Revised UoM Inflation Expectations University of Michigan
How the Federal Reserve Interprets “Greater Than” or “Lower Than” Forecast
1. Average Hourly Earnings,
2.Non-Farm Payrolls,
3. Unemployment Rate
Higher than forecast (stronger labor market):
Tight labor markets (higher wages, more jobs, lower unemployment) suggest inflationary pressure.
The Fed may view this as a signal to keep rates higher for longer, as wage and job growth could fuel inflation.
Lower than forecast (weaker labor market):
Signals cooling in employment and wage growth, reducing upward pressure on inflation.
The Fed may see this as justification to consider easing policy or at least pausing further rate hikes.
2. Manufacturing PMIs (ISM, S&P)
Above 50: Signals expansion in manufacturing; below 50 indicates contraction.
Higher than forecast: Points to stronger economic momentum; the Fed may see upside risks to inflation.
Lower than forecast: Indicates weaker manufacturing activity; a possible sign of slowing demand, which could support rate cuts or dovish policy if persistent.
3. ISM Manufacturing Prices
Higher than forecast: Suggests inflationary pressures in manufacturing input costs; Fed interprets this as a reason for vigilance on inflation.
Lower than forecast: Implies easing input price pressures, supporting a dovish outlook if inflation remains subdued.
4. University of Michigan Consumer Sentiment & Inflation Expectations
Stronger than forecast sentiment: Consumers are more optimistic, often a sign of solid spending potential. May amplify inflation if this leads to greater demand.
Higher inflation expectations: If consumers expect higher future inflation, this can become self-fulfilling and the Fed may maintain tighter policy.
Weaker sentiment/lower inflation expectations: Reduces inflation risk, gives the Fed more flexibility to ease if needed.
5. Construction Spending
Higher than forecast: Indicates resilient investment and demand in the real economy.
Lower than forecast: Suggests cooling real estate and infrastructure spending; may support a dovish Fed outlook if sustained.
Summary Table
Data Surprises Interpretation for Fed Policy
Higher-than-forecast More hawkish; raises risk of persistent inflation
Lower-than-forecast More dovish; reduces pressure to hold rates higher
The Fed looks at the overall pattern across these data. Persistent upside surprises heighten concerns about inflation, supporting tighter policy. Downside surprises suggest cooling economic momentum and may encourage future rate cuts or pauses. The relative impact depends on which indicators surprise and the broader economic context.
#DXY #DOLLAR

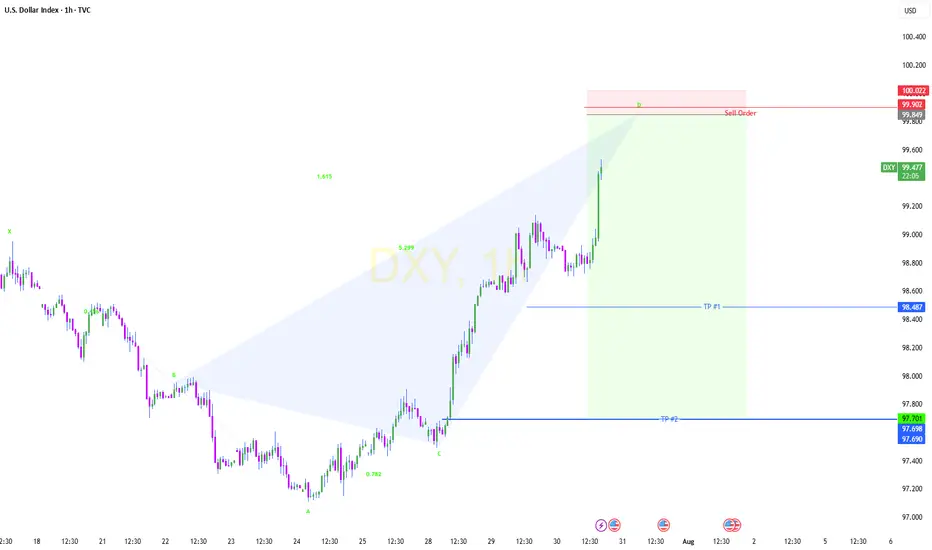
DXY ShortDXY is likely to fall from $99.8 upon reaching it, based on the Crab Pattern, potentially reaching targets TP #1 - TP #2.
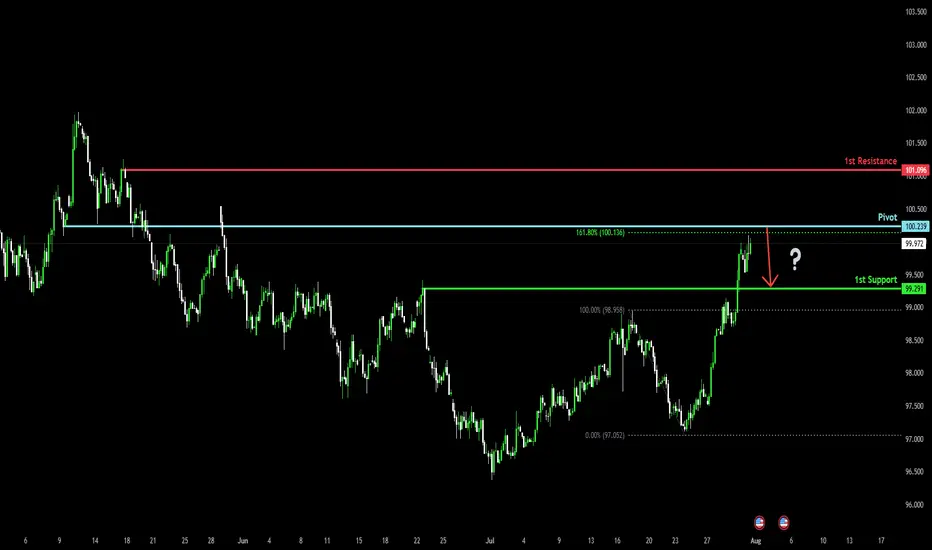
Bearish reversal off overlap resistance?The US Dollar Index (DXY) is rising towards the pivot and could reverse to the 1st support.
Pivot: 100.23
1st Support: 99.29
1st Resistance: 101.09
Risk Warning:
Trading Forex and CFDs carries a high level of risk to your capital and you should only trade with money you can afford to lose. Trading Forex and CFDs may not be suitable for all investors, so please ensure that you fully understand the risks involved and seek independent advice if necessary.
Disclaimer:
The above opinions given constitute general market commentary, and do not constitute the opinion or advice of IC Markets or any form of personal or investment advice.
Any opinions, news, research, analyses, prices, other information, or links to third-party sites contained on this website are provided on an "as-is" basis, are intended only to be informative, is not an advice nor a recommendation, nor research, or a record of our trading prices, or an offer of, or solicitation for a transaction in any financial instrument and thus should not be treated as such. The information provided does not involve any specific investment objectives, financial situation and needs of any specific person who may receive it. Please be aware, that past performance is not a reliable indicator of future performance and/or results. Past Performance or Forward-looking scenarios based upon the reasonable beliefs of the third-party provider are not a guarantee of future performance. Actual results may differ materially from those anticipated in forward-looking or past performance statements. IC Markets makes no representation or warranty and assumes no liability as to the accuracy or completeness of the information provided, nor any loss arising from any investment based on a recommendation, forecast or any information supplied by any third-party.
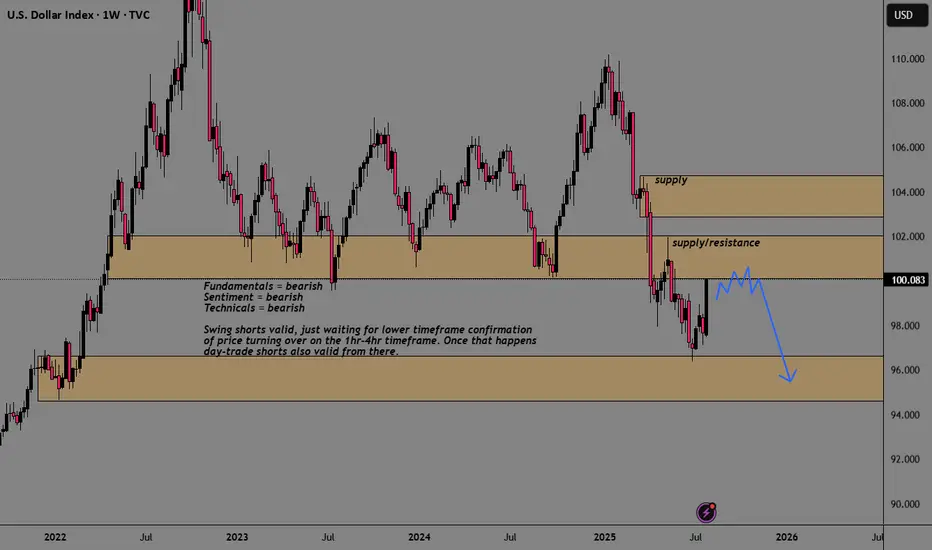
DXY USDOLLAR CRASH Incoming!Long-term fundamentals are bearish
Long-term sentiment = bearish
Long-term technicals = bearish
Trump wants a weaker dollar + FED injecting endless amounts of cash into the markets
driving stocks/ gold up, and the dollar down, losing purchasing power.
My plan is to look for shorts on the 1hr-4hr timeframe with lower timeframe confirmation.
Once price starts turning over, day-traders can join in.
Agree or disagree?
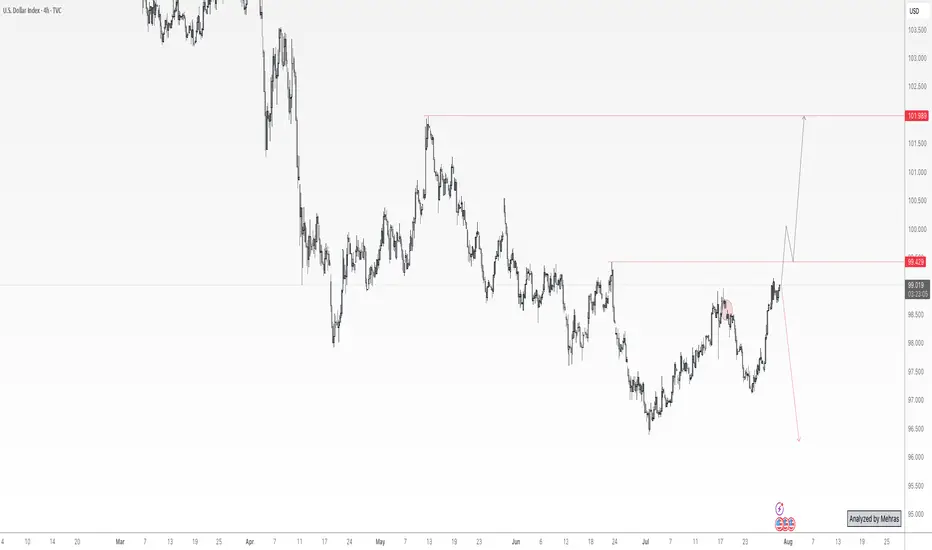
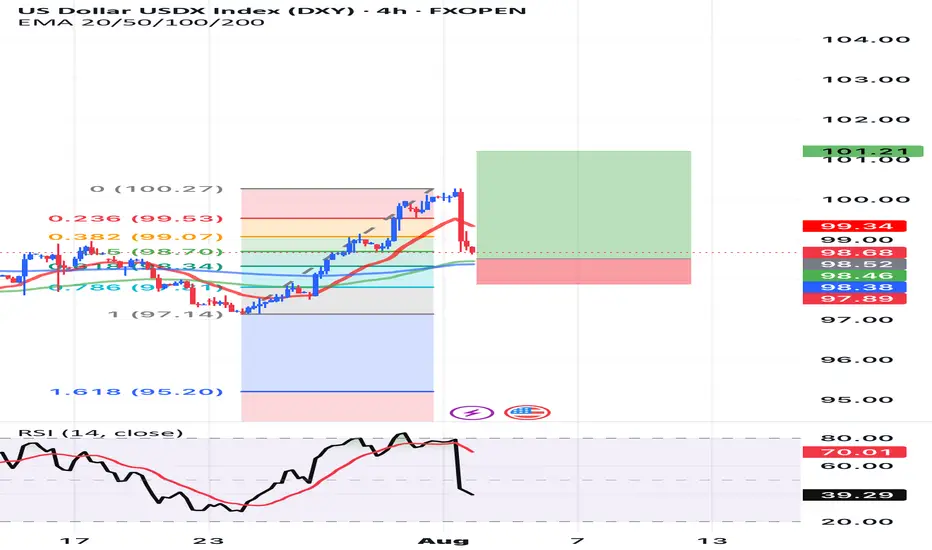
DXY Bulls Ready — Can Powell Spark the Rally?📊 DXY Pre-FOMC Outlook
In my previous analysis released on Monday, I expected the Dollar Index to fill the gap around the 98.60 zone and range below the key red line at 99.429.
Now, with less than 8 hours left until the highly anticipated FOMC rate decision, it’s time to take a closer look at tonight’s event and what it could mean for the markets.
From a purely technical perspective — setting the news aside — the Dollar Index looks ready to break through the crucial 100 level and kick off a strong bullish rally.
However, recent political pressure from Trump urging rate cuts, along with visible tension between him and Fed Chair Jerome Powell, has created uncertainty. If it weren’t for these conflicting signals, I would’ve confidently expected a clean breakout above 100.
As much as I enjoy trading news-driven events, I’ll likely stay out of the market tonight and observe from the sidelines. The setup is tempting, but the dual narratives make it risky.
That said — if you ask for my final take — I believe the stage is fully set for a bullish dollar and a corresponding drop in gold, EUR, GBP, and other major assets.
Let’s see how it plays out. 👀💥
Technical Analysis of the US Dollar Index (DXY) | 4-Hour Timefr🟢 Technical Analysis of the US Dollar Index (DXY) | 4-Hour Timeframe
On the 4-hour chart, the US Dollar Index has recently formed a Drop-Base-Drop (DBD) structure and is now positioned on a significant support level. This area can play a critical role in traders' decision-making for the next move.
✅ Current Situation:
After the initial drop, the price entered a short-term base/consolidation phase, then continued its decline and is now testing a demand zone (support). In this structure, two potential scenarios are worth considering:
🔼 Bullish Scenario:
If the price reacts positively to this support zone:
A rebound toward previous supply areas is likely.
Holding above the first resistance could indicate a temporary or even long-term trend reversal.
This level may provide a low-risk entry opportunity for buyers targeting a reversal.
🔽 Bearish Scenario:
If selling pressure continues and the current support breaks:
A further drop as part of a third wave (impulse) may unfold.
Lower support zones would become the next target areas for sellers.
Breakout from the channel again?After a long period of ranging, the DXY finally managed to break the range's ceiling last week and even gave us a channel confirmation afterward. But if you remember, there were several major news events last week, with the last one on Friday causing the price to fall back into the range. Now we can see that an ascending channel has formed inside the range, and the price is currently at the bottom of that channel. If it manages to break out of the channel again, there’s a chance that this time the trend might truly reverse.
DXY (USDX): Trend in daily time frameThe color levels are very accurate levels of support and resistance in different time frames, and we have to wait for their reaction in these areas.
So, Please pay special attention to the very accurate trend, colored levels, and you must know that SETUP is very sensitive.
(((((we have two trend)))))
BEST,
MT
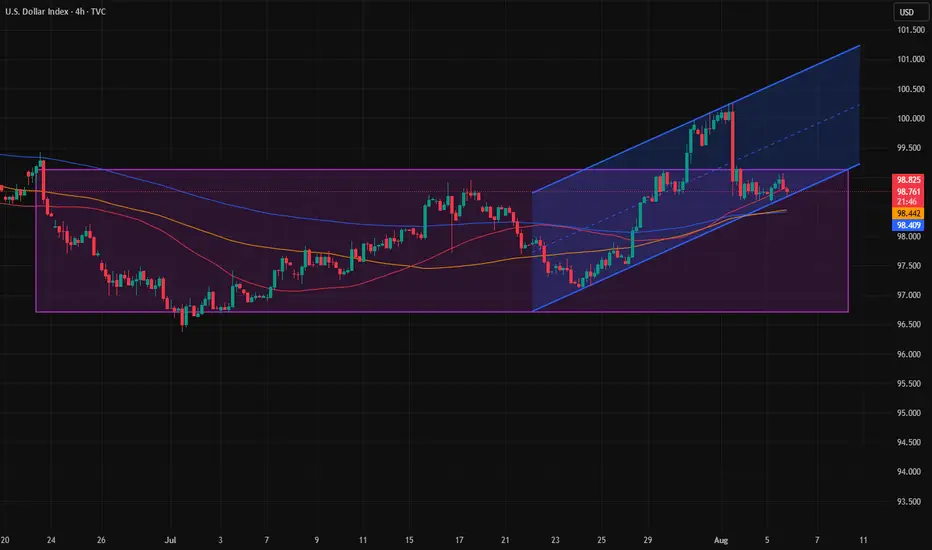
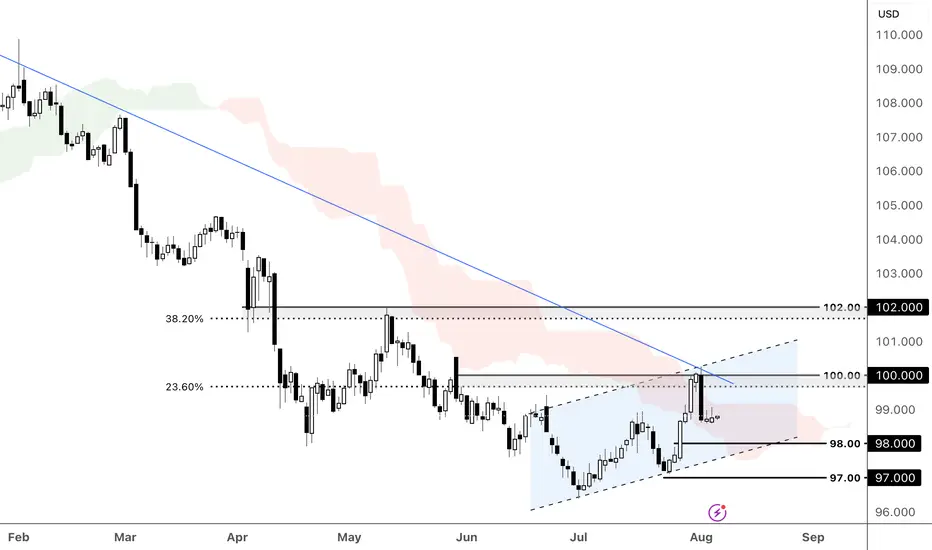
DXY is testing the descending trend line, breakout happening? The US dollar firmed as Trump's escalating tariff threats, from pharma to Indian exports, amplified trade tensions and boosted safe-haven flows. Despite rising global uncertainty, optimism over a possible US-China trade truce extension and a sharply narrower trade deficit also underpinned dollar strength.
DXY retreated below the descending trend line and the ascending channel's upper bound. The price is consolidating below the 100.00 psychological resistance, which aligns with the 23.6% Fibonacci Retracement. A rebound from the support at 98.00, in line with the ascending channel's lower bound, could prompt a retest of the channel's resistance, paving the way for further gains toward the 38.2% Fibonacci Retracement and 102.00 resistance, upon breaking 100.00. Conversely, a bearish breakout of the channel and close below the 98.00 support could prompt a further decline toward the following support at 97.00.
By Li Xing Gan, Financial Markets Strategist Consultant to Exness
DXYThe DXY, or US Dollar Index, measures the value of the US dollar against a basket of six major world currencies: the euro (EUR), Japanese yen (JPY), British pound (GBP), Canadian dollar (CAD), Swedish krona (SEK), and Swiss franc (CHF). It is a weighted index, with the euro having the largest share, making movements in EUR/USD especially influential on the index. The DXY was created in 1973 by the US Federal Reserve to provide a clear benchmark for the dollar’s international strength after the collapse of the Bretton Woods system.
Since its inception, the DXY has served as a vital gauge of the dollar’s performance in global trade and financial markets. Historically, it reached its all-time high near 164.72 in 1985, during a period of aggressive US interest rate hikes and a strong economic expansion. Conversely, it hit its all-time low around 70.70 in 2008, at the peak of the global financial crisis, when confidence in the US economy sharply declined.
The index typically rises when investors seek safety in the US dollar, especially during global risk-off events or when US interest rates are relatively high. It also tends to strengthen during periods of US economic growth, reduced liquidity, or tightening by the Federal Reserve. On the other hand, the DXY weakens when the Federal Reserve cuts rates, inflation rises, or investor sentiment shifts toward riskier assets and other global currencies.
In the years following the COVID-19 pandemic, the DXY saw sharp movements. It rallied strongly in 2022 as the Federal Reserve raised interest rates aggressively to combat inflation, reaching levels above 114. This was followed by a pullback as inflation cooled and expectations of rate cuts emerged in 2023 and 2024. As of August 2025, the DXY stands at approximately 93.4, reflecting a weaker dollar compared to its recent highs, influenced by a more dovish Federal Reserve, growing US debt concerns, and rising investor interest in alternative assets such as gold and other currencies.
The DXY remains a key tool for traders, economists, and policymakers to assess the dollar’s position in the global economy. Its movements affect everything from commodity prices and trade balances to emerging market capital flows and inflation pressures worldwide.
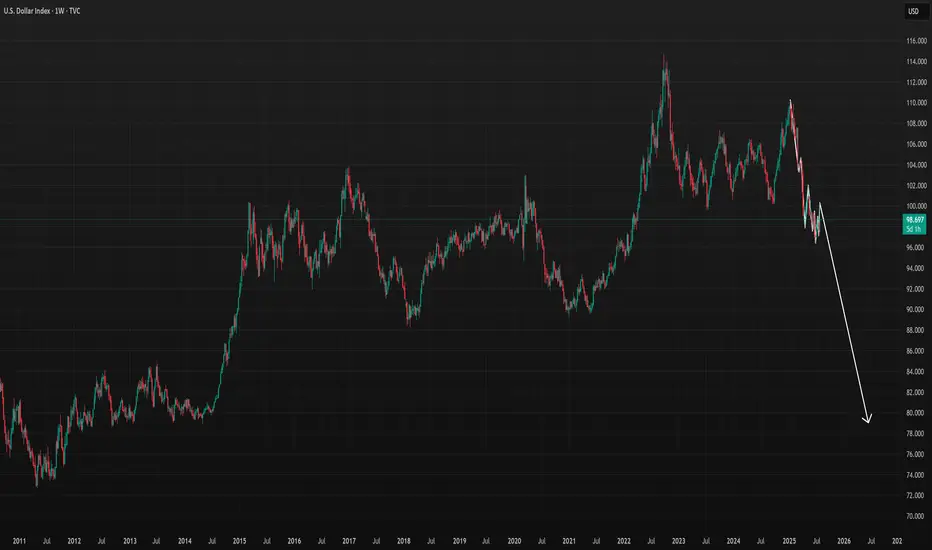
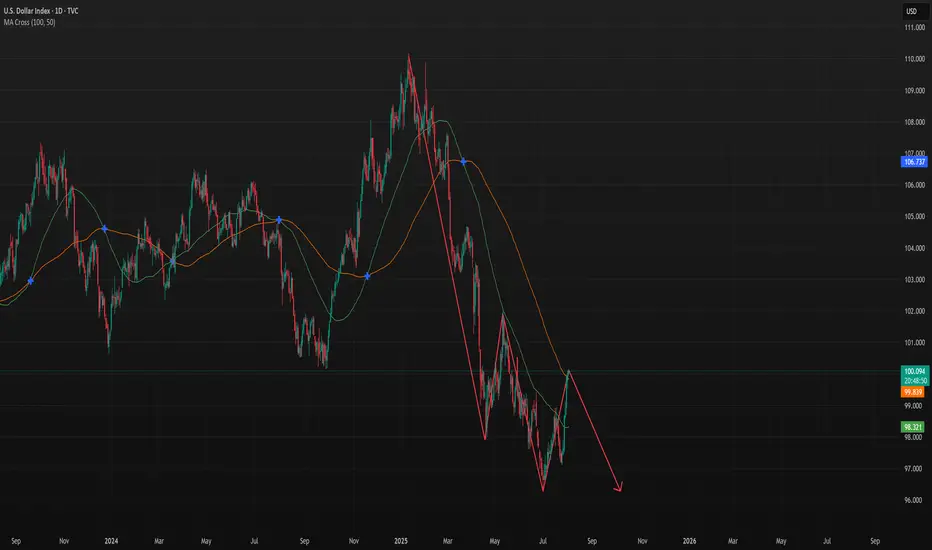
Dollar Index in Danger: Patterns Point to More DownsideThe dollar index (DXY) is flashing serious warning signs. In this video, I break down the technical evidence behind my bearish outlook on both the monthly and daily charts. The head and shoulders pattern we spotted did work it's way to breaking the neckline BUT the target will Not be achieved as the data on the charts have changed. On the daily charts we have a strong bearish engulfing candle, there is also an RSI divergence in the overbought zone, stochastic indicator has turn down and momentum is also following along. The downtrend on the monthly timeframe has not formed any divergence yet so I expect price to fall below the previous month's low in the coming weeks.
There will be bounces from support zones on the daily and 4 hours, these will be opportunities for good entries.
If you’re holding USD or trading around it, this is a must-watch. The signals are clear—are you prepared?
Cheers and I wish everyone a profitable trade in the coming week.

DXY - Possible Down Swing to continue furtherTVC:DXY
CMCMARKETS:USDCAD
OANDA:NZDUSD
CMCMARKETS:EURUSD
We may have a further down swing pattern forming let's continue to see if it passes the resistance area.
DXY: Absolute Price Collapse Ahead! Short!
My dear friends,
Today we will analyse DXY together☺️
The in-trend continuation seems likely as the current long-term trend appears to be strong, and price is holding below a key level of 97.871 So a bearish continuation seems plausible, targeting the next low. We should enter on confirmation, and place a stop-loss beyond the recent swing level.
❤️Sending you lots of Love and Hugs❤️
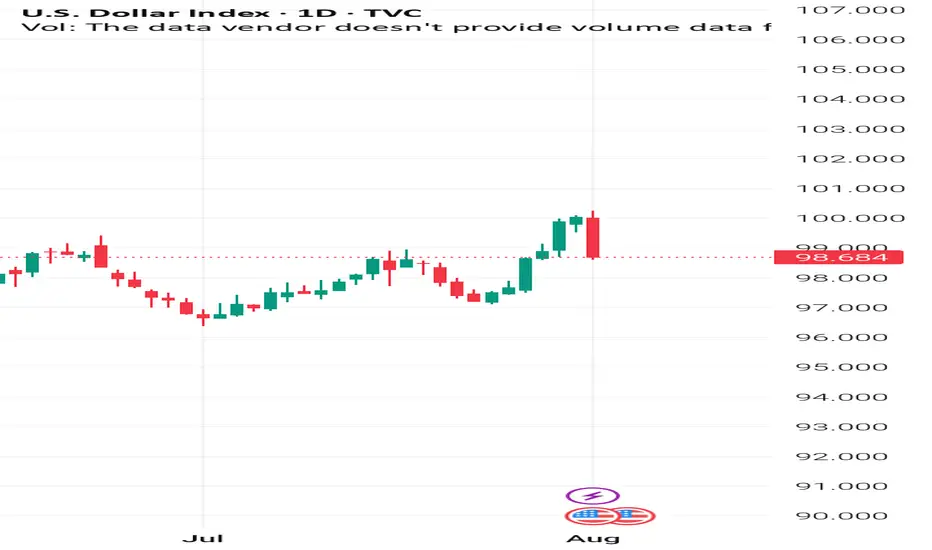
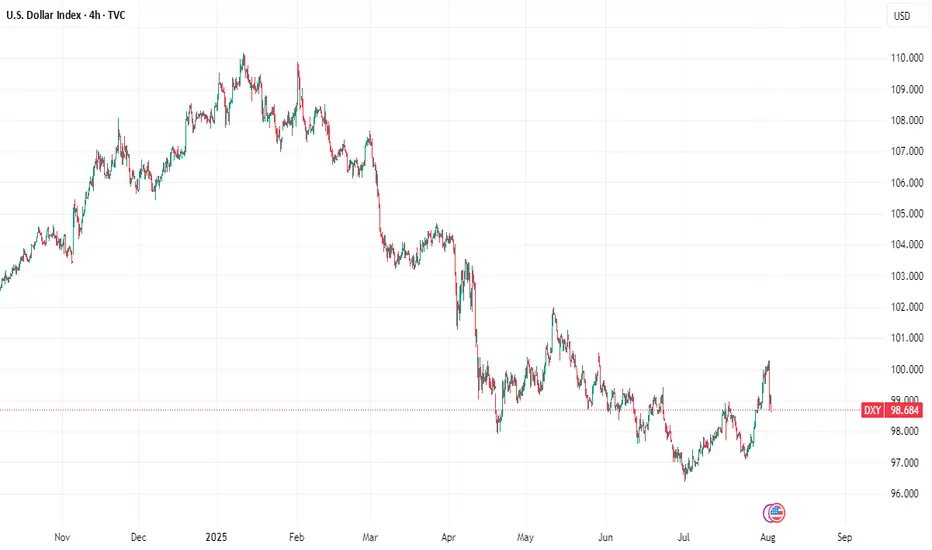
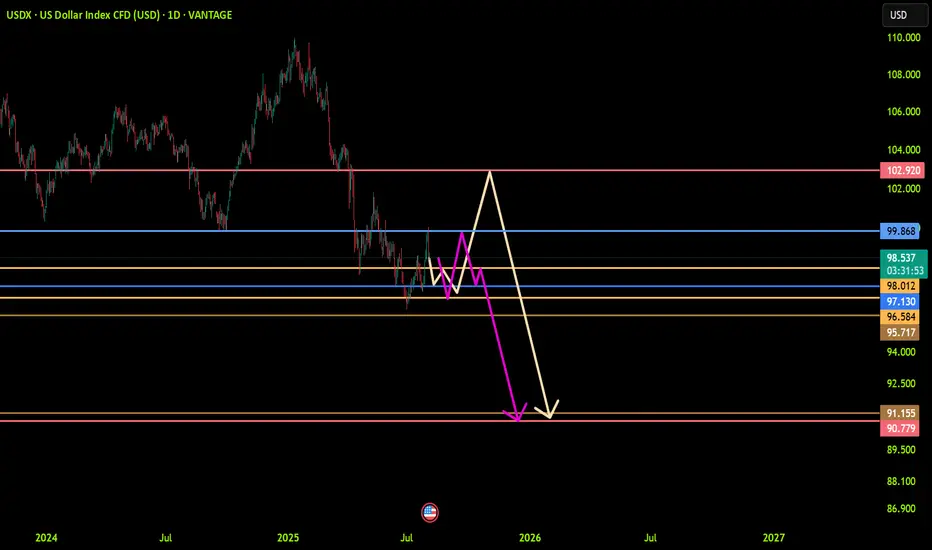
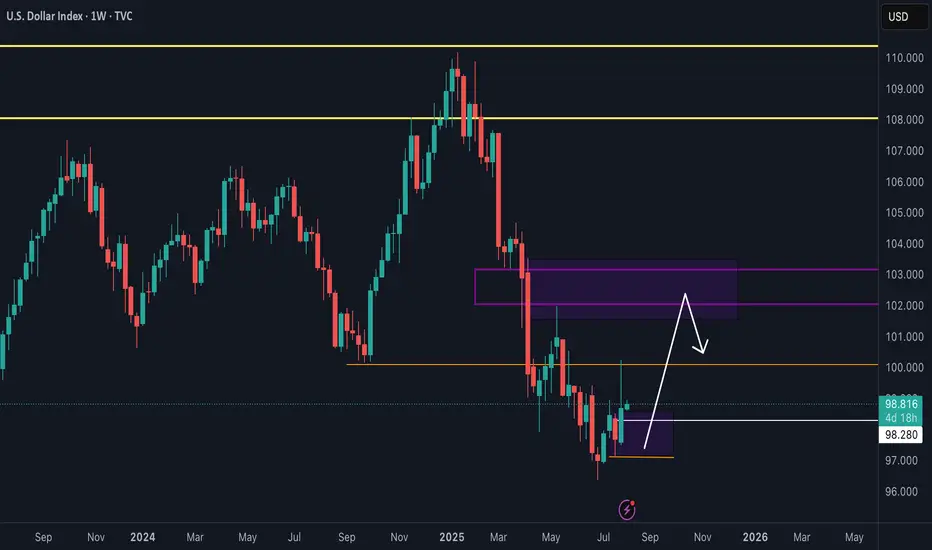
Dollar Index ProjectionWhere We Were – Market Structure Recap,
The Dollar Index completed a six-month range (110.176 to 96.768) with a bearish engulfing pattern, signaling long-term weakness. From March to June, DXY printed consistent lower lows and closes. July marked a shift with a higher high and close, indicating a possible retracement toward premium levels within the broader downtrend.
Where We Are Now – Current Market Conditions,
DXY is trading near the bottom of its range, interacting with a monthly price imbalance. Last week’s candle closed higher (higher high, higher close), suggesting short-term bullish control.
On the daily timeframe, structure has shifted into a potential sell-to-buy scenario. A new range is defined, and the 62% Fibonacci retracement overlaps with a bearish order block — a likely accumulation zone. The recent daily low is now critical support for this short-term bullish case.
Where We’re Going – Weekly Outlook,
The immediate outlook favors a bullish retracement targeting liquidity above last week’s high and into the monthly imbalance. If support holds, continuation toward premium levels is likely. A break below support invalidates the bullish scenario and shifts the structure bearish.
A false break and rejection (turtle soup) could still keep the bullish case intact if followed by strong buy pressure.
Video Link: www.youtube.com
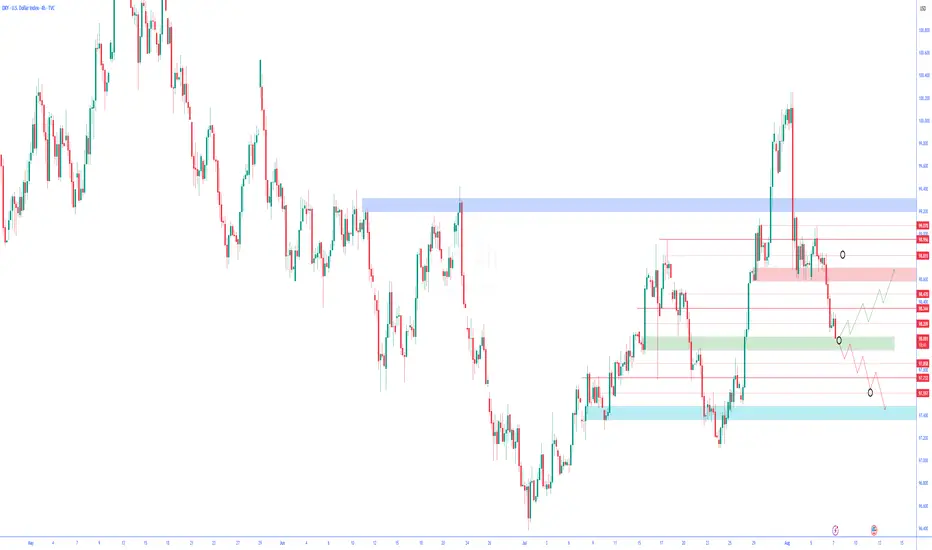
Technical Analysis | DXY | U.S. Dollar Index4-Hour Timeframe🔍 Technical Analysis | DXY | U.S. Dollar Index
4-Hour Timeframe
After hitting a strong supply zone marked in blue at the top of the chart, the price faced selling pressure and entered a bearish phase. Currently, the price is trading within a decision zone between buyers and sellers, where both bullish and bearish scenarios are possible.
🔼 Bullish Scenario:
If the price finds support at the mid-level support zone marked in green, and signs of a bullish reversal appear—such as proper candlestick formation or a renewed breakout of minor resistances (creating higher highs)—then the index is expected to move toward higher resistance levels.
🔽 Bearish Scenario:
Considering the market structure, if the mid-level support is lost and the price settles below this zone, the downtrend may accelerate. The dollar index could then move toward the lower support zone, marked in blue, which previously acted as a strong barrier and reversal area. This level may again serve as a key point to watch for market reactions.
✅ Conclusion
The U.S. Dollar Index is currently in a corrective phase, oscillating within a sensitive range. The price reaction to the current support zone will likely determine the next directional move. Therefore, it is recommended to wait for a confirmed breakout or bounce from this area before entering any trades.

DXY POTENTIAL SCENARIO two possible scenarios for DXY in next coming weeks , watch the support and wait for confirmation before buying Dollar ,

USD to continue down?: Weekly Review/ fundamental analysis There was a lot of information to take in during the week starting Monday 28 July. A US / EUR trade deal announcement, US GDP, MICROSOFT earnings all contributed to positive market sentiment as the S&P continued to push all time highs. But in a reminder that anything can happen, a combination of NFP, AMAZON earnings and fresh TARIFF UNREST, ensured the week ended on a sour note.
The week got off to a good start with the US / EUR announcement. Although the news weakened the EUR as it appeared the US got the better end of the deal. And all of last weeks EUR positivity was unwound.
Despite the overall positive market mood at the beginning of the week, the currencies once again didn't quite correlate with the environment, as the USD and JPY both started the week particularly strong. Which could have been put down to 'EUR liquidity', meaning the USD and JPY benefited most from the weakness of the EUR. But, more likely, I suspected it was 'positioning' ahead of the important central bank interest rate meetings.
The meetings didn't disappoint, starting with the FOMC. The overall message was a continued reluctance to immediately cut interest rates. In a thinly veiled dig at the president, the line, "looking through inflation by not HIKING rates" sent the USD soaring as the probability of a September cut dropped to 40%.
A few hours later it was the BOJ'S turn. Although acknowledging inflation, a reluctance to immediately HIKE rates disappointed JPY bulls. And when added to positive MICROSOFT earnings, by Thursday's European session we had a peak JPY short opportunity.
But, alas, it wasn't long before disappointing Amazon earnings and the president stirring the tariff pot rocked the boat. And when Friday's NFP data 'surprised to the downside', the rot set in, the S&P dropped and in particular, sentiment for the USD crumbled. And the probability of a September rate cut significantly rose back up to 90%.
It's difficult to trade NFP at the best of times, but particularly when ISM data shortly follows. But I wouldn't argue with anyone who fancied a USD short on Friday.
I begin the new week with an open mind. I do think the S&P has a good chance of recovering (it's only natural for traders to use bad news as an excuse to take profits from all time highs). Sentiment for the USD could remain subdued, I suspect the US 10year will be a prominent part of the narrative.
On a personal note, outside of trading, drunk idiots smashing a bakery window and a member of staff leaving at short notice kept me busy. But I did manage one trade. A post BOJ 'short JPY'. It was coin toss between a post FOMC 'USD long' or a standard 'risk on AUD long'. I plumbed for the AUD. Ultimately, it wouldn't have mattered and the trade it profit.
Please feel free to offer thoughts questions, maybe you've spotted something I've not mentioned.
Results:
Trade 1: AUD JPY +1.3
Total = +1.3%