$ INDEX ~ Real Time Elliott Wave UpdatesThis is an update of a $ index chart I had previously posted. We see a Wave 1(Green) completed and a dip occurring. This dip is marked as Wave 2(Green) or Wave A(Blue). It has two readings because it could be a Zigzag, hence 2 or an A of a Flat, hence A. I will offer updates as the wave unfolds. All other analysis remains the same as I had previously posted and can be checked for references. Sentiment still remains buy.
USDINDEX trade ideas

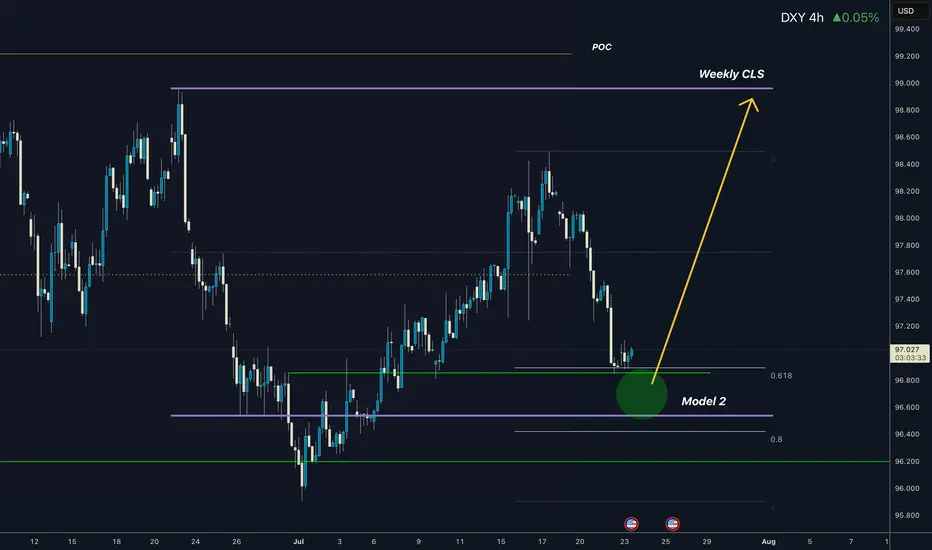
Dollar I Weekly CLS I Model 2 I Ready for pullbackYo Market Warriors ⚔️
Fresh outlook drop — if you’ve been riding with me, you already know:
🎯My system is 100% mechanical. No emotions. No trend lines. No subjective guessing. Just precision, structure, and sniper entries.
🧠 What’s CLS?
It’s the real smart money. The invisible hand behind $7T/day — banks, algos, central players.
📍Model 1:
HTF bias based on the daily and weekly candles closes,
Wait for CLS candle to be created and manipulated. Switch to correct LTF and spot CIOD. Enter and target 50% of the CLS candle.
For high probability include Dealing Ranges, Weekly Profiles and CLS Timing.
Trading is like a sport. If you consistently practice you can learn it.
“Adapt what is useful. Reject whats useless and add whats is specifically yours.”
David Perk aka Dave FX Hunter
💬 Don't hesitate to ask any questions or share your opinions
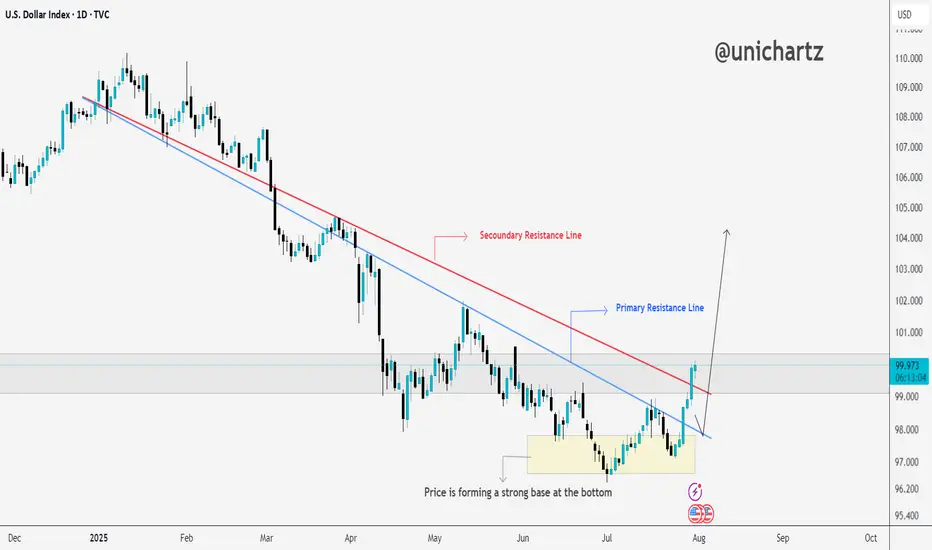
DXY Just Broke Resistance – Is This the Start of a Dollar Rally?As per our analysis, DXY has successfully broken above the primary and secondary resistance line.
If the price manages to close above the marked resistance zone, we could see further upside momentum ahead.
DOLLAR INDEX The federal funds rate is the interest rate at which U.S. banks and credit unions lend their excess reserve balances to other banks overnight, usually on an uncollateralized basis. This rate is set as a target range by the Federal Open Market Committee (FOMC), which is the policymaking arm of the Federal Reserve. The current target range as of July 2025 is approximately 4.25% to 4.5%.
The federal funds rate is a key benchmark that influences broader interest rates across the economy, including loans, credit cards, and mortgages. When the Fed changes this rate, it indirectly affects borrowing costs for consumers and businesses. For example, increasing the rate makes borrowing more expensive and tends to slow down economic activity to control inflation, while lowering the rate stimulates growth by making credit cheaper.
The Fed adjusts this rate based on economic conditions aiming to maintain stable prices and maximum employment. It is a vital tool of U.S. monetary policy, impacting economic growth, inflation, and financial markets.
In summary:
It is the overnight lending rate between banks for reserve balances.
It is set as a target range by the Federal Reserve's FOMC.
It influences many other interest rates in the economy.
Current range (July 2025) is about 4.25% to 4.5%.
1. ADP Non-Farm Employment Change (Forecast: +82K, Previous: -33K)
Above Forecast:
If ADP employment is much stronger than expected, the Fed would see this as a sign of ongoing labor market resilience. Robust job growth would support consumer spending, potentially keep wage pressures elevated, and could make the Fed less likely to ease policy soon. This reinforces the case for holding rates steady or staying data-dependent on further cuts.
Below Forecast or Negative:
If ADP jobs gain falls short or is negative again, the Fed may interpret it as a weakening labor market, raising recession risk and reducing inflationary wage pressures. This outcome could increase the chances of a future rate cut or prompt a more dovish tone, provided it aligns with other softening indicators.
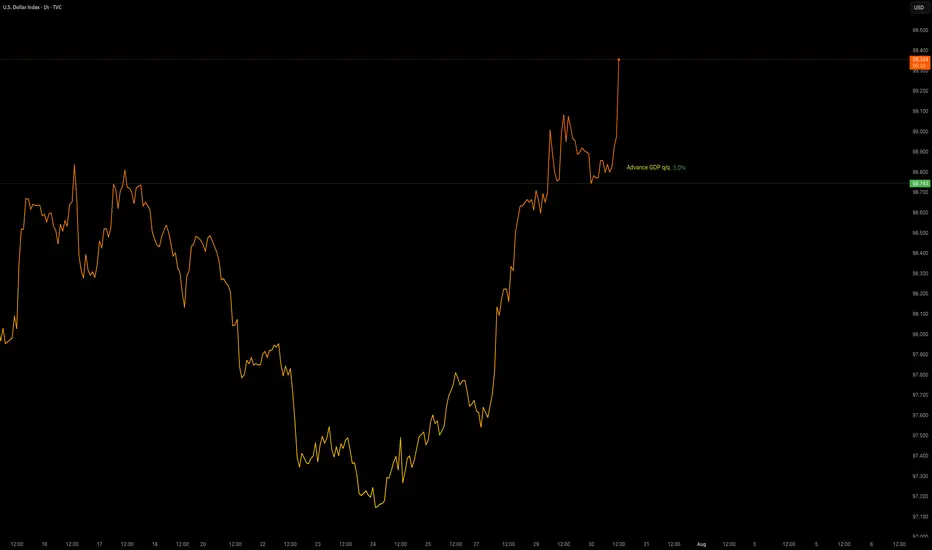
2. Advance GDP q/q (Forecast: +2.4%, Previous: -0.5%)
Above Forecast:
A GDP print above 2.4% signals surprisingly strong economic growth and likely sustains the Fed’s view that the U.S. economy is avoiding recession. The Fed may delay rate cuts or take a more cautious approach, as stronger growth can support higher inflation or at least reduce the urgency for support.
Below Forecast or Negative:
Weak GDP—especially if close to zero or negative—would signal that the economy remains at risk of stagnation or recession. The Fed may then pivot to a more dovish stance, become more willing to cut rates, or accelerate discussions on easing to avoid a downturn.
3. Advance GDP Price Index q/q (Forecast: 2.3%, Previous: 3.8%)
Above Forecast:
A significantly higher-than-expected GDP Price Index (an inflation measure) points to persistent or resurgent inflationary pressures in the economy. The Fed might see this as a reason to delay cuts or maintain restrictive rates for longer.
Below Forecast:
If the Price Index prints well below 2.3%, it suggests that inflation is cooling faster than anticipated. This outcome could allow the Fed to move toward easing policy if other conditions warrant, as price stability is more clearly in hand.
Bottom Line Table: Data Surprises and Likely Fed Reaction
Data Surprise Fed Outlook/Action
All above forecast Hawkish bias, rate cuts delayed or on hold
All below forecast Dovish bias, higher chances of rate cut
Mixed Data-dependent, further confirmation needed
Summary:
The Fed’s interpretation hinges on how these figures compare to forecasts and to each other. Stronger growth, jobs, and inflation = less rush to cut; weaker numbers = lower rates sooner. If growth or jobs are especially weak or inflation falls sharply, expect more dovish Fed commentary and a greater likelihood of future easing. Conversely, if the data all surprise to the upside, hawkish (rate-hold) messaging is likely to persist.
The U.S. Dollar Index (DXY) is a financial benchmark that measures the value of the United States dollar relative to a basket of six major foreign currencies. It provides a weighted average reflecting the dollar's strength or weakness against these currencies. The DXY is widely used by traders, investors, and economists to gauge the overall performance and health of the U.S. dollar on the global stage.
Key Features of the DXY:
Currencies included and their weights:
Euro (EUR) – 57.6%
Japanese Yen (JPY) – 13.6%
British Pound (GBP) – 11.9%
Canadian Dollar (CAD) – 9.1%
Swedish Krona (SEK) – 4.2%
Swiss Franc (CHF) – 3.6%
It was established in 1973 after the collapse of the Bretton Woods system to serve as a dynamic measure of the dollar's value.
The index reflects changes in the exchange rates of these currencies versus the U.S. dollar, with a higher DXY indicating a stronger dollar.
The DXY influences global trade dynamics, commodity prices (like oil and gold), and financial markets.
It is calculated as a geometric mean of the exchange rates weighted by each currency's significance in U.S. trade.
#DXY
In essence, the DXY is a crucial tool to assess how the U.S. dollar is performing against its major trade partners’ currencies, helping market participants make informed decisions in foreign exchange and broader financial markets.

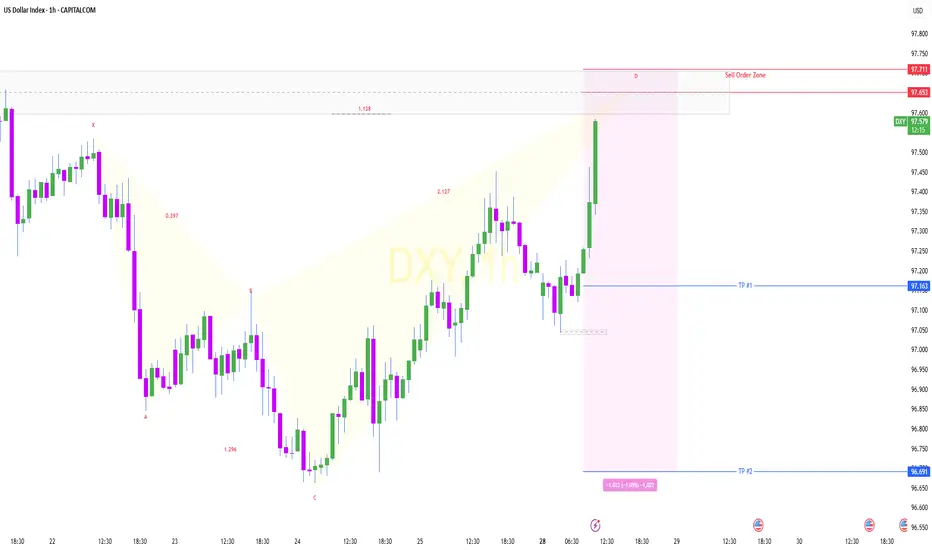
DXY - trade - market structure DXY - trade - market structure , easy setup, clean setup , good probability, if this happen is a big win, use risk and trade managment
DXY Top-Down Analysis: Market Structure & Directional Bias This video demonstrates a top-down analysis of DXY. I'll show you how to identify market structure, value areas, directional bias, and key support and resistance levels. You'll learn to analyze the market from weekly to hourly timeframes using Heikin-Ashi candles and the 200 EMA.

the retail trader outlookWe see that the wedge pattern has been completed and the bullish market is strong as the candles a huge, this is a high risk low reward trade as it clear and obvious to the vest public that the markets wants to rally. the role of the dollar price plays a vital role in this not happening as we see that the dollar has formed the yearly low as is starting to move up in an increasingly high speed suggesting that Gold is more likely to be affected by the sudden Rally in the dollar currency and the opposite is true given a drop in dollar.
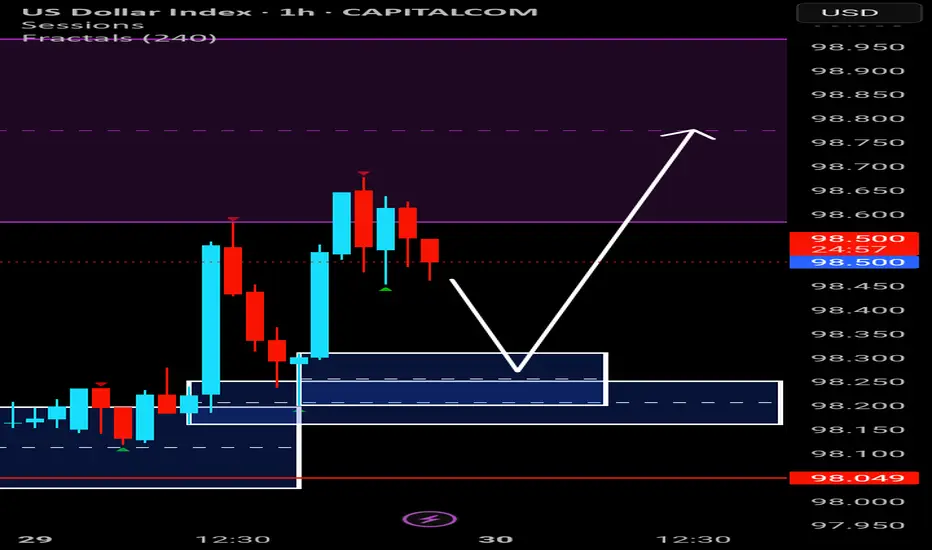
DXY Goes 98.200 and then Bullish The DXY GOES 98.200 IN 1H OB then we see again dxy is bullish and next target is 99 to 100.
USD Dollar Index (DXY): Pushing Higher As Forecast!Welcome back to the Weekly Forex Forecast for the week of July 30 - Aug1
In this video, we will analyze the following FX market:
USD Index
In my last USD video, the forecast was for higher prices. Check the related links below to see that video forecast. It played out exactly as analyzed. The +FVG was used to push for higher prices. The FOMC decision to keep the rate unchanged only pushed it further along.
Enjoy!
May profits be upon you.
Leave any questions or comments in the comment section.
I appreciate any feedback from my viewers!
Like and/or subscribe if you want more accurate analysis.
Thank you so much!
Disclaimer:
I do not provide personal investment advice and I am not a qualified licensed investment advisor.
All information found here, including any ideas, opinions, views, predictions, forecasts, commentaries, suggestions, expressed or implied herein, are for informational, entertainment or educational purposes only and should not be construed as personal investment advice. While the information provided is believed to be accurate, it may include errors or inaccuracies.
I will not and cannot be held liable for any actions you take as a result of anything you read here.
Conduct your own due diligence, or consult a licensed financial advisor or broker before making any and all investment decisions. Any investments, trades, speculations, or decisions made on the basis of any information found on this channel, expressed or implied herein, are committed at your own risk, financial or otherwise.

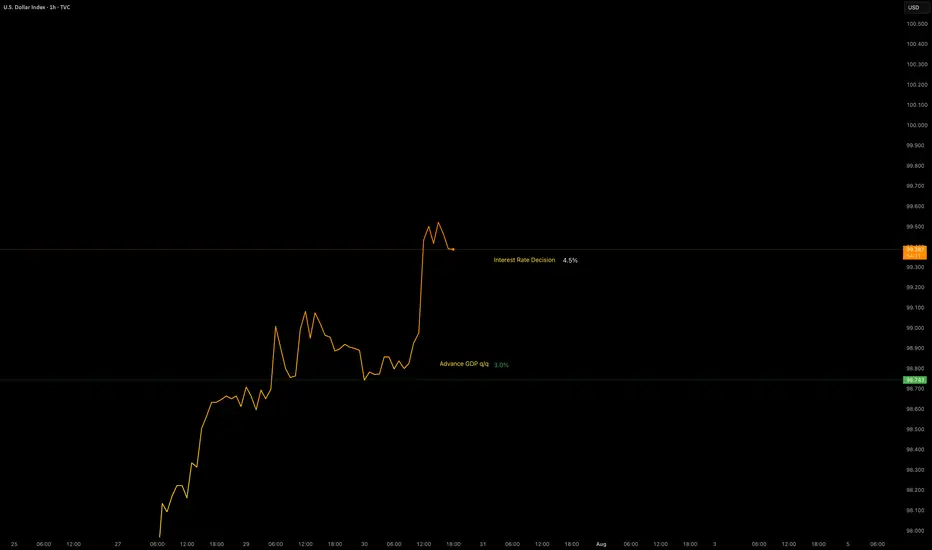
Data Release - Interest Rate DecisionJul 30 2025: Interest Rate Decision (4.5%)
Rates remain unchanged as expected.
OANDA:XAUUSD remains bearish with the help of GDP data.
TVC:DXY remains bullish with the help of GDP data. No major changes in either pairs.
Volatility is increased.
Will DXY Get Supported With Fresh US-EU Trade Agreement?Macro approach:
- The US dollar index has traded mixed since last week, pressured by lingering trade uncertainty and cautious market sentiment ahead of major economic events.
- Dovish Fed expectations and subdued US inflation continued to weigh on the greenback, while news of a fresh US-EU trade agreement and upcoming talks with China contributed to two-way price action.
- Economic data reflected a resilient labor market but flagged moderating US growth, with investors closely watching forthcoming GDP figures and the Fed's policy stance.
- The US dollar index may remain range-bound as markets await catalysts, including the Fed meeting, the 2Q GDP release, and key labor market data.
Technical approach:
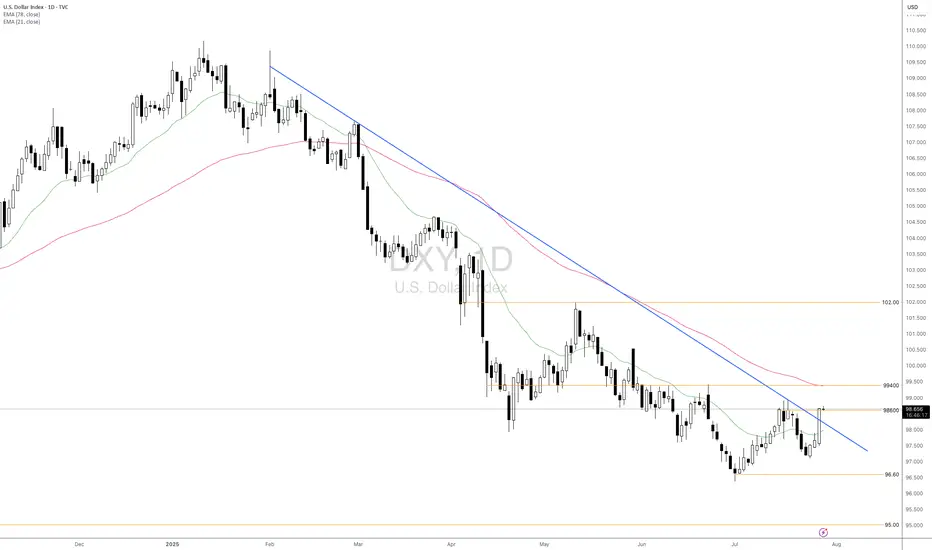
- DXY surged and closed above the descending trendline and the resistance at around 98600, indicating an early signal of a shift in the market trend.
- If DXY maintains above 98600, it may retest the following resistance at 99400, confluence with EMA78.
- On the contrary, closing below the descending trendline and EMA21 may prompt a retest of the swing low at 96.60.
Analysis by: Dat Tong, Senior Financial Markets Strategist at Exness
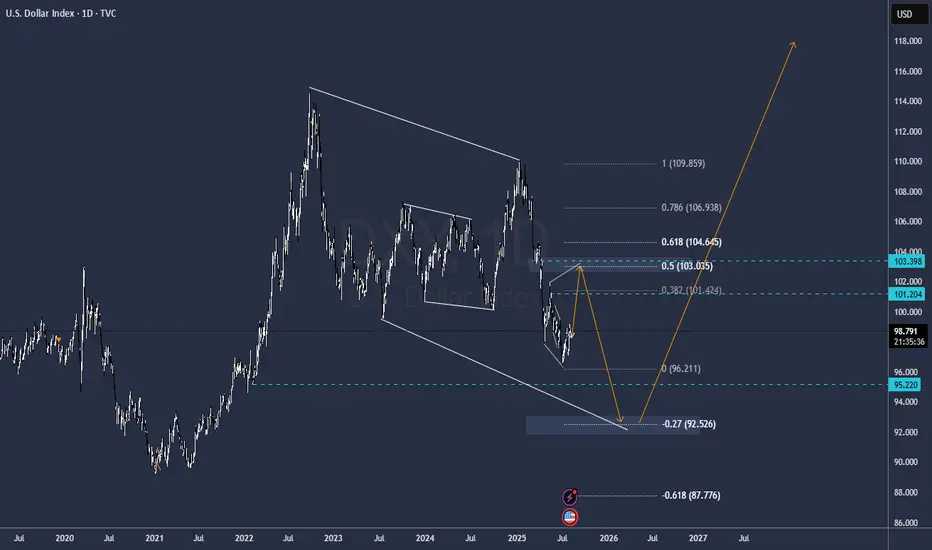
DXY with interest rates With interest rates remaining steady, the U.S. Dollar is currently moving in a bullish direction.
As shown in the chart, it seems likely that price will break the previous high and form a bullish Quasimodo (QM) pattern. The price may then reach the 50% Fibonacci level.
After that, we should wait and observe the market's reaction.
If price gets rejected from the 103 zone — especially if accompanied by a rate cut or bearish price action — we could see a sharp decline toward the 95 area.
This 95 zone also aligns with a key weekly Fibonacci support level on the Dollar Index.
As long as the Federal Reserve maintains its hawkish stance, the U.S. Dollar may continue its upward momentum. However, the 103–104 zone — which aligns with the 50% Fibonacci retracement and a significant supply area — could serve as a strong resistance.
If price gets rejected from this area and we simultaneously see signs of a rate cut or weakening U.S. economic data, a trend reversal and corrective phase could begin. In that case, lower targets around 95 or even 93 could become likely in the medium term.
good luck

Data Release - Advance GDP q/q (3.0%)Jul 30 2025: ADVANCE GDP q/q (3.0%)
OANDA:XAUUSD sees some downside pressure with positive GDP data.
TVC:DXY gaining strength.
Volatility is increased. This data will be used with Interest Rate Decision later in the day to provide a XAUUSD insight.
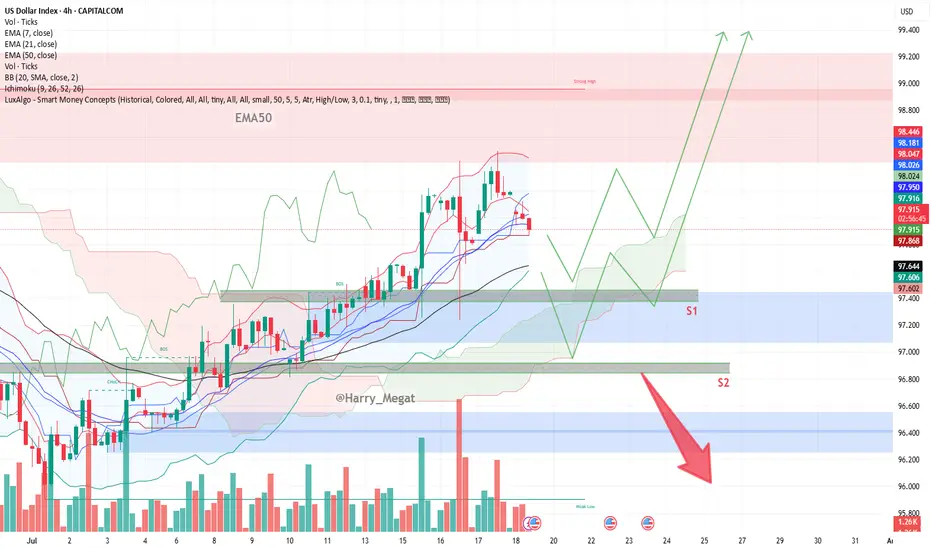
DXY Chart Outlook: Trend, Support, and Price Objectives**DXY Chart Outlook: Trend, Support, and Price Objectives (Reworded Analysis)**
**Trend Overview**
* The DXY chart reflects a **clear upward trajectory**, characterized by a sequence of **ascending highs and higher lows** — a classic sign of bullish momentum.
* Currently, the price is **retracing toward the 50-day EMA**, which appears to be holding as **dynamic support**.
* Two important **horizontal support zones** are marked:
* **Support 1 (S1):** \~97.400 (aligned with EMA-50)
* **Support 2 (S2):** \~96.800 (a deeper correction level)
**Projected Price Zones**
* **Near-Term Objective:** **98.800 to 99.000**
* A rebound from the EMA or S1 could send price higher toward this zone, continuing the current bullish structure.
* **Mid-Term Target:** **99.200 to 99.400**
* If the price successfully clears the 99.000 resistance, further bullish continuation could aim for this intermediate target range.
* **Extended Target:** **100.000+**
* A sustained breakout beyond 99.400 could open the path toward **psychological resistance at 100.000**, possibly higher on strong momentum.
**Support Zones to Watch**
* **S1 (97.400):** This level coincides with the 50-day EMA and represents a **first line of defense**.
* **S2 (96.800):** Should the price fall below S1, this secondary level could provide **stronger support** and potential bounce opportunity.
**Risk Management**
* Consider placing a **protective stop** just below S2 — around **96.500** — to safeguard against a potential trend reversal or deeper correction.
**Summary**
* The DXY remains **technically bullish**, with potential upside targets at **98.800**, **99.400**, and eventually **100.000+**.
* Traders can monitor **S1 and S2** for potential entries or trend confirmation.
* A **breakdown below 96.500** would invalidate the bullish setup and warrant caution.
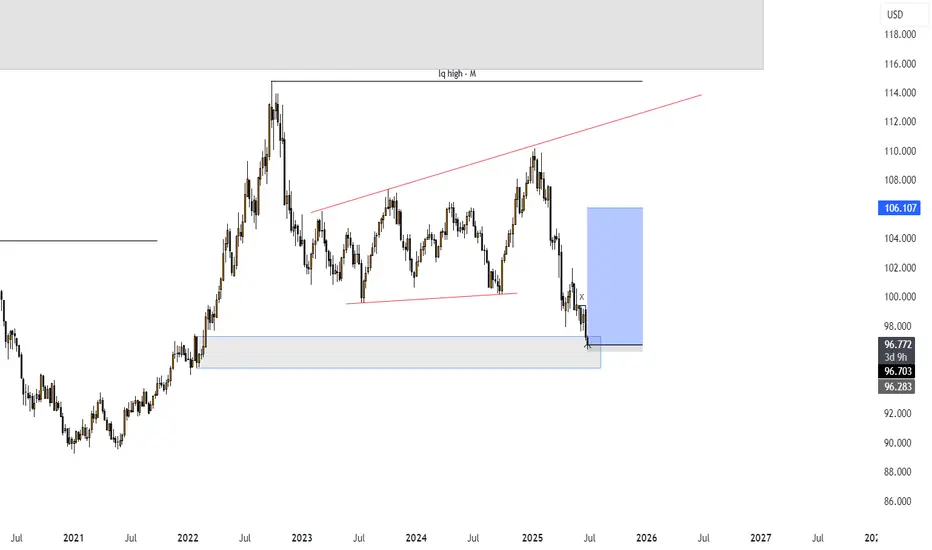
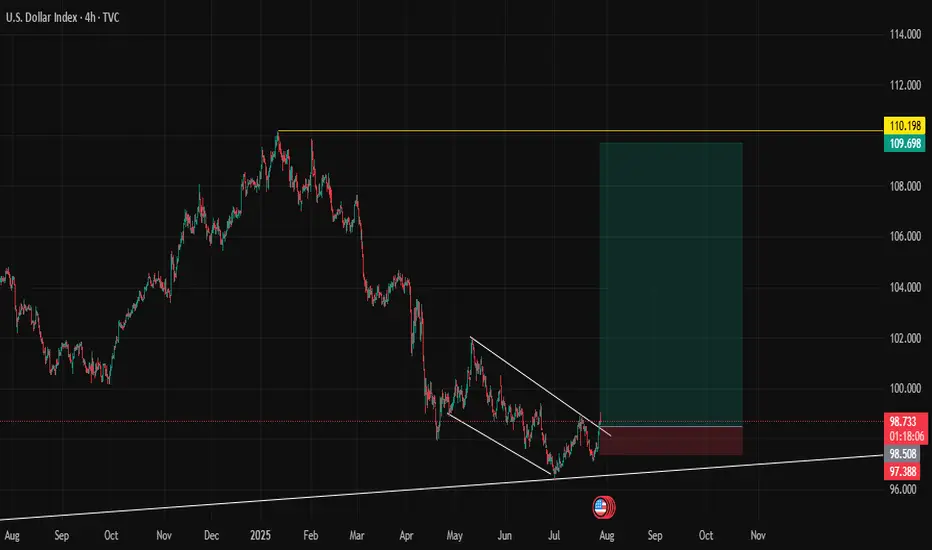
Dollar Index (DXY): Possible Reversal | Inverse Head & ShouldersThe dollar has had a tough year, but that might be changing.
I’ve spotted a well-known reversal pattern: an Inverse Head & Shoulders.
This pattern features three dips, with the middle one—the "head"—being the deepest.
Now, the price has rebounded from the Right Shoulder and is heading higher.
It’s approaching the Neckline at $98.7, which needs to be broken for a bullish confirmation.
If that happens, the projected target is around $101.6, based on the depth of the pattern.
This lines up closely with the previous high of $102 from May. The target area is highlighted in the blue box.
However, if the price falls below the Right Shoulder’s low at $97.1, the pattern would be invalidated.
Anyone else see this pattern?
Could this be the bottom for the dollar?

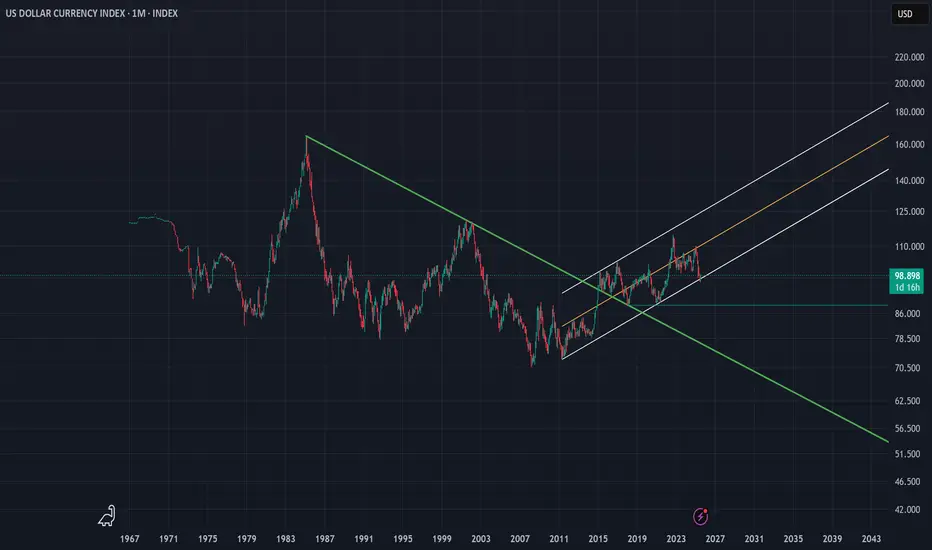
DXY | Timeframe: 1MWith the breakout of the downtrend line drawn since 1985 and its breach in late 2014, the DXY index officially entered a relatively stable upward trend and is currently oscillating within a parallel channel. Although, on the monthly timeframe, it has recently touched the lower boundary of the channel, we can expect at least a rise toward the channel’s midline. However, if the lower support of the channel is broken, a static support around the approximate rate of 88 can be considered a notable support level. Should this support also fail, the long-term downtrend dating back to 1985 would be regarded as the most important support for the DXY index. Meanwhile, moving averages such as the MA50, MA100, and other longer-period moving averages serve as dynamic supports along the way.
It is also worth mentioning that currently reaching the 120 level is considered an ideal target for the DXY index, and ultimately, it is by breaking this resistance zone that the index can reach its “Utopia”.
---------
I will try to continuously update this analysis of the TOTAL symbol according to market changes and developments. Also, I welcome reading your critiques and comments, so don’t forget to leave a comment!
DXY Surge Pressures Currency Market in Volatile Market WeekThe US Dollar Index (DXY) has held its rebound off historical support zones on both the price chart and the RSI indicator throughout July. The monthly RSI is bouncing off a support line extending between the troughs of 2008 and 2020. Meanwhile, price action is rebounding from a support trendline that connects the lows of 2008, 2014, and 2021, within the 96–94 zone.
Bearish Scenario: A solid close below this support zone may confirm a long-term bearish signal, potentially pushing the index toward the 94 and 90 levels.
Bullish Scenario: A confident move above 100 and 103 could signal a reversal in the currency market, potentially leading the DXY back toward the mid-range of the long-standing channel between 105 and 107, originating from the 2008 lows.
Written by Razan Hilal, CMT

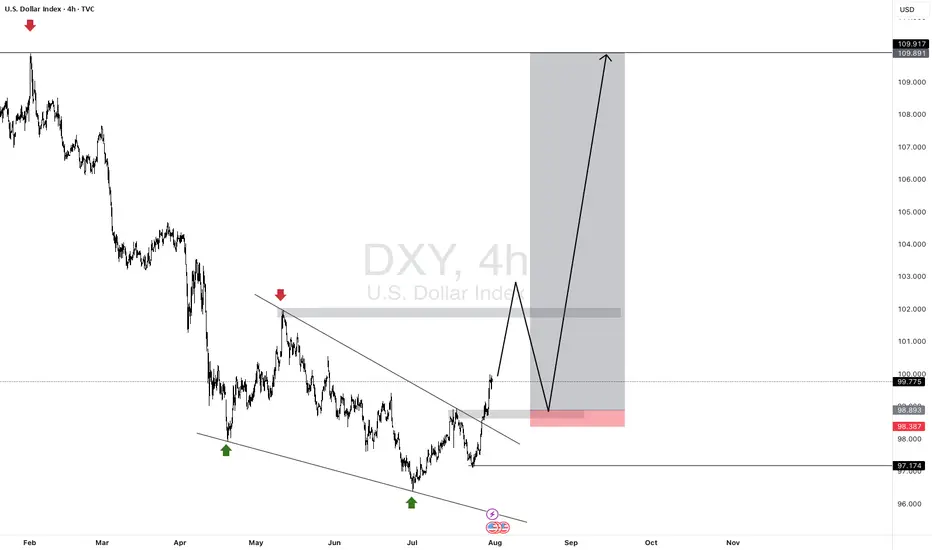
DXY dayly structureMay change indeed
but its pretty much what meassures and current development is showing
GG
FX Matrix: Dollar Index, GBP/USD & EUR/USDDollar Index : 99.394, 100.425 - 100.690
Euro: 1.14855 - 1.14477
GBP: 1.31643 - 1.31453

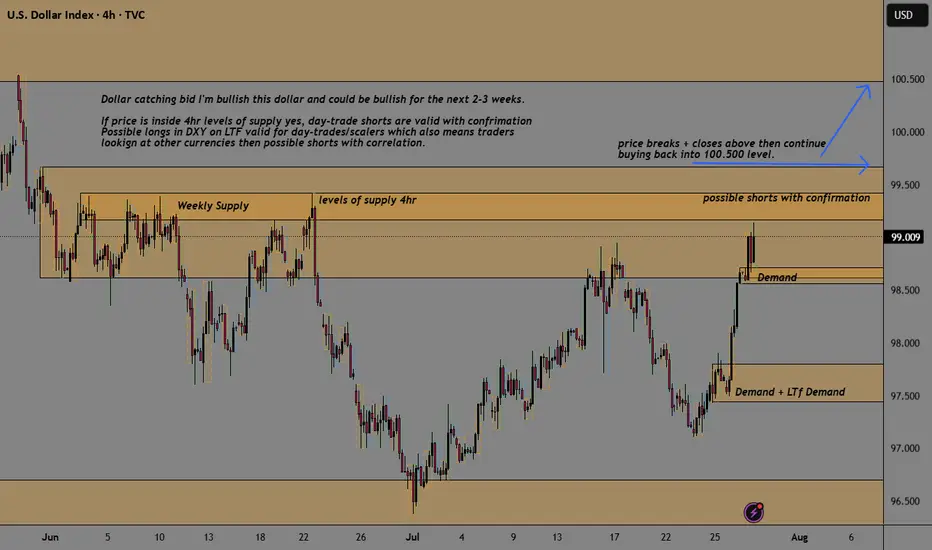
DXY Buyers Catching BidSee chart for analysis but even with price sitting inside levels of supply, we could easily see stronger Fundamentals coming out to drive this dollar back up into 100.5 areas of monthly supply. Short-term I remain bullish with long term views to the downside.
IS A HIGHER LOW SECURED ON THE DXY? LET'S FIND OUTIn this weekend analysis, I am still paying attention to the higher time frame downtrend on the dollar index while acknowledging the higher low support on the daily chart forming an inverse Head and Shoulders pattern. On the 4H and lower timeframes we have a strong ceiling made up of the 200SMA and 50SMA resistance level and need to break through from the 20SMA Line in the sand support. This weeks trade plan and thesis is for price to hold above the 20 SMA on the 4H timeframe expecting a potential dip to the zone of 97.128 (liquidity zone) and then bounce up to a weekly target of 97.7. This Thesis is INVALIDATED if a candle opens and closes below 97.015. I wish everyone a great trading week. Thank for supporting my publications and trade ideas. Cheers!!!
