USD Rallies into a Major Week - Fed, PCE, NFP on the WayReversals of long-term moves can be tough to work with, especially for shorter-term traders.
While fundamentals are important for shaping future price moves and technicals are key for explaining past moves, while also allowing for strategy and risk management, it's sentiment and positioning that probably matter more.
Because if any and everyone in the world that wants to be long already is, well it doesn't matter how positive the news is if there's simply nobody left to buy. And if there's no influx of fresh demand, and only incoming supply, well, then price can drop, even on good news. And at that point, a heavy one-sided market will take notice of falling prices even in the face of good news, when price should be going up, and they'll be disconcerted to hold long positions, which can lead to even more supply, more selling, and in-turn, lower prices.
As the old saying goes, if a market doesn't rally on good news, well then look out below.
This shows in various ways on varying time frames in numerous markets but from a longer-term perspective, that shifting trend is akin to turning a cruise ship in the middle of the ocean - it's not going to happen suddenly. It takes time, it takes shifting, and it takes the slow grind of late-to-the-trend bulls turning into ahead-of-the-curve sellers.
This is what allows for the build of wedges, just as I had looked at earlier in the month in both USD and EUR/USD. Bulls suddenly get shy as prices approaches highs, although they remain aggressive on pullbacks and tests of support. This leads to a weaker trendline atop the move and, eventually, unless buyers get motivated to punch up to higher-highs with a new breakout, that motive for profit taking can soon take over.
In the USD, the sell-off in the first half of this year was a grinding matter, and the polar opposite of the trend that had held in DXY as we came into 2025. But, now the question is whether resilient US data leads to profit taking from bears and as we saw again last week, sellers have been showing lacking motivation at tests of lows or around support.
The big question for this week is whether we see that shift take-hold on a larger basis. We've seen sellers getting shy around lows, but are buyers ready to punch up to fresh highs in the USD? There's certainly ample potential for motivation as given the economic calendar with FOMC, Core PCE and NFP in the final three days of this week. - js
USDINDEX trade ideas

Dollar us dxyI think the US dollar will fall sharply, causing a sharp rise in gold. There will probably be a bigger fall than in 2008 in the global economy, especially in the US.

DXY at Its Most Critical Level of 2025 — Will the 100 Bank LevelThe Dollar Index (DXY), just like several other majors, is approaching a very important level. We’re now near the 100 mark, which is not only a psychological level — but also a key institutional (bank) level.
There’s also a gap zone left behind that price is about to fill. I believe the index will stay in a range over the next 1–2 days as it waits for critical data later this week — especially Wednesday’s announcements and Friday’s NFP report, which could set the tone for what’s next.
Based on current market sentiment, Trump’s remarks, Powell’s upcoming speech, and broader macro factors, I believe DXY has the potential to break above 100 and move toward 102–104, if that level is broken cleanly.
Let’s also not forget — price bounced from a monthly demand block near 96, and we’re seeing weak support across majors like EUR and Gold. That adds confluence for potential dollar strength.
📌 What do you think — is dollar strength just around the corner?
🔁 This analysis will be updated whenever necessary.
Disclaimer: This is not financial advice. Just my personal opinion.
DXYDXY needs some more correction, if the correction is completed before Feds decision then a drop can follow otherwise Feds will push it up and NFP will drop it again.
Disclosure: We are part of Trade Nation's Influencer program and receive a monthly fee for using their TradingView charts in our analysis.

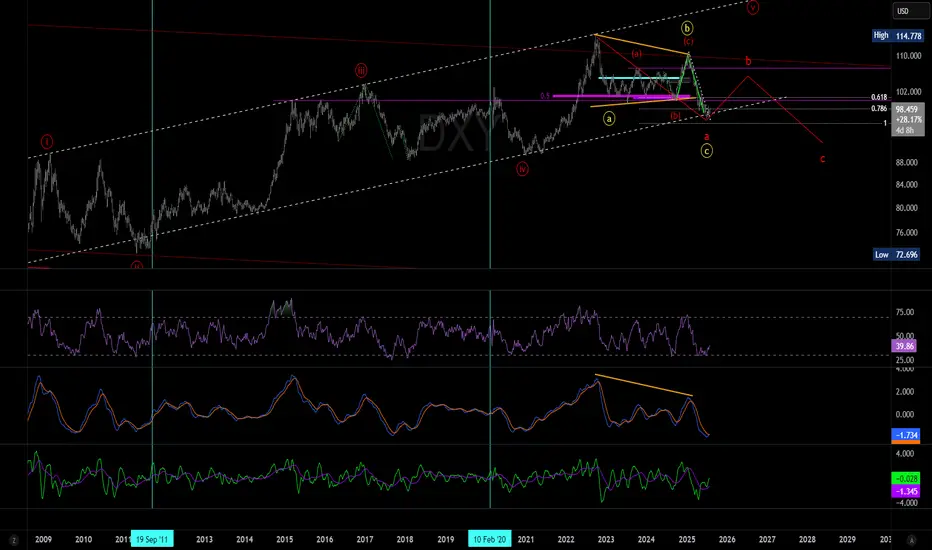
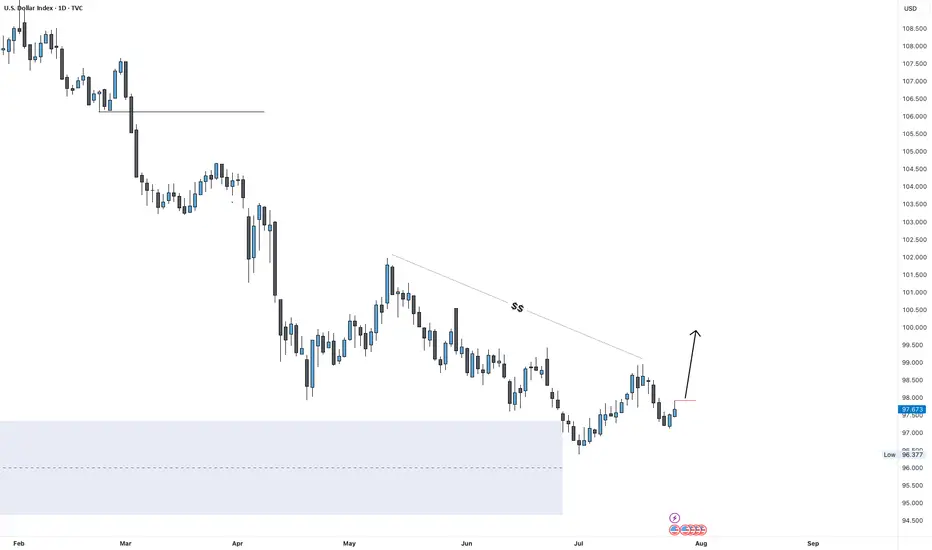
DXY bullishDXY is in the early stage of a bull market, so no one want dollars but in my view but the trend is your friend.
This could be a impulsive 5 of 5 or a B of ABC but both are bullish, another view is that the EURO have been a bad day when the US and EU reach tariff agreement??
The lagging indicators are changing or I hope, but this bullish trend for the Dollar could continue for weeks...
Analysis on the DXY – EURUSD RelationshipHello traders,
Here’s an analysis that can be useful for both short-term and swing trades on EURUSD and DXY. Our trading team’s calculations are as follows:
Analysis on the DXY – EURUSD Relationship
Currently, DXY is at 98.200. Historical statistical data indicate that if DXY declines toward 96.300, there is approximately a **1.55% probability of an upward move** in EURUSD.
Based on this scenario:
Current EURUSD level: 1.16500
Projected target level:1.1830
While the correlation data show a strong inverse relationship, it’s important to note that periodic deviations can occur in the market. Therefore, this analysis should be considered a statistical projection only, not a guaranteed outcome.

DXY - ABC Move still in playDXY has been moving not so much on technical factors lately but more so with what Mr. Trump says, we still could see a move lower with an ABC pattern.
Good Luck
DXY index moving towards down in higher timeframeAs you can see DXY index is moving inside channel and now its time for second swing failure to go down.Then channel movement will finish and it will breakout towards upward so i recomand trade USD pairs accordingly.This is my analysis not a financial advice so trade according your risk management.
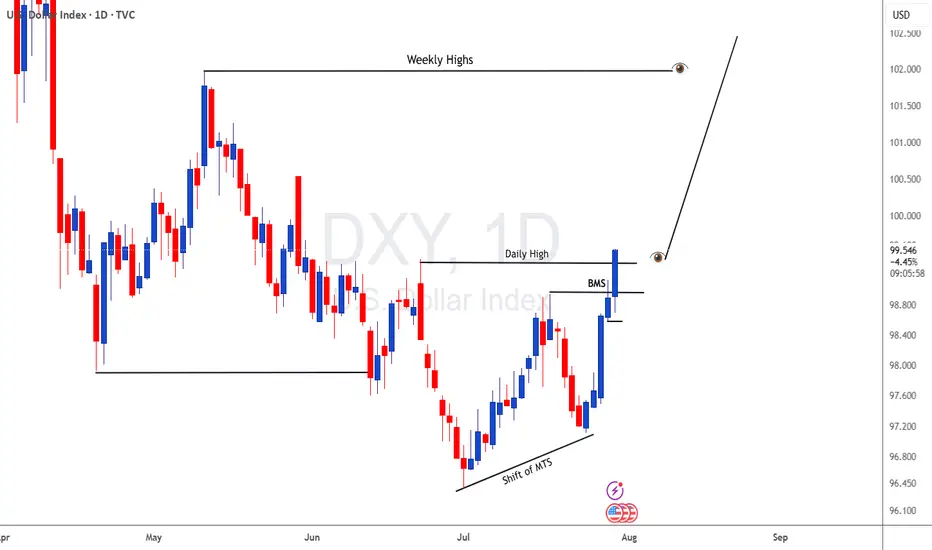
DXY Outlook: Can Fed Hold Spark a Move Toward 100?DXY Weekly Forecast – July Week 4
After reaching 96.50 early this month, DXY began showing bullish signs. Last week, price retested the extreme demand zone at 97.00 and closed with a bearish weekly candle that held some bullish pressure at the base.
This week, all eyes are on the Federal Reserve meeting. If the Fed holds rates steady, the dollar could strengthen further. A weekly close above 97.90 would confirm the breakout and open the door to a run toward 100.00 — a key psychological and technical level.
Bias: Bullish (if 97.90 breaks)
Key Zones:
• Demand: 97.00
• Breakout Level: 97.90
• Target: 100.00
This could be the beginning of a fresh bullish leg — especially if macro conditions align with technical structure.
—
Weekly forecast by Sphinx Trading
Let me know your bias in the comments.
#DXY #DollarIndex #ForexForecast #SphinxWeekly #SmartMoney #FOMC #USD #InterestRates
DXY forecast From weekly view the DXY is looking bearish at least till 95.123 key level the will see if we get a bullish power as the DXY is forming a reversal pattern. But of course many factors plays part in this economy, for example, global news like Tariffs and other factors.
So when DXY is trading on the 95.123 key level additional confluence will give us the right to put on trades, as the 95.123 key level is significant for what will take place next.
Take you all.......

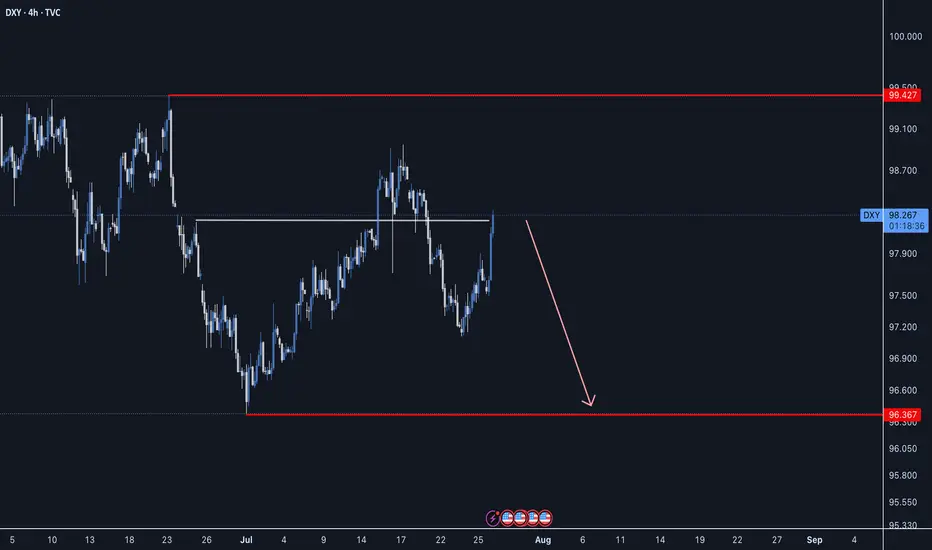
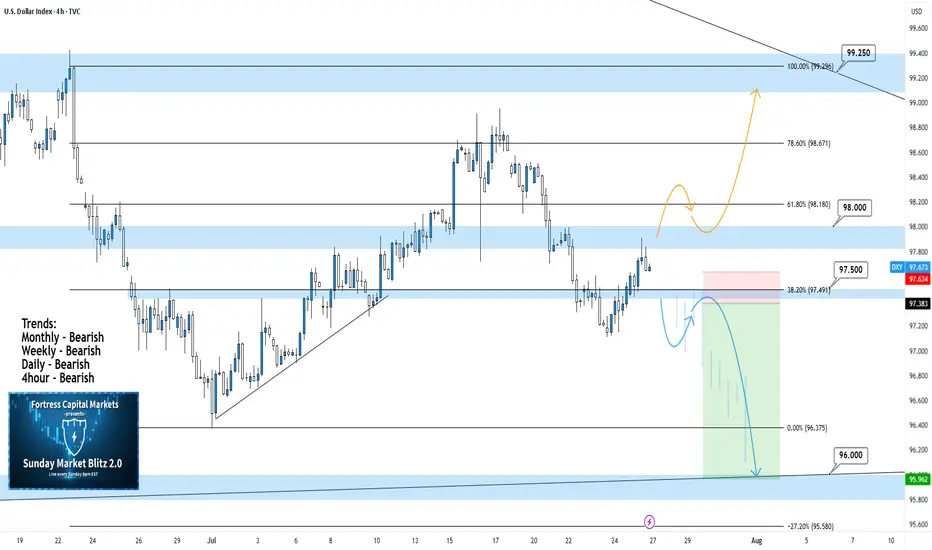
DXY 4Hour TF - July 27, 2025DXY 7/27/2025
DXY 4hour Bearish Idea
Monthly - Bearish
Weekly - Bearish
Dailly - Bearish
4hour - Bearish
**We analyze DXY as an indicator of USD strength on a week to week basis**
This week is looking like we can expect bearish momentum on USD but here are two scenarios breaking down the potential:
Bearish Continuation - USD pulled a strong bearish reversal all last week which pushed us below our major 98.000 support zone.
We are now testing that same 98.000 zone as resistance and are looking to see if it will hold. Ideally, we can confirm further bearish structure to gain confidence in a bearish USD for the week ahead.
Bullish Reversal- For us to consider DXY as bullish again we would need to see bullish structure above our 98.000 zone. This would include: A break back above 98.000 with an established HH and HL.
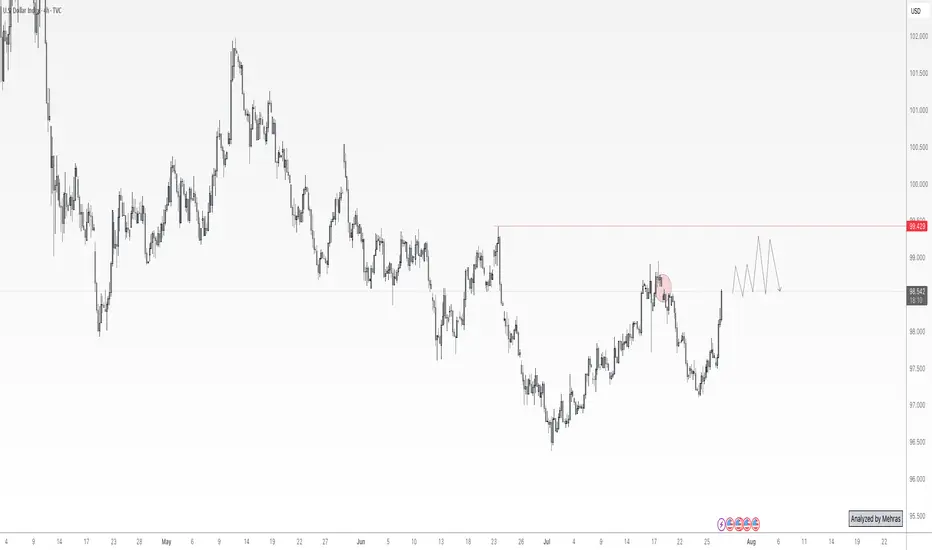
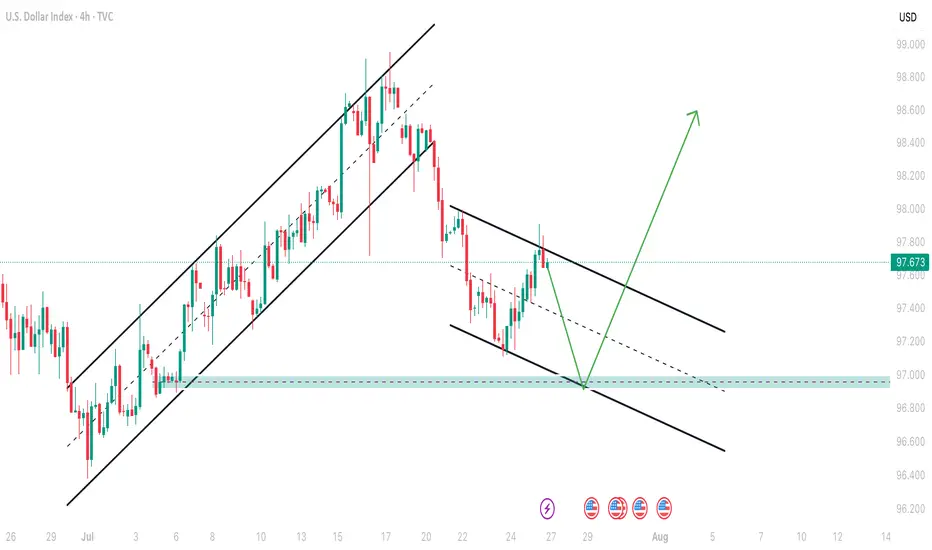
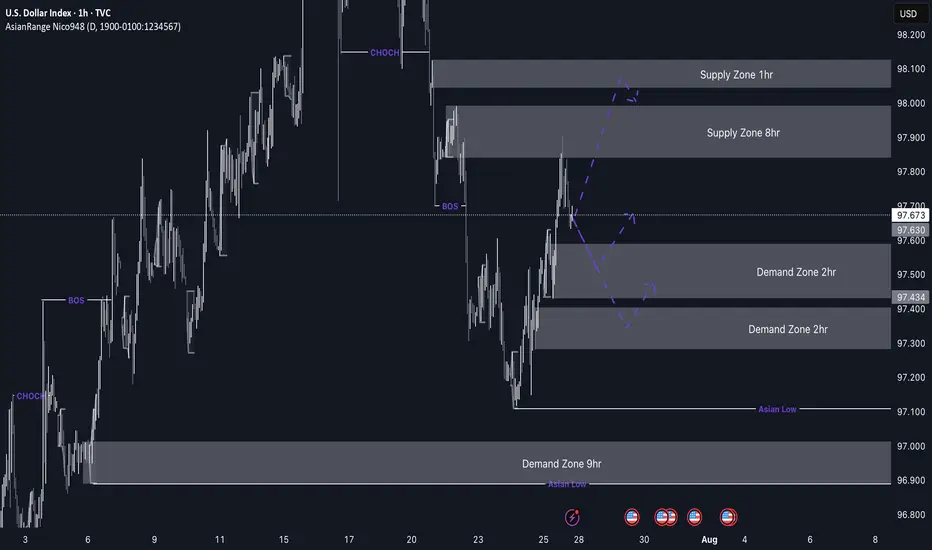
DXY weekly outlookDXY Weekly Outlook
This week, I’m watching to see if the dollar continues its bearish trend or breaks above the current supply zone. We've already seen a strong reaction from the 8hr supply, but price could still tap into the 1hr supply before making its next move.
If price drops from here, I’ll be looking at the 2hr demand zone below for a possible bullish reaction. If DXY pushes up from that zone, pairs like EU and GU could drop — which lines up with my overall short bias on those.
Gold may not always move in sync with the dollar, but DXY still gives a good idea of market sentiment.
Let’s see how it plays out and stay reactive.
DXYJULY 21-25 recap
Net was -296 last week
Price dropped until Wednesday
Hit the weekly demand zone (strong support)
Sellers paused or covered shorts there
Buyers stepped in → possible bounce or reversal

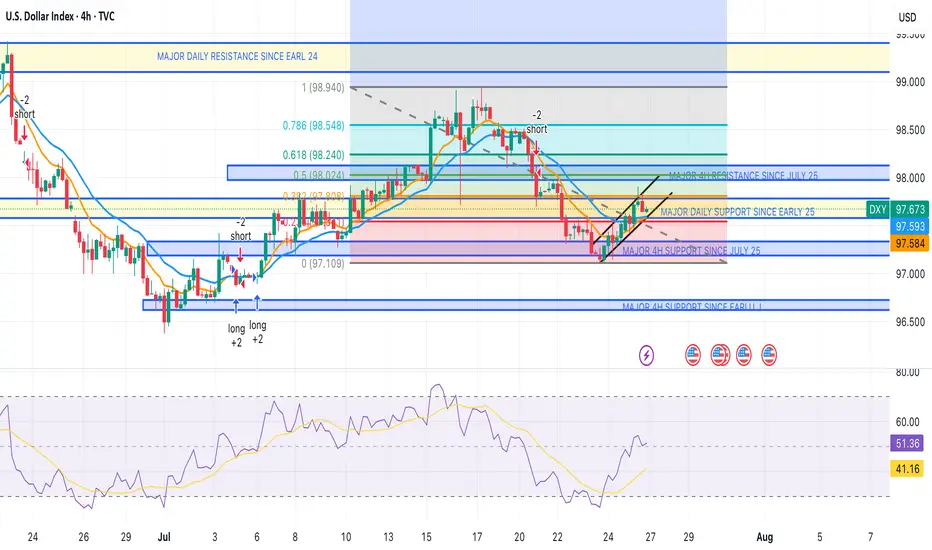
DXY HEADING INTO LAST WEEK OF JULY DXY ZONES
WEEKLY TF, TO DAILY, TO 4HR ANALYSIS.
The successful devaluation of the dollar by the administration since the election continues.
DXY dumped below key daily support at 97.600.
It was reclaimed but failed at key daily resistance dating back to 2024 — the same zone as the 0.382 Fibonacci level.
Failure to gain support at 97.580 (0.23 Fib level) = a bearish signal for the dollar index (DXY), potentially sending it back down to the 97.100–97.200 range. If that breaks, look for a further continuation toward the 96.700–96.800 zone.
This is a big week for news, reports, and interest rate decisions for the U.S., EUR, and CAD, as we close out July.
Still bearish on DXY for now.
However, if the dollar can break through the 97.950–98.000 range and catch support — then push past the 98.135–98.200 zone (0.618 Fib level) — I’ll be looking for a long entry on DXY up to the 98.900–99.400 zone for the next test.
Again, I remain bearish for now, but depending on the data and what the Fed does with U.S. rates, we could see a strong DXY this week. Until we pass those zones, I’m staying bearish.
New to trading (6 months in) — before you leave any hate comments:
I’m here to learn and would genuinely appreciate any advice or help in becoming better and more thorough.
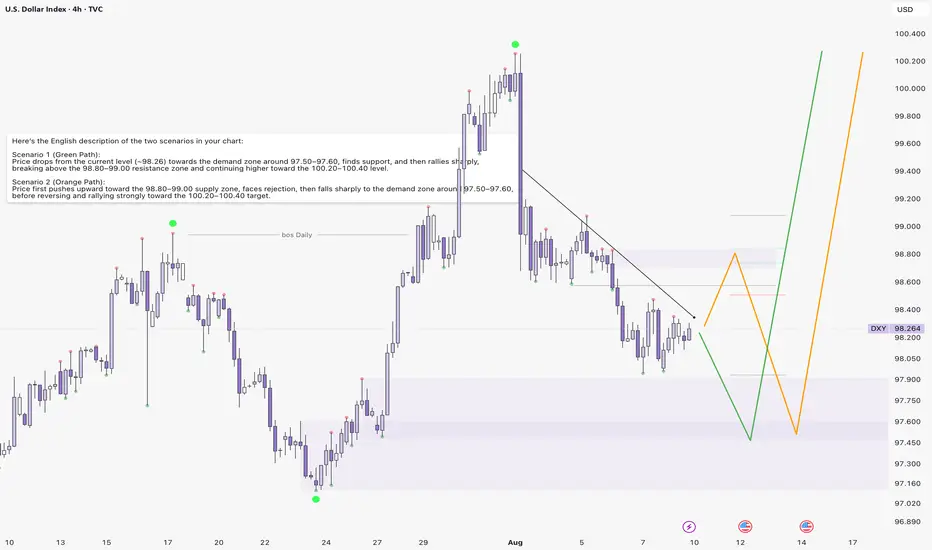
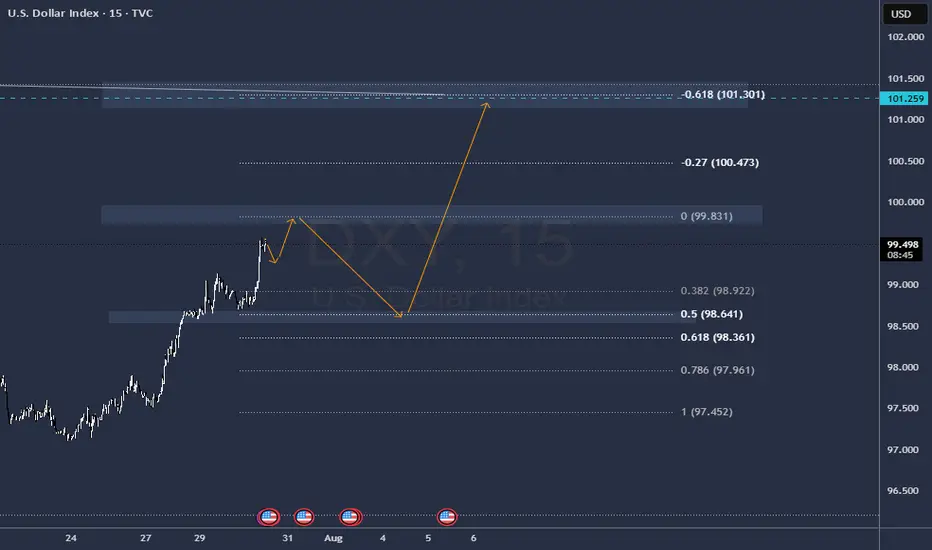
DXYHere’s the English description of the two scenarios in your chart:
Scenario 1 (Green Path):
Price drops from the current level (~98.26) towards the demand zone around 97.50–97.60, finds support, and then rallies sharply, breaking above the 98.80–99.00 resistance zone and continuing higher toward the 100.20–100.40 level.
Scenario 2 (Orange Path):
Price first pushes upward toward the 98.80–99.00 supply zone, faces rejection, then falls sharply to the demand zone around 97.50–97.60, before reversing and rallying strongly toward the 100.20–100.40 target.
DXYThe U.S. Dollar Index is showing weakness after rejecting a key supply zone. Price has broken below recent support, signaling potential downside continuation. If sellers maintain control, we could see further declines toward the next demand zone.
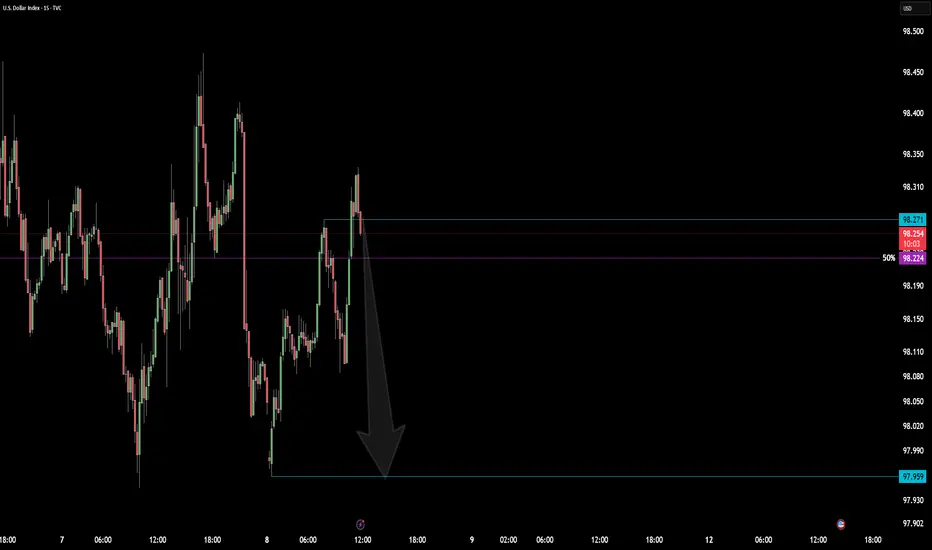
A calm day for DXYGiven the market's lack of momentum and the overall downtrend in the higher timeframe cycle, it is unlikely that anything significant will happen with DXY today. At most, we might see a decline down to the 97.937 level.
Decision Zone for DXY This Week: Around 97.600After a significant downward expansion in DXY, we observed a consolidation around last week's low. This week, the market opened with a pullback.
The first stop for this pullback appears to be the current daily fractal high candle and the weekly bearish FVG on the chart. We can assess potential selling pressure from this area on lower timeframes. We'll be monitoring the wicks within this zone, along with any newly forming FVGs.
If the price breaks above this area, our next points of interest will be the gaps within the zone above the 0.5 swing level, and ultimately the swing high itself as the final target.
Given the current setup, we believe there are promising trading opportunities on EURUSD.
Take care until the next update!

Just a bounce off or a real trend reversal?DXY sits on a major support zone. Price often delivers a reflex bounce at strong levels before continuing the prevailing trend, so a quick pop isn’t proof of a new bull run. DXY is closely linked to US real yields (10y TIPS): if real yields roll over as the Fed eases, USD strength likely fades; if real yields stay firm, a durable reversal is more plausible.
This post is for informational/educational purposes only and is not investment advice or a solicitation to buy/sell any security. Past performance is not indicative of future results. I may hold positions related to the instruments mentioned.

DXY UPDATE FOR LONG as we forecast a long term this an update
The dollar index (DXY00) on Tuesday rose by +0.22% and posted a 5-week high. The dollar has carryover support from Monday following the EU-US trade deal that is seen as favoring the US. Also, expectations for the Fed to keep interest rates unchanged at the end of Wednesday's 2-day FOMC meeting are supportive of the dollar. The dollar extended its gains after the US Jun advance goods trade deficit unexpectedly shrank, a supportive factor for Q2 GDP, and after July consumer confidence rose more than expected.
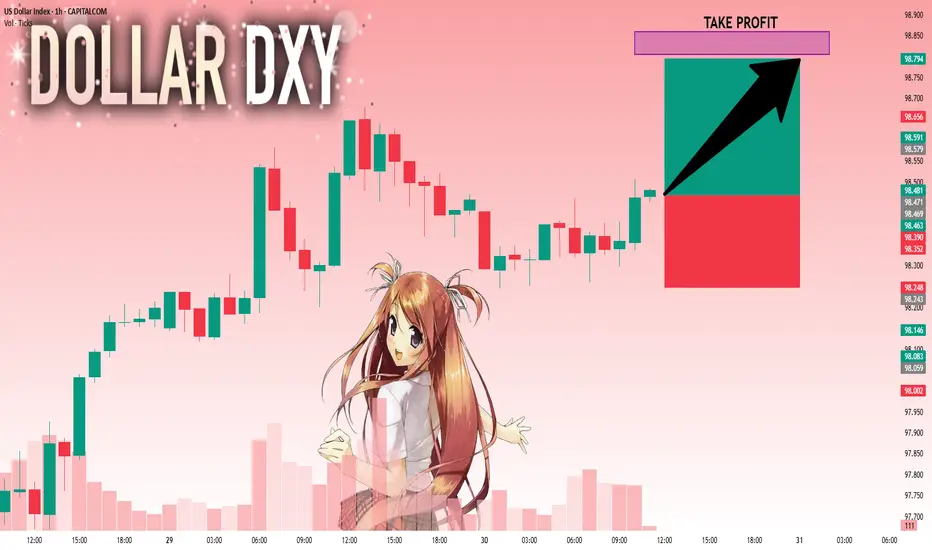
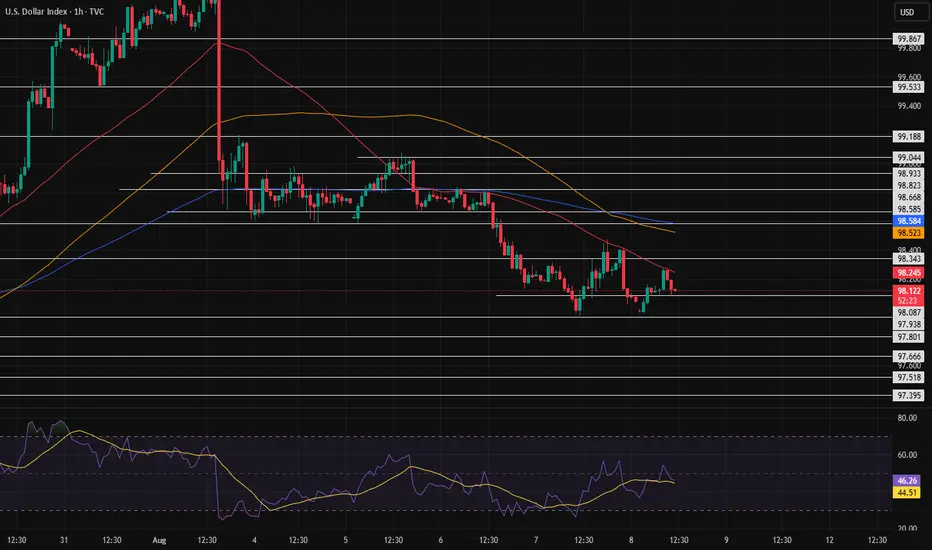
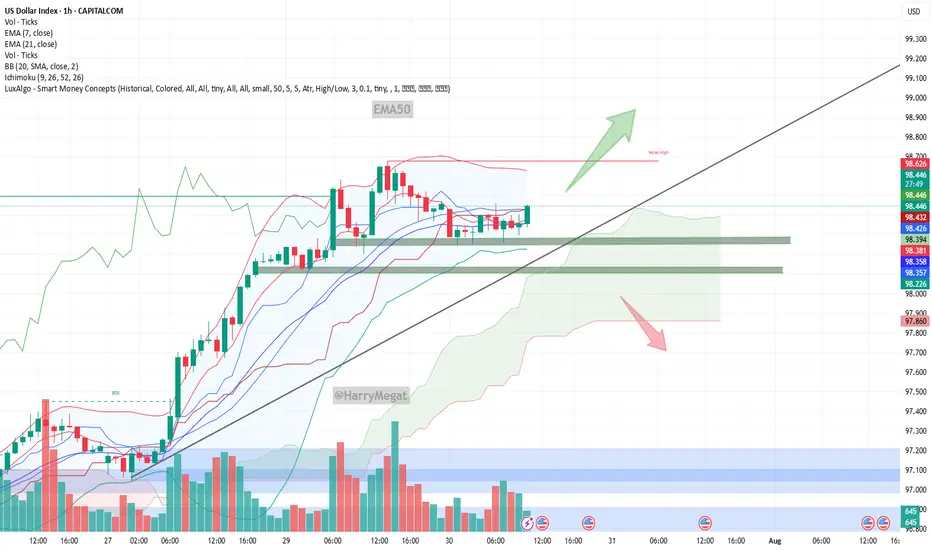
US Dollar Index (DXY) Chart Analysis – 1H TimeframeUS Dollar Index (DXY) Chart Analysis – 1H Timeframe
This chart shows the **US Dollar Index (DXY)** with key price zones, trendlines, and EMA indicators. Here's a detailed analysis:
**Key Observations:**
* **Price:** Currently trading near **98.41**
* **EMAs:**
* **EMA 7** = 98.373 (short-term trend)
* **EMA 21** = 98.356 (medium-term trend)
* **Trendline:** Uptrend line still intact, acting as dynamic support
* **Volume:** Steady, no strong breakout yet
* **Support Zones:** 98.20 – 98.35
* **Price Structure:** Consolidating above support and EMAs after a pullback from highs
**Bullish Scenario**
* If price **holds above EMAs and the green support zone (98.20–98.35)**
* **Breakout above 98.50** would confirm strength
* Targets:
→ **98.70**
→ **99.00+** if trendline support continues to hold
* EMAs are aligned bullishly (7 above 21) – good sign for continued upward trend
**Bearish Scenario**
* If price **breaks below 98.20 and closes under the trendline**
* Watch for rejection near 98.50 followed by strong red candle
* Downside targets:
→ **97.80**
→ **97.60**
* A breakdown below the ascending trendline = trend shift confirmation
**Conclusion**
* **Bias:** Bullish as long as DXY stays above 98.20 and trendline
* **Invalidation:** A break and close below 98.20 + trendline = bearish shift
DXY: Bulls Are Winning! Long!
My dear friends,
Today we will analyse DXY together☺️
The in-trend continuation seems likely as the current long-term trend appears to be strong, and price is holding above a key level of 98.471 So a bullish continuation seems plausible, targeting the next high. We should enter on confirmation, and place a stop-loss beyond the recent swing level.
❤️Sending you lots of Love and Hugs❤️