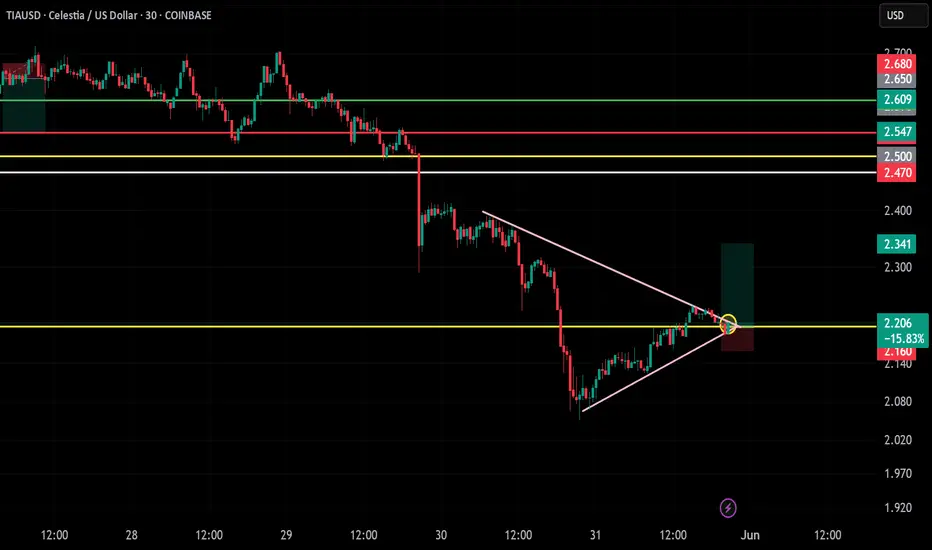
TIAUSD Long Setup – Wedge Breakout Alert!Chart Timeframe: 30-Minute
Trade Type: Long (Buy)
Pattern: Falling wedge breakout ✅
Entry Point: Around $2.207 (breakout candle)
Stop Loss: Around $2.160 (below wedge support)
Target 1: $2.341 (first resistance)
Reward: ~6%
Risk: ~15.8%
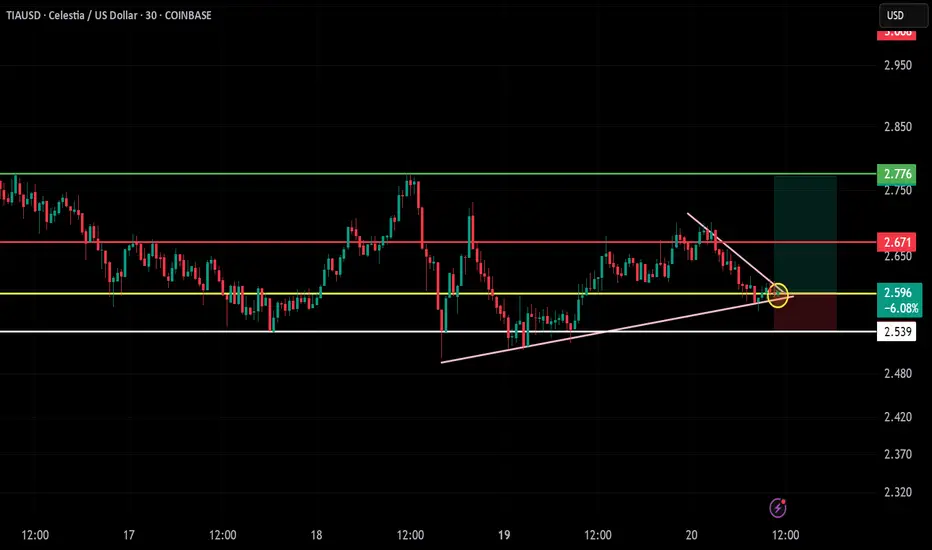
Trade Setup Summary – TIAUSD (Celestia / USD)!
📈
Chart: 30m timeframe
🔺 Pattern: Breakout from Downtrend Line + Ascending Triangle Support
Current price action suggests a breakout above minor descending resistance while maintaining higher lows – bullish structure.
📍 Entry Zone: Around $2.597
Breakout confirmation near triangle apex and horiz
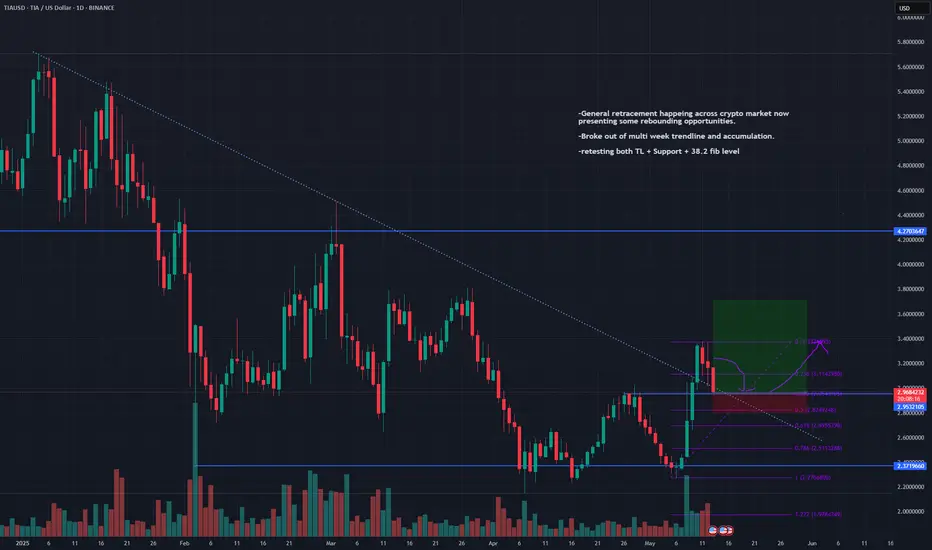
TIAUSDT - LONG-General retracement happeing across crypto market now presenting some rebounding opportunities.
-Broke out of multi week trendline and accumulation.
-retesting both TL + Support + 38.2 fib level
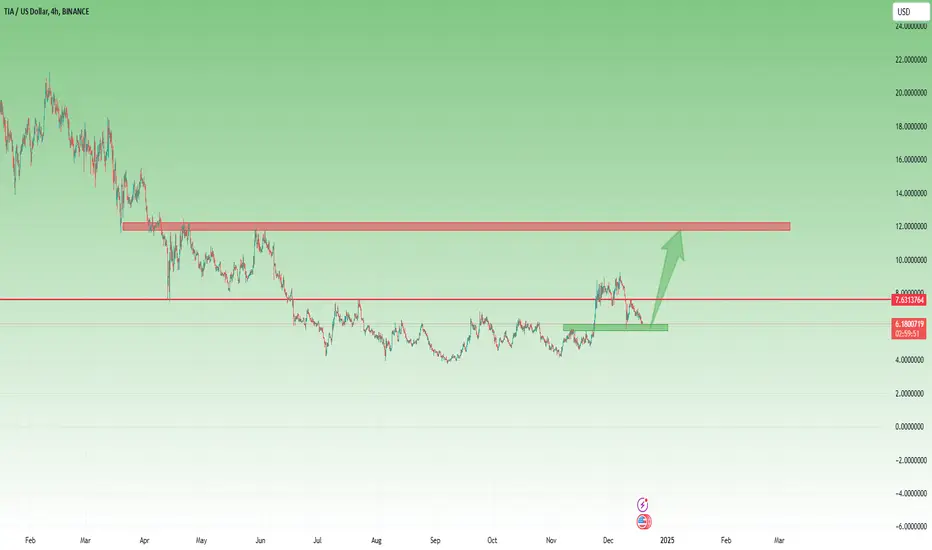
TIA ready for breakout?!Look at this chart. It seems TIA is ready to break the descending line of resistance..
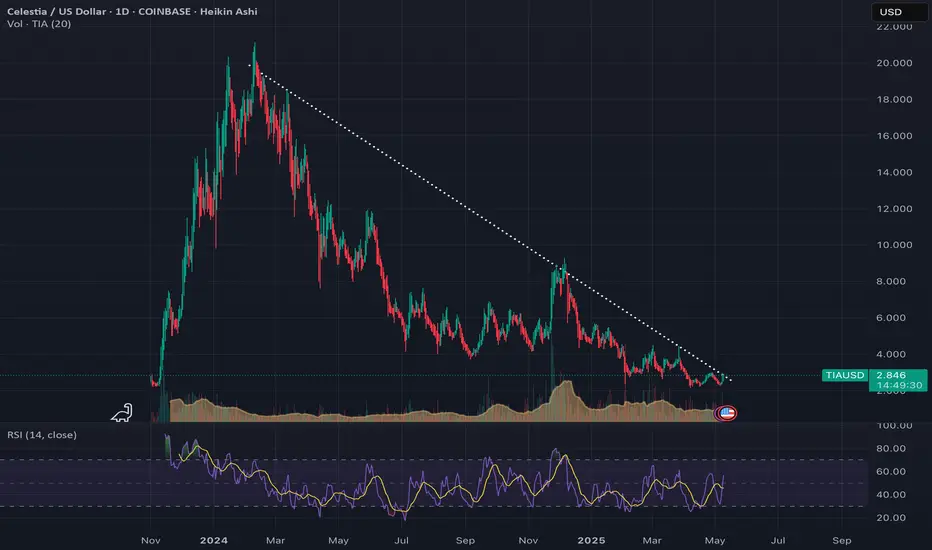
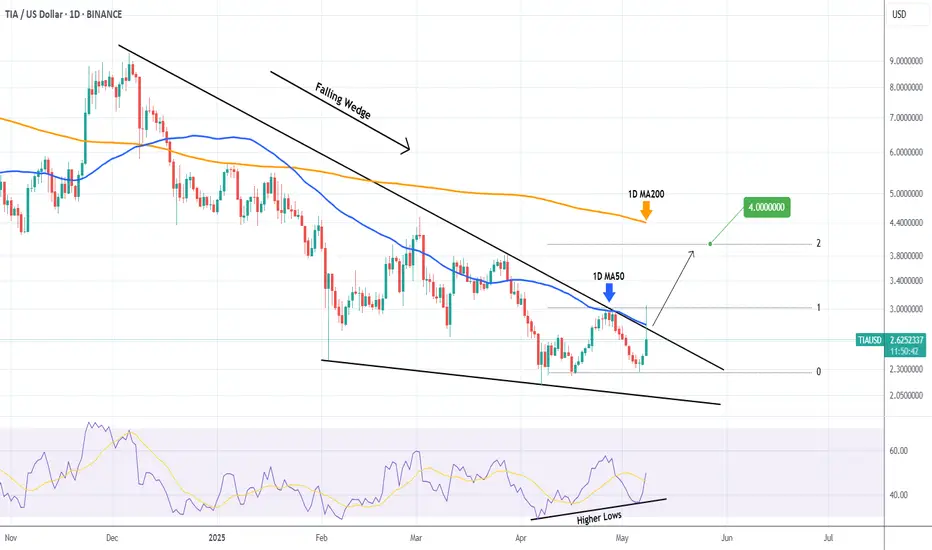
TIAUSD just broke above the 5-month Falling Wedge!Celestia (TIAUSD) made a major bullish break-out today as not only did it break above its 1D MA50 (blue trend-line) but also above the 5-month Lower Highs trend-line (December 06 2024), which is the top of the Falling Wedge pattern!
With the 1D RSI also on Higher Lows, this bullish momentum is targ
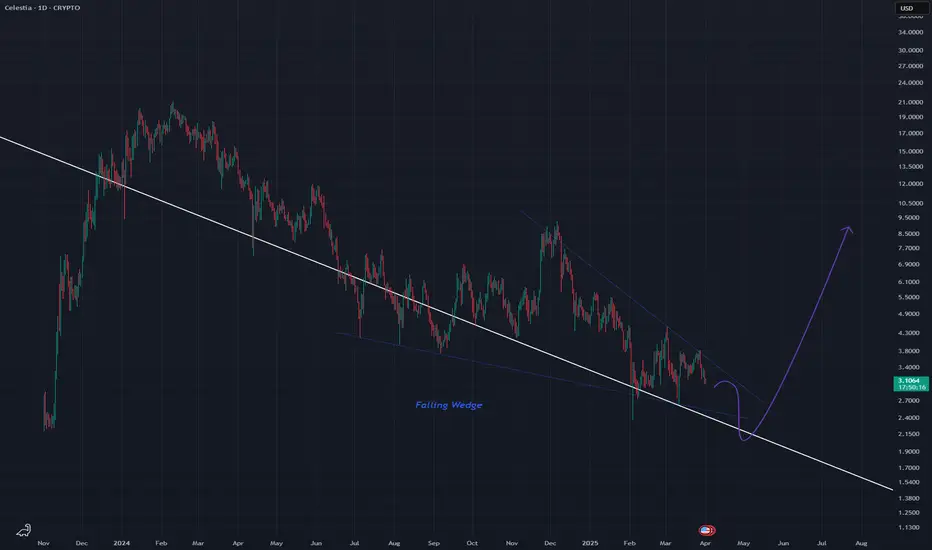
TIA2USD - Falling Wedge on Down Trend Falling Wedge in blue along the down trend in white
Falling wedges break out bullishly
This bullish break out will be the first real bull run for this coin
Not sure how high it could go, should go beyond previous ATH though
Daily timeframe
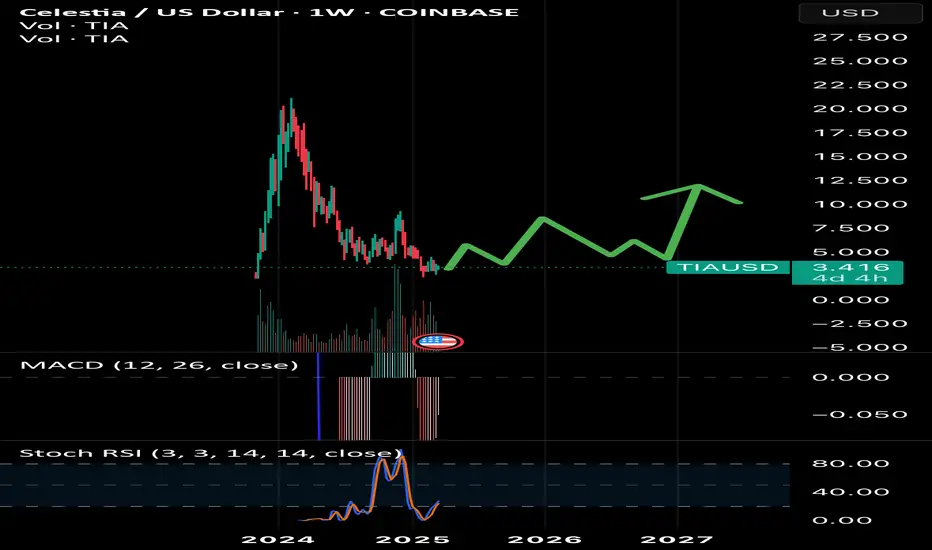
LONG it’s gonna be a bumpy ride!Price has finally hit all time lows and consolidating nicely. Demand has been met and we’re ready to bounce! Pack your bags 🚀 🧨 🚀
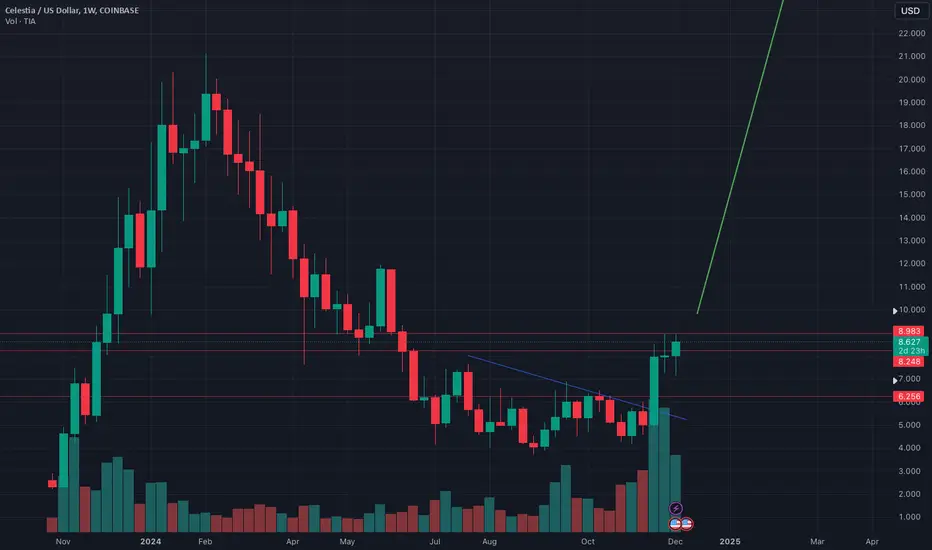
GOOOOO!TIA - Looks set up for an explosive rally.
Should tell a lot after breaking through the immediate resistance zone.
Tia’s Next Move: Opportunity Below $6?Tia/USDT has been lagging recently, and while other altcoins surged strongly after Trump’s election, Tia only recently managed to break above a key resistance level at $6.
After reaching the recent high, the price corrected and is now back at the previous resistance level, which has turned into sup
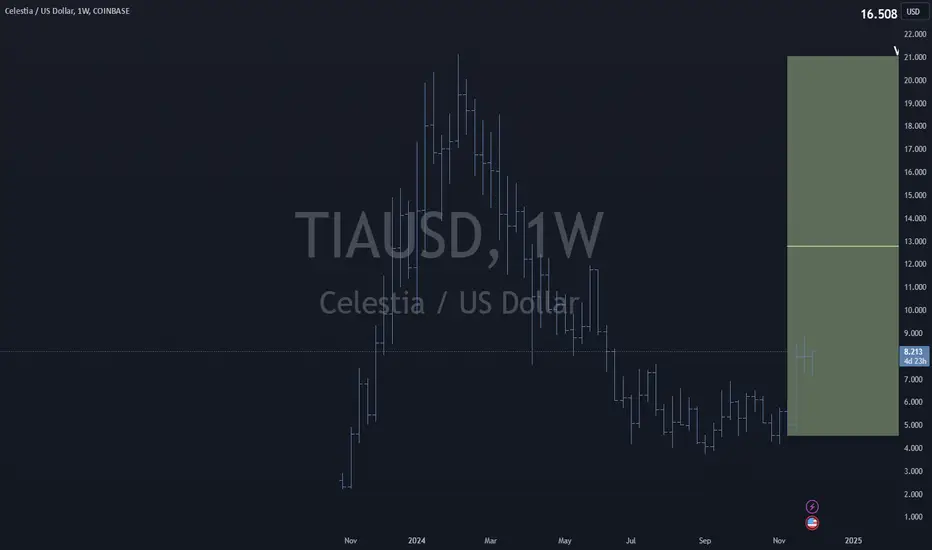
Celestia ($TIA) goes wild82% retrace. Accumulation. Breakout.
Send TIA back to its previous highs with haste.
See all ideas
Summarizing what the indicators are suggesting.
Oscillators
Neutral
SellBuy
Strong sellStrong buy
Strong sellSellNeutralBuyStrong buy
Oscillators
Neutral
SellBuy
Strong sellStrong buy
Strong sellSellNeutralBuyStrong buy
Summary
Neutral
SellBuy
Strong sellStrong buy
Strong sellSellNeutralBuyStrong buy
Summary
Neutral
SellBuy
Strong sellStrong buy
Strong sellSellNeutralBuyStrong buy
Summary
Neutral
SellBuy
Strong sellStrong buy
Strong sellSellNeutralBuyStrong buy
Moving Averages
Neutral
SellBuy
Strong sellStrong buy
Strong sellSellNeutralBuyStrong buy
Moving Averages
Neutral
SellBuy
Strong sellStrong buy
Strong sellSellNeutralBuyStrong buy
Displays a symbol's price movements over previous years to identify recurring trends.