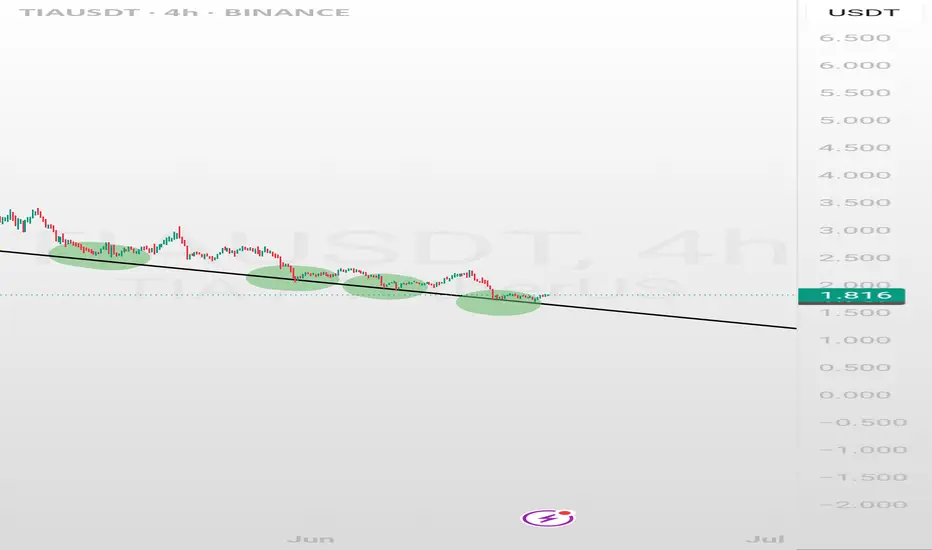
TIA Dynamic Support LineThe support I have set for Tia purchase
The QT process is ongoing. There is no liquidity in the market. In non-major markets, support levels are dynamically shifting downwards.
Tia short-dump continues to $1.56Just took a short position on Tia.
Target: $1.56
Stop: $1.721
roughly 3RR
Market likely to continue dumping soon
DTT applied.
OVerall market is heading down, market objective is likely to make new lower lows. Correction happening now before continuation. Market is back at supply area that sold

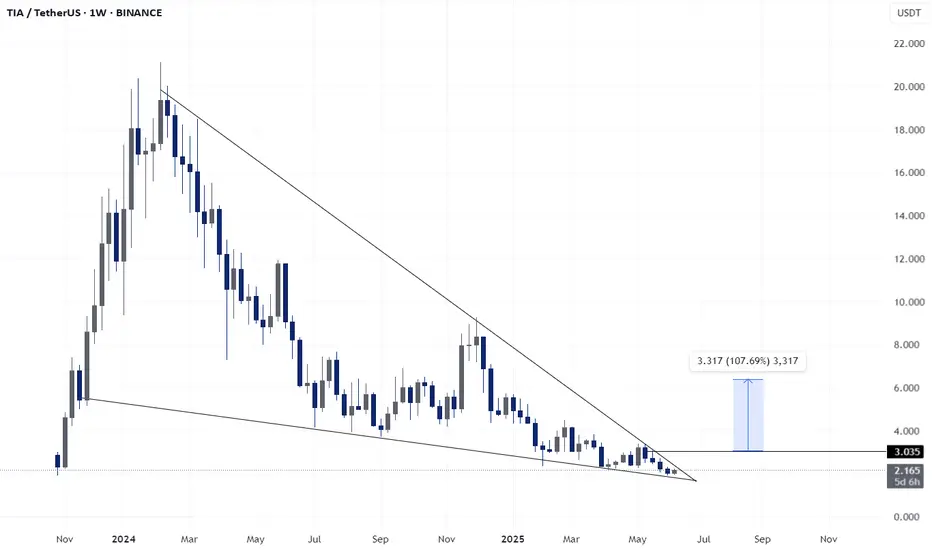
TIA - Super Bullish For AltseasonBINANCE:TIAUSDT
𝐓𝐈𝐀/𝐔𝐒𝐃𝐓
TIA is coiling at the tip of a falling wedge — a breakout looks imminent. Eyes on the $3.31 level for a potential 107% move if bulls take charge
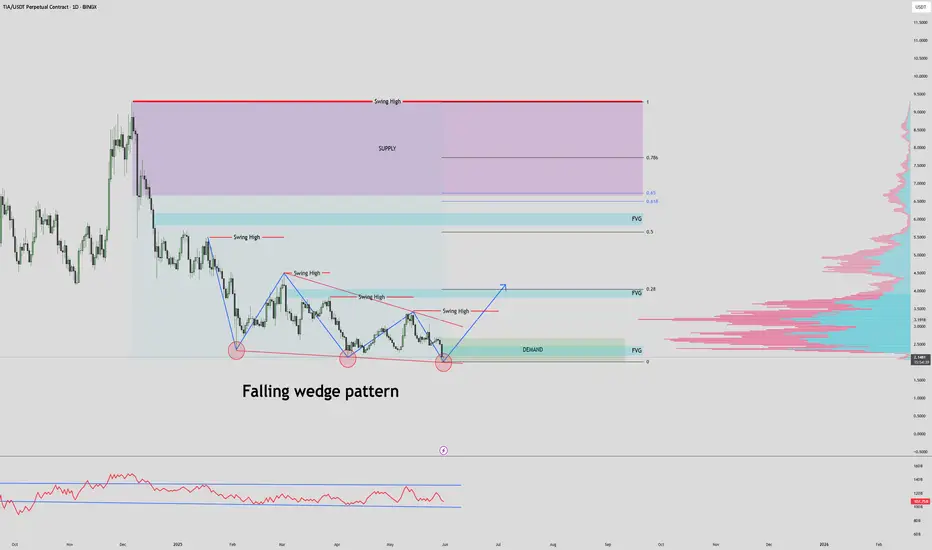
$ENS / USDT Daily Time frame, MAJOR PUMP?Chart Overview
- Pattern Identified: Falling Wedge Pattern
- A bullish reversal pattern, often appearing after a downtrend.
- Three major touchpoints on the lower trendline indicate strong support and pattern validity.
Demand Zone (Support Area)
- Marked near the current price level (
TIAUSDTTIAUSDT
SPOT
BUY NOW
LONG TERM
This is a personal analysis, it can and will have good growth potential.

TIAUSDT: Trend in daily timeframeThe color levels are very accurate levels of support and resistance in different time frames, and we have to wait for their reaction in these areas.
So, Please pay special attention to the very accurate trend, colored levels, and you must know that SETUP is very sensitive.
Be careful
BEST
MT

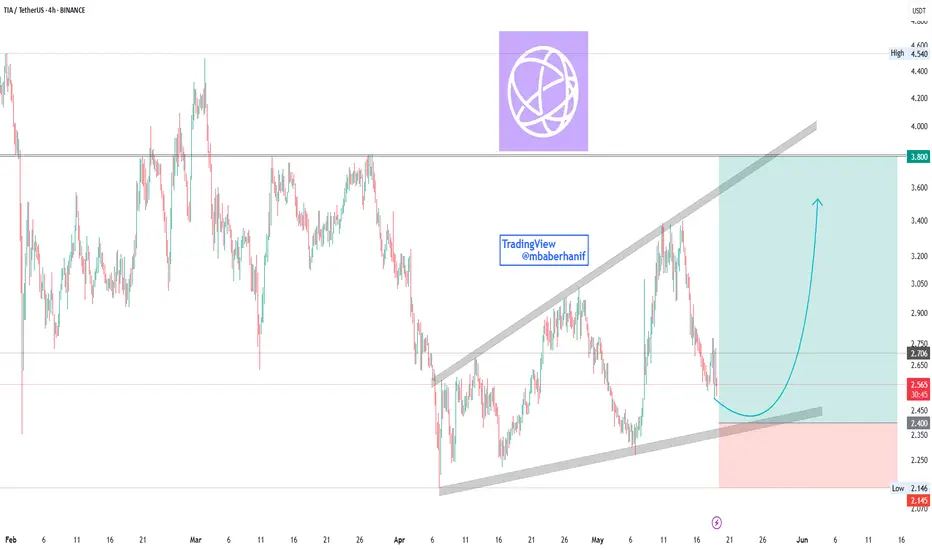
TIA/USDT Ascending ChannelThis chart of TIA/USDT on the 4-hour timeframe. Here's a breakdown of the chart and what it's suggesting:
1. Pattern: Ascending Channel
The price appears to be moving within an ascending channel (marked by two parallel trendlines).
The support and resistance levels of the channel are well defin
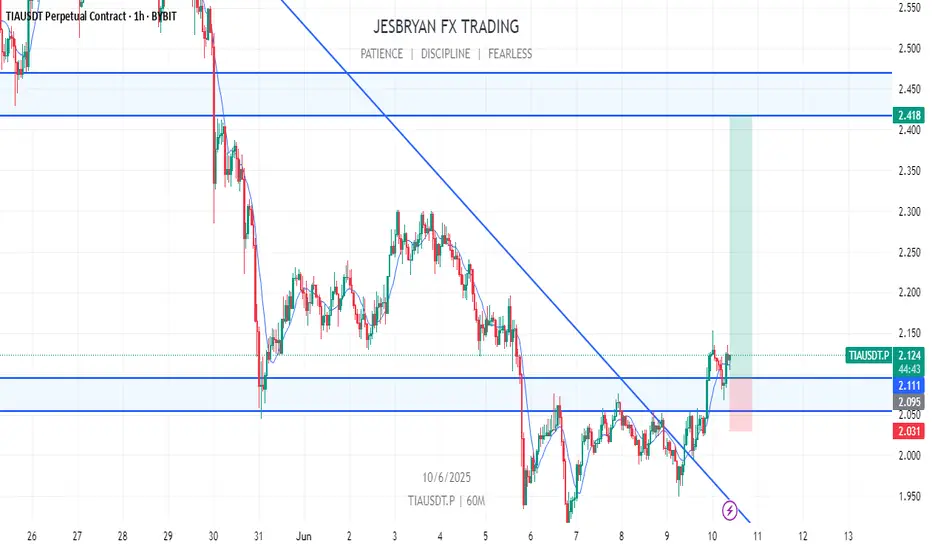
TIA analysisTIA has broken the downtrend line and the resistance area. You can open a long position at the retest of this zone. We may see a significant move in altcoins once BTC reaches a new all-time high.
Support Area: $2.05-$2.08
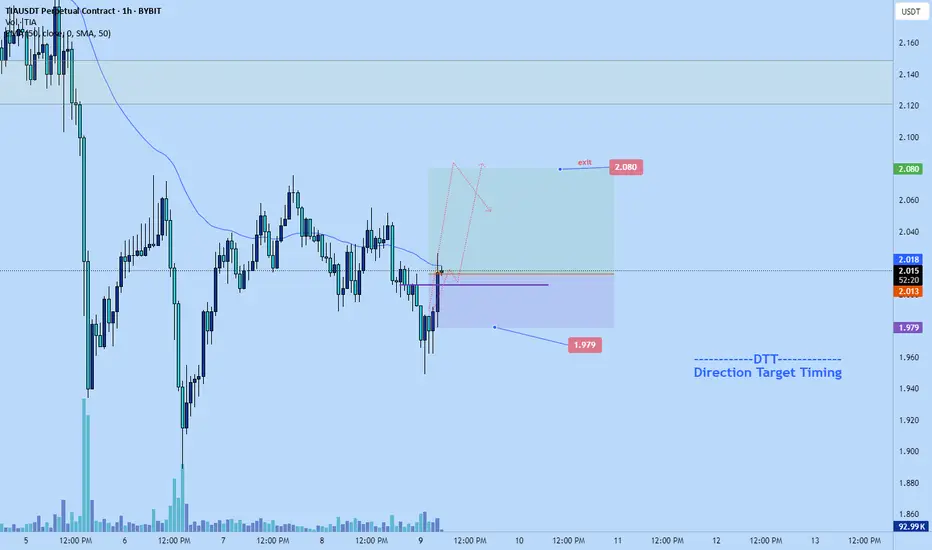
Tia scalp long to $2.08 Opened a scalp long position just now on Tia.
Targeting $2.08
Time sensitive.
Anticipating an impulsive push before next correction. If get correction now though I think it be a quick one and 1.979 stop should be sufficient
TIA Dynamic Support Line for Buy PointsThe support I have set for Tia purchase
The QT process is ongoing. There is no liquidity in the market. In non-major markets, support levels are dynamically shifting downwa

See all ideas
Summarizing what the indicators are suggesting.
Oscillators
Neutral
SellBuy
Strong sellStrong buy
Strong sellSellNeutralBuyStrong buy
Oscillators
Neutral
SellBuy
Strong sellStrong buy
Strong sellSellNeutralBuyStrong buy
Summary
Neutral
SellBuy
Strong sellStrong buy
Strong sellSellNeutralBuyStrong buy
Summary
Neutral
SellBuy
Strong sellStrong buy
Strong sellSellNeutralBuyStrong buy
Summary
Neutral
SellBuy
Strong sellStrong buy
Strong sellSellNeutralBuyStrong buy
Moving Averages
Neutral
SellBuy
Strong sellStrong buy
Strong sellSellNeutralBuyStrong buy
Moving Averages
Neutral
SellBuy
Strong sellStrong buy
Strong sellSellNeutralBuyStrong buy
Displays a symbol's price movements over previous years to identify recurring trends.