TIAUSDT.PS trade ideas
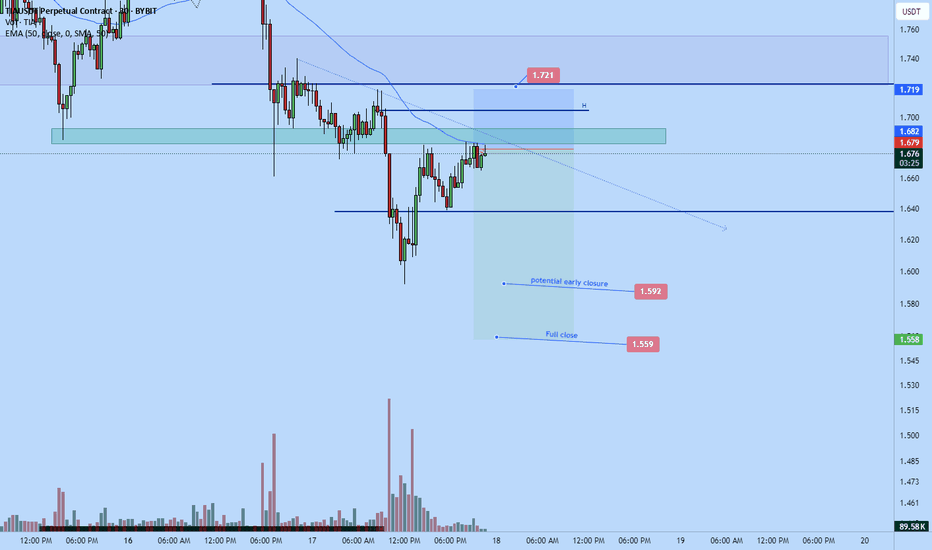
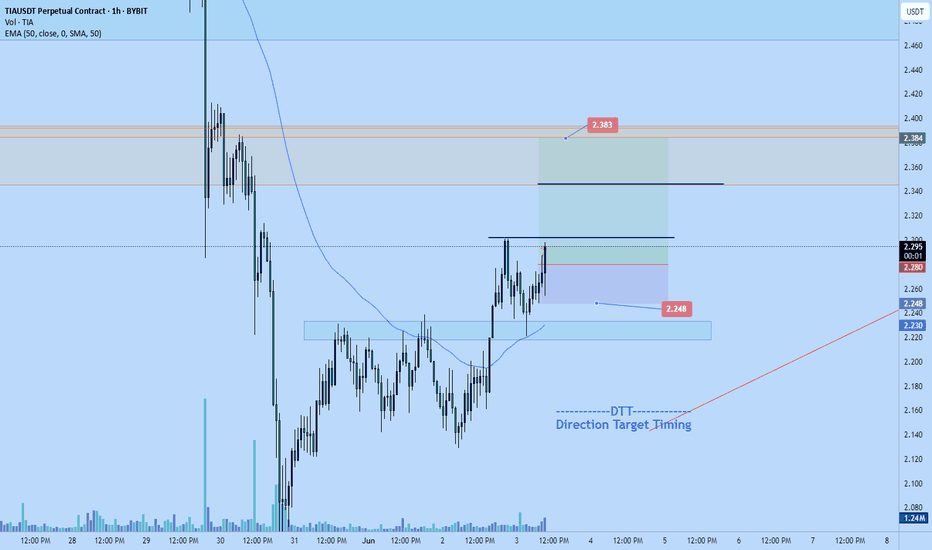
Tia short-dump continues to $1.56Just took a short position on Tia.
Target: $1.56
Stop: $1.721
roughly 3RR
Market likely to continue dumping soon
DTT applied.
OVerall market is heading down, market objective is likely to make new lower lows. Correction happening now before continuation. Market is back at supply area that sold off aggressively in past.
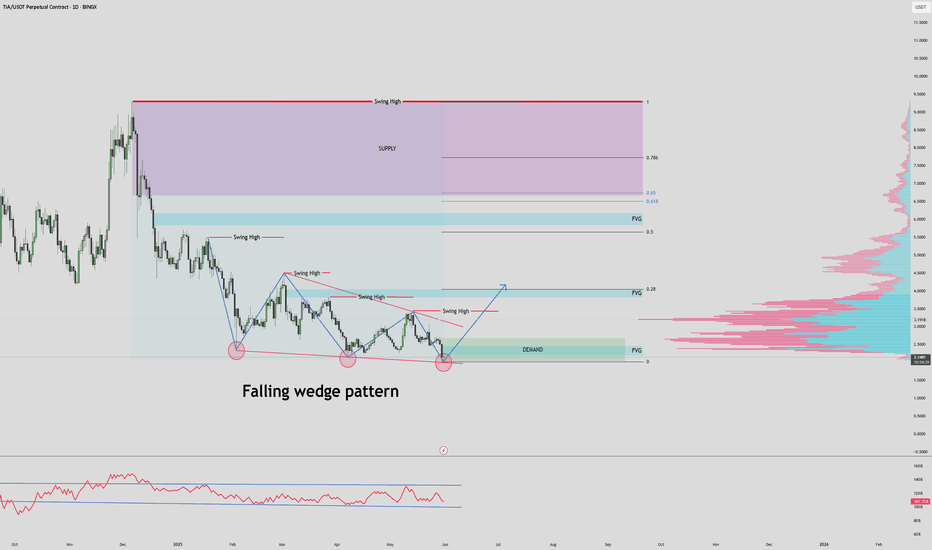
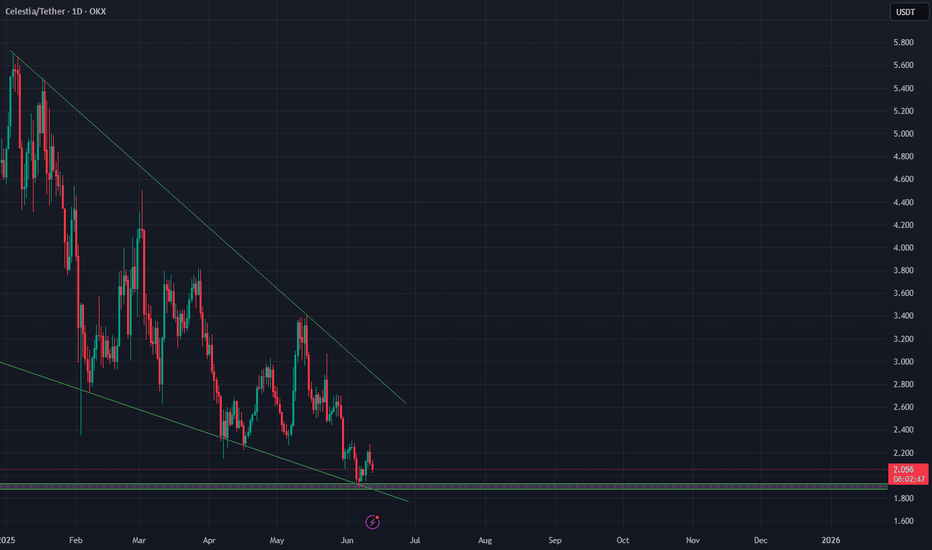
$ENS / USDT Daily Time frame, MAJOR PUMP?Chart Overview
- Pattern Identified: Falling Wedge Pattern
- A bullish reversal pattern, often appearing after a downtrend.
- Three major touchpoints on the lower trendline indicate strong support and pattern validity.
Demand Zone (Support Area)
- Marked near the current price level ($2.0309 - $2.6722)
- Price is testing this zone for the third time.
Supply Zone (Resistance Area)
- Around ($6.6529 – $9.2734)
- Multiple swing highs are plotted within or near this region, indicating strong historical resistance.
Volume Profile (Right side of chart)
- High volume node between $2.50 – $4.00 suggests price acceptance and a potential area for consolidation or resistance after breakout.
- Low volume area between $4.50 – $6.50 implies less resistance, so price might move quickly through it.
FVG (Fair Value Gaps)
- Several FVGs (imbalance zones) are highlighted.
- $3.8 – $4.05
- $5.8236 – $6.1663
- These zones often act as magnets for price, offering potential targets after breakout.
📏 Fibonacci Levels
- Pullback levels (0.28, 0.5, 0.618, 0.786) are marked.
- Price may retrace toward these areas as part of the bullish structure.
✅ Bullish Scenario
- Breakout from the falling wedge pattern.
- Price pushes into first FVG (~$3.8), then toward $5.8236 – $6.1663, eventually challenging the supply zone ($6.6529 – $9.2734)
⚠️ Risks
- If price breaks below the demand zone, it invalidates the wedge and opens room for further downside.
- Falling wedge breakouts require confirmation (e.g., daily close above wedge resistance).
📊 Summary
- Bias: Bullish if support holds and wedge breakout occurs.
- Trigger: Break and close above wedge resistance line.
- Targets: $3.8 → $5.8 → $6.1 → $9.5
- Invalidation: Daily close below the demand zone ($2.00 - $1.90)
Please note this is not financial Advice. This is just an analysis!
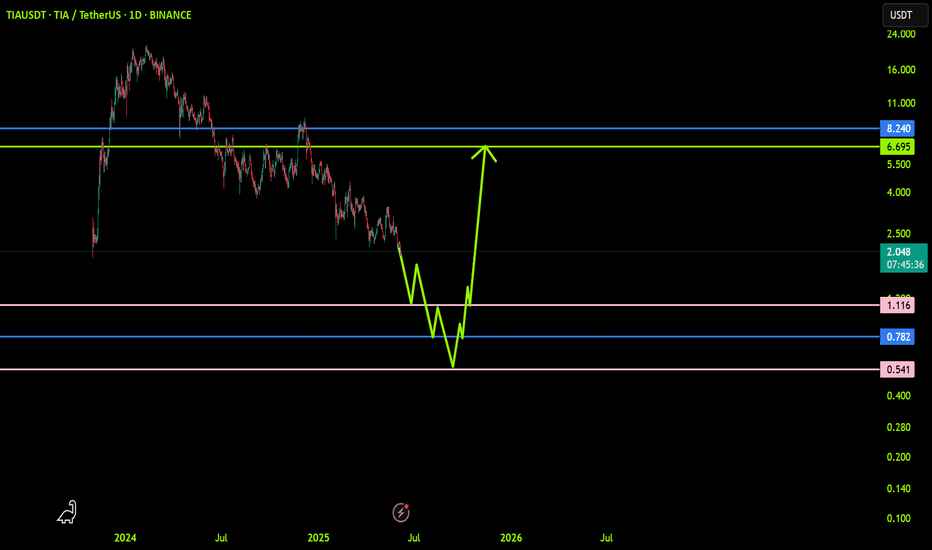
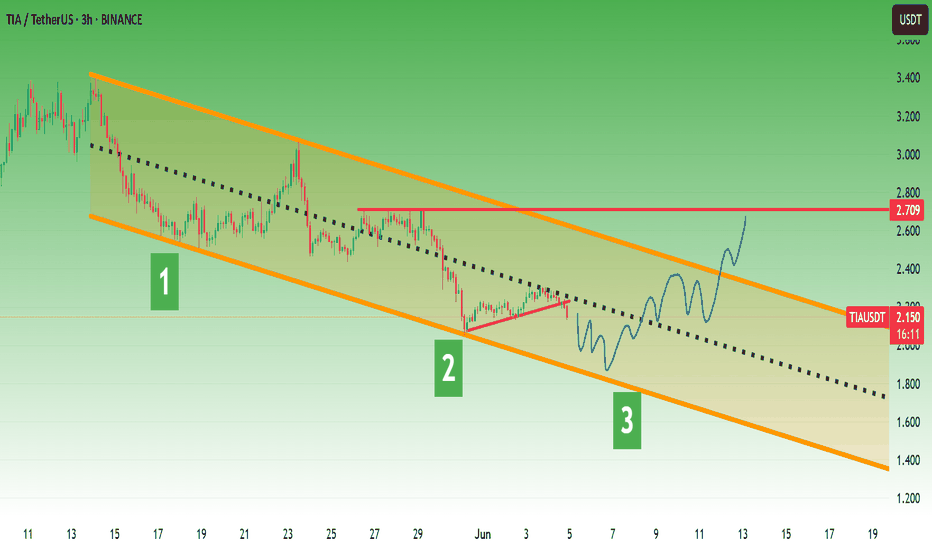
TIAUSDT: Trend in daily timeframeThe color levels are very accurate levels of support and resistance in different time frames, and we have to wait for their reaction in these areas.
So, Please pay special attention to the very accurate trend, colored levels, and you must know that SETUP is very sensitive.
Be careful
BEST
MT
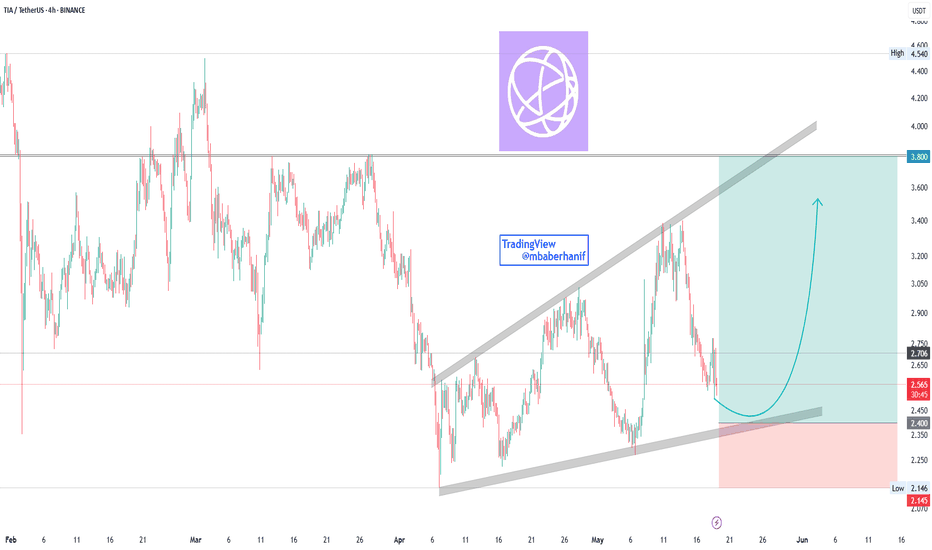
TIA/USDT Ascending ChannelThis chart of TIA/USDT on the 4-hour timeframe. Here's a breakdown of the chart and what it's suggesting:
1. Pattern: Ascending Channel
The price appears to be moving within an ascending channel (marked by two parallel trendlines).
The support and resistance levels of the channel are well defined, suggesting a bullish structure overall.
2. Current Price Action
Price is currently at $2.536, nearing the lower boundary (support) of the ascending channel.
There is a blue curved arrow, suggesting a bullish bounce off the support line and a move toward the upper boundary of the channel.
3. Trade Setup (Long Position)
Entry Zone: Near current level ($2.53), just above the support.
Stop Loss (Red Box): Below the channel support, around $2.15.
Target (Green Box): Near the top of the channel, around $3.80.
This sets up a favorable risk-to-reward ratio ( 1 : 5.5 )).
4. Support & Resistance
Key Support: ~$2.15 (stop-loss level), channel bottom.
Immediate Resistance: ~$2.75 (mid-channel zone).
Major Resistance (Target): ~$3.80 (channel top).
Conclusion
This chart suggests a bullish trade idea, based on:
Price rebounding from the bottom of a rising channel.
Strong risk-reward setup (target ~$3.80, stop ~$2.15).
If the support fails, the setup is invalidated with limited downside risk.
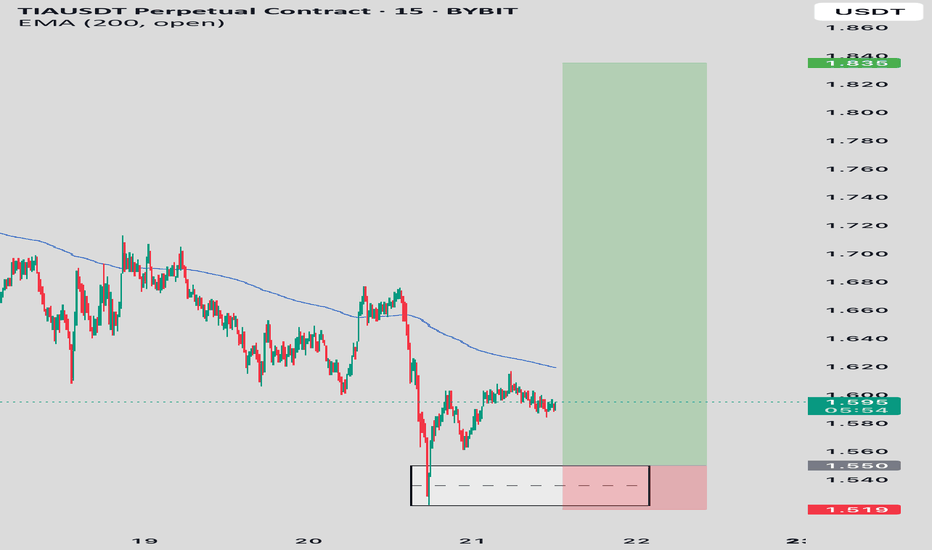
TIAUSDT – Potential Reversal in Play Price is showing early signs of a bullish reversal after a prolonged downtrend.
Currently testing the 200 EMA from below, a key decision zone.
Plan:
• Entry Zone: Above 1.550 (pending confirmation)
• SL: 1.519 (below recent demand zone)
• TP: 1.835
• RR: 1:5+
⚠️ If price reclaims the 200 EMA with strong volume, expect momentum toward 1.83.
Patience is key, let the setup confirm.
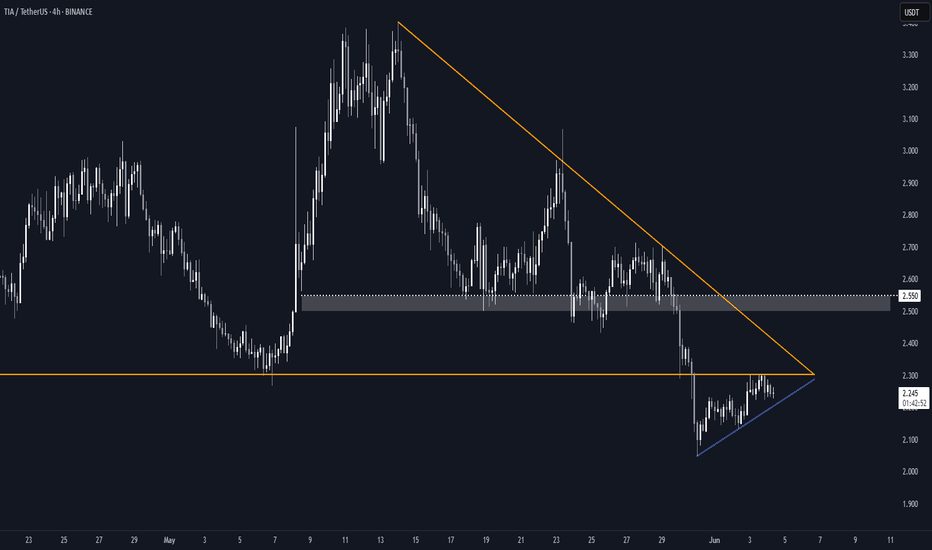
Celestia (TIA) – Ascending Triangle Setup (4H)BINANCE:TIAUSDT is printing a clean ascending triangle on the 4H chart, signalling a potential reversal.
Key Levels
• Support: Ascending trendline
• Resistance: $2.30 – a key level that acted as support since early April
• Measured Target: $2.50–$2.55 – aligns with prior support area
• Watch out for the longer-term descending trendline, which could act as resistance on breakout around ~$2.40
Breakout Trigger
A solid 4H close above $2.30 with convincing volume could confirm the move
Invalidation
A sustained break below the ascending support would fully invalidate the setup and potentially lead to a drop to $1.70
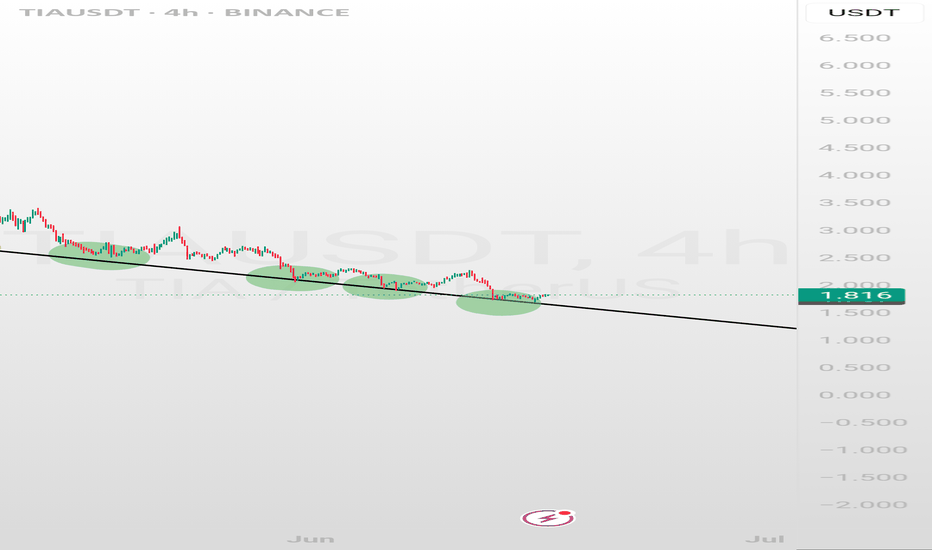
Tia bearish short term.To me the view is pretty clear.
* The purpose of my graphic drawings is purely educational.
* What i write here is not an investment advice. Please do your own research before investing in any asset.
* Never take my personal opinions as investment advice, you may lose your money.
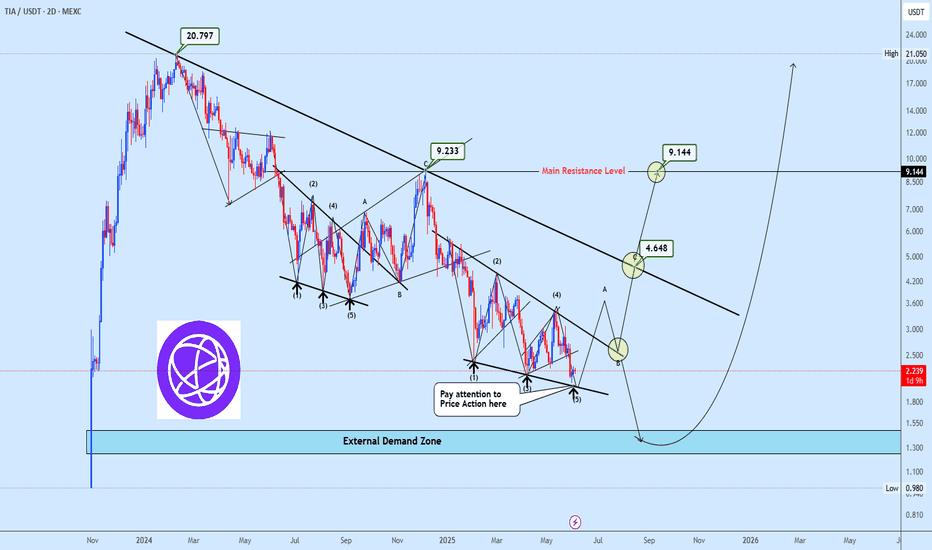
TIAUSDT Monitoring Completion of Bearish 5-Wave FormationTIAUSDT remains in a structured downtrend, nearing completion of a potential 5-wave bearish pattern similar to a previous setup that led to an upside breakout before resuming the decline. A similar scenario is anticipated this time, with plans to go long if price action confirms a strong rejection around Wave 5.
A projected ABC corrective move outlines the near-term bullish targets. The $4.648 level will act as a key pivot; a breakout above it could shift momentum bullishly, opening the path toward $9.144. However, failure at that level may trigger renewed downside toward the $1.30–$1.55 demand zone.
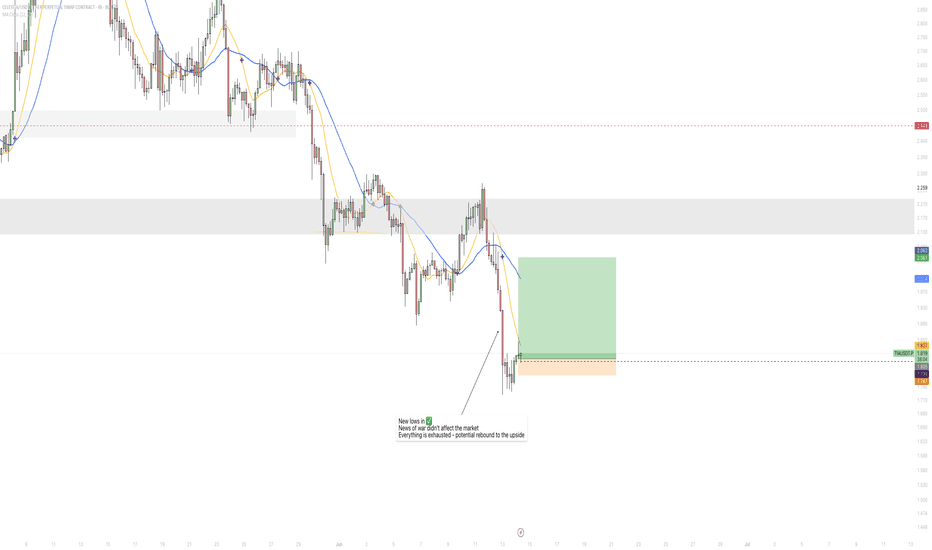
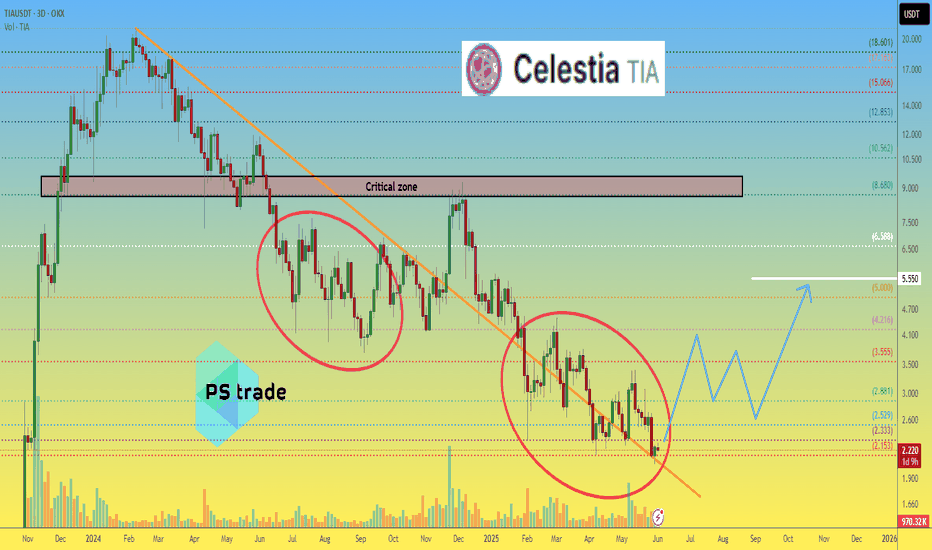
Celestia TIA price analysis#TIA price currently looks “weak,” gradually sliding down and updating lows.
A “ray of hope” may be a repeat of the fractal behavior of the OKX:TIAUSDT price from last year, when, after the third slight update of the low, the price began to rebound upward.
If we take this fractal as a basis, then in the near future, the price of the #Celestia token should rebound to $4, followed by a correction and continued growth to $5.55.
_____________________
Did you like our analysis? Leave a comment, like, and follow to get more
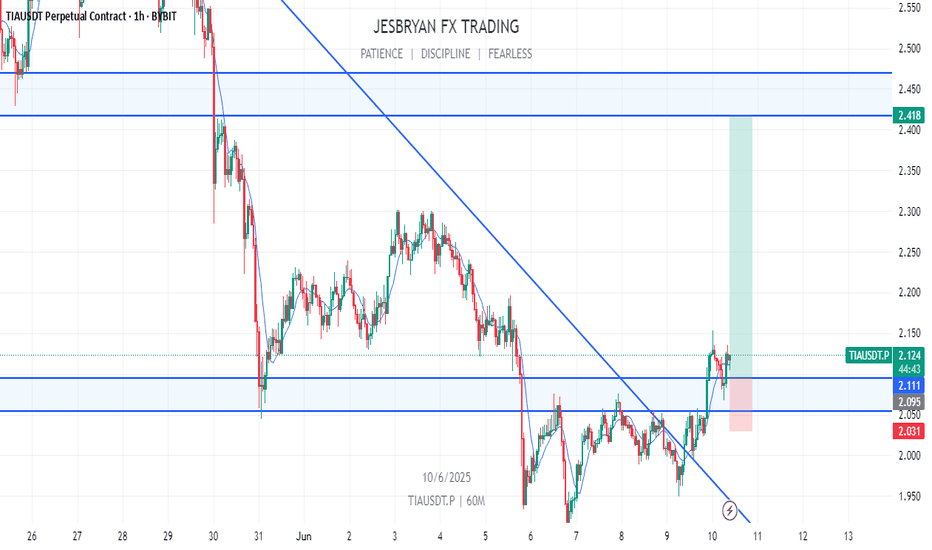
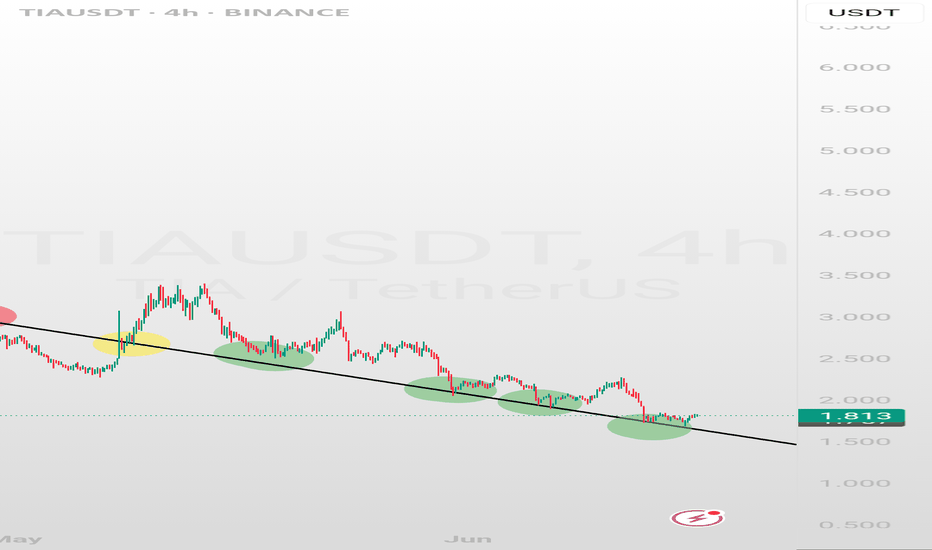
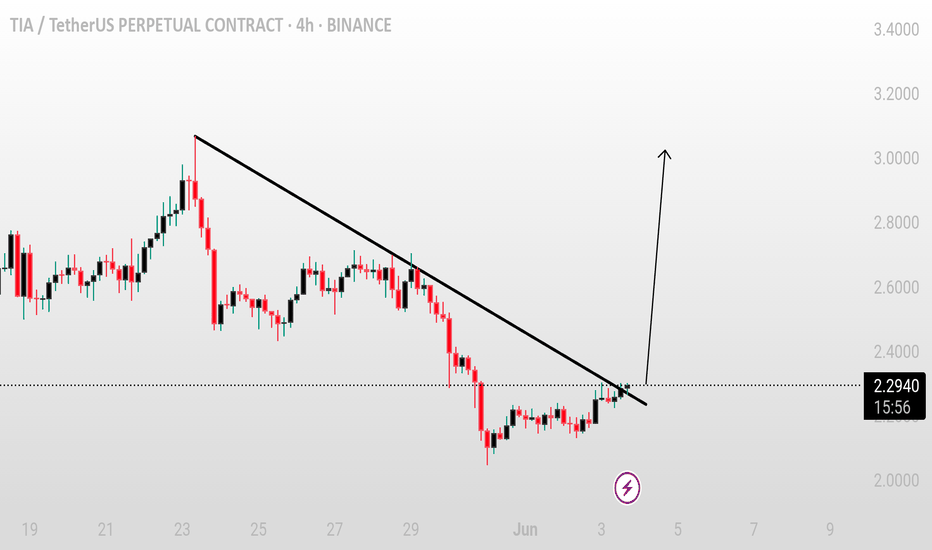
TIA/USDT – Trendline breakout watchTIA/USDT – Trendline breakout watch
TIA has broken above the descending trendline, indicating a potential shift in momentum. If the price manages to hold above the breakout zone with stability, we can expect a bullish move ahead.
A successful retest and hold above the trendline could trigger a pump of around 15–30% in the coming sessions.
Key levels to watch:
* Breakout support zone
* Confirmation with volume
* Immediate resistance ahead
Monitor closely — holding the breakout could open the door for a solid upside move.
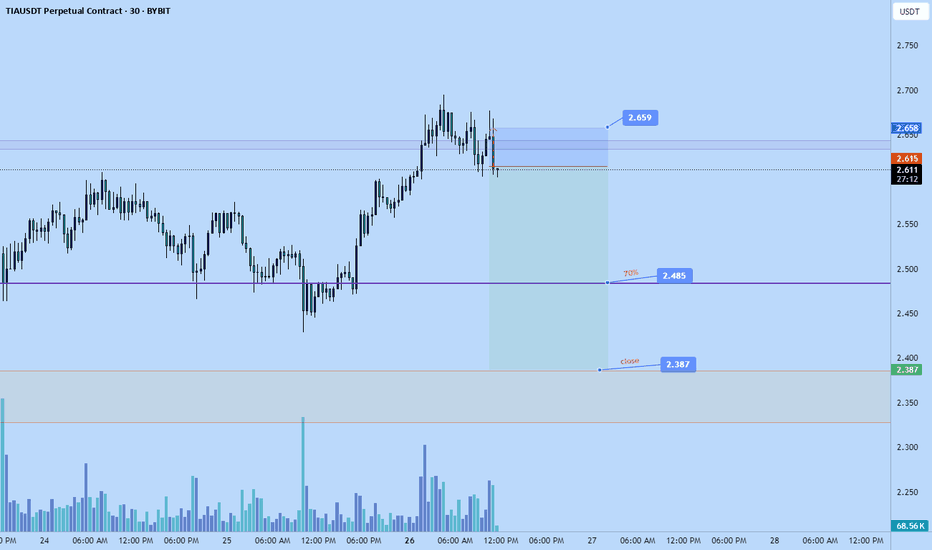
Tia short to $2.387Gm, just went short on tia. I anticipate that the market will reverse completely and fall back down to $2.387 to make new lows this week. Where the market closed the weight isn't a demand zone thus I expect the market to continue to fall to that area in order to gain enough demand to actually pump and flip the daily trend back bullish. Current its bearish
Stop: $2.659 or higher
