The Bulls Are Back in Town!TIA appears to have completed its downside correction, and we are now targeting an upside move. The current market structure shows strength, with potential bullish momentum building.
Key Levels and Strategy:
Breakout Confirmation:
The recent price action has broken above a significant resistance level, confirming the initial bullish breakout. This indicates a shift in sentiment and opens the path for further upward movement.
Retest Opportunity:
A retest of the first broken resistance level is anticipated, providing an ideal entry point for this transaction. Retests often offer a higher probability setup as they confirm the strength of the breakout.
Target Zones:
With the downside likely behind us, our focus shifts to key resistance levels above. Watch for price action around these zones to scale out or adjust positions as the market progresses.
Risk Management:
It's crucial to position your stop-loss strategically, just below the retest level or near recent support zones, to protect against invalidation.
Final Thoughts:
The current structure supports a bullish outlook, but patience is required to capitalize on the retest entry. Always manage your risk and adapt to evolving market conditions.
📌 Follow me for more game-changing setups, expert insights, and strategies that work! 🚀
I don't overcomplicate things and add a ton of dirty crap to my charts, but you can check out the success of my analysis below.
I approach trading with confidence backed by experience and past success in identifying high-probability setups.
While I don’t claim to be the best, my track record speaks for itself, and I strive to let my analysis and results do the talking. Watch these levels closely—markets can confirm what charts already whisper. Let’s see how this plays out together.
My Previous Hits
🐶 DOGEUSDT.P | 4 Reward for 1 Risk (or more if you’re bold).
DOGEUSDT.P: Next Move
🎨 RENDERUSDT.P | HTF Sniper Precision
RENDERUSDT.P: Opportunity of the Month
💎 ETHUSDT.P | Buyer Zone So Accurate You’ll Double Check
ETHUSDT.P: Where to Retrace
🟢 BNBUSDT.P | Buyer Zone Mastery (CZ vibes).
BNBUSDT.P: Potential Surge
📊 Bitcoin Dominance | Called it Like a Pro
BTC Dominance: Reaction Zone
🌊 WAVESUSDT.P | The Blue Box: A Demand Zone with Potential
WAVESUSDT.P: Demand Zone Potential
🟣 UNIUSDT.P | Long-Term Trade
UNIUSDT.P: Long-Term Trade
Now sit back, relax, and watch the market do its thing. Or don’t, FOMO is real. 😉
TIAUSDT.PS trade ideas

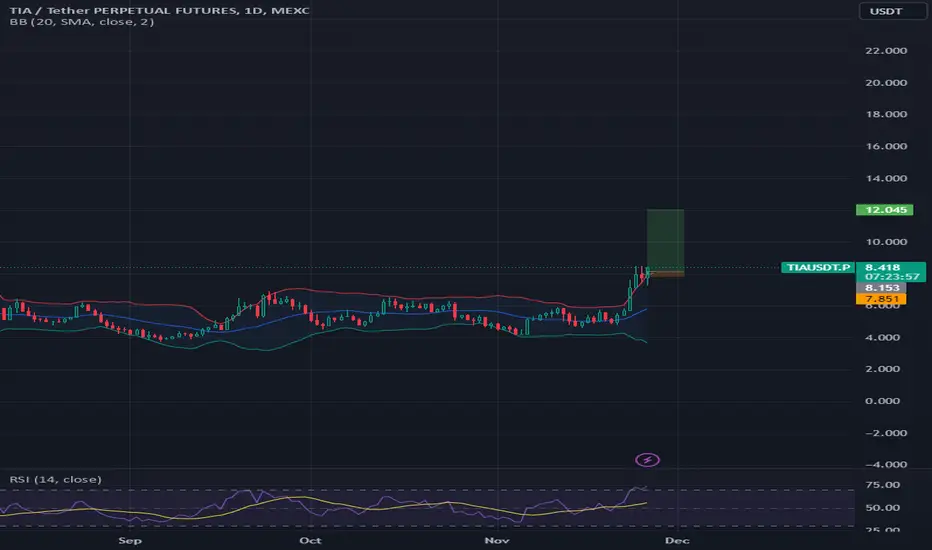
$TIA 100% Gain Potential Incoming!LSE:TIA USDT has some big gains coming based on the charts. It recently broke out of consolidation since July 24, which is projected to give 100% from the breakout around $14.
It the short term, if we focus on the 4 - 6hr chart, price action is forming a bullish pennant, and consolidating nicely as the momentum is cooling off. The price action is creating Higher lows while the RSI is creating Lower lows, this is bullish divergence.
A breakout of this pattern could give us a quick move to the target of $11. Would like to see increasing volume into next week.
Entry: $8
TP 1: $10.1
TP 2: $11.7
SL: $7.66
NFA & DYOR. GL:)

TIAUSDT #001 ( CLOSE above block , ready to fly ) Hello dear traders
Good days .
First of all thanks for your support and comments.
TIAUSDT closed above consolidation block .
Good opportunity for investment.
Stop loss can be below green buy order block.
Good luck and Safe trades .

TIA Spot Buytia has the potential to do 100% profit.
you can spot buy if daily candle closes above 8.9300 with target 9.0150

TIAUSDT
TIA/USDT is expected to reach the Fibonacci levels of 31% and 50%, potentially approaching the price of 13 USDT. If the price hits these levels, there could be further upward movement. Keep an eye on the market to identify entry opportunities and manage risk carefully.
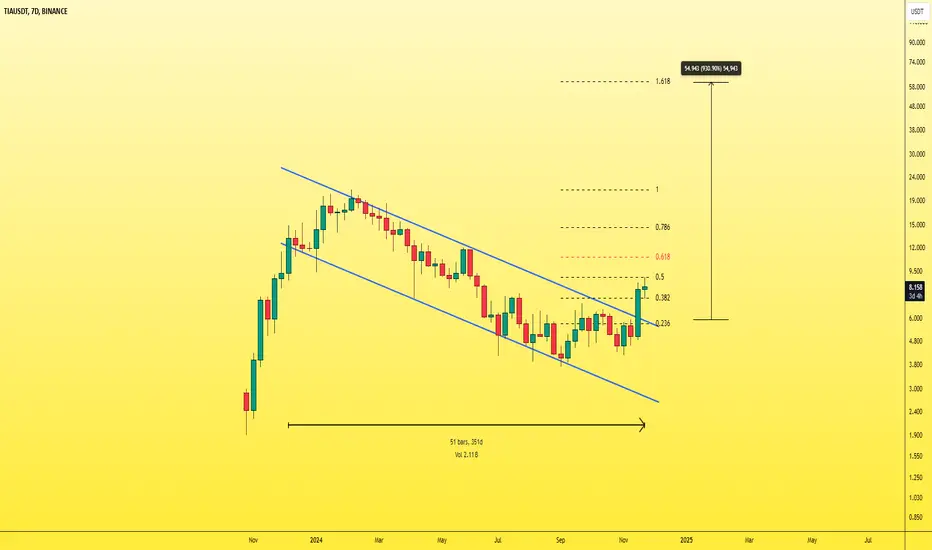
TIAUSDT - great targets aheadweekly chart displays breakout the descending channel since about 12 months!!
it's just begaining .. big move did'nt started yet
target around 60$🎯
Analysis of TIA in the dollar pairThe TIA coin has just broken an important milestone and could give us an excellent buying position if it pulls back to support, which could be an excellent stop bridge and a very favorable risk/return ratio.
For more analyses like this, follow me. Never forget to manage your risk and not expose yourself too much to the market.

TIA bullishBINANCE:TIAUSDT
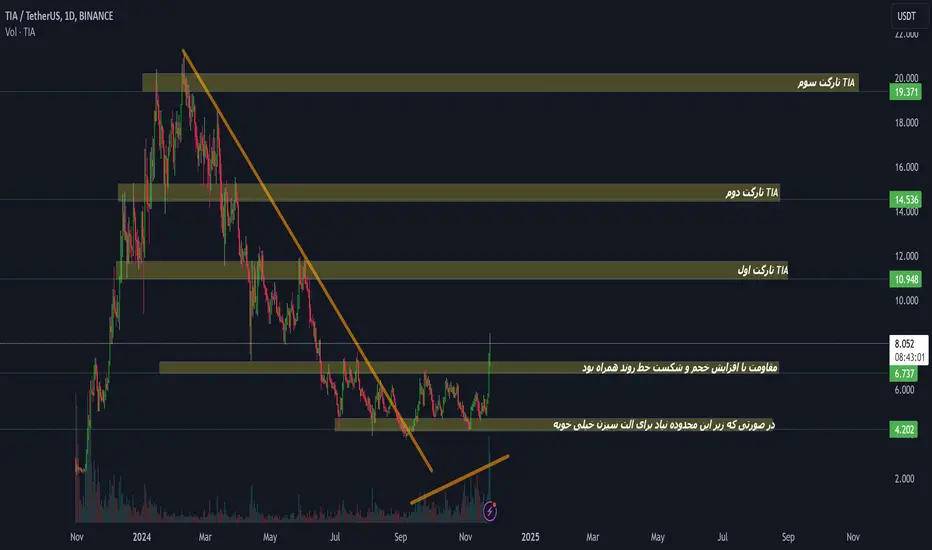
We’re seeing Celestia respecting the support btw $4.2 and $3.8 after being in a downtrend. Right now its trying to break the Key Lvl which has played as support and resistance.
So far, it hasn’t broken through, If a daily candle breaks this level and closes above it It means a reversal and the targets will be ld $12 and then $15
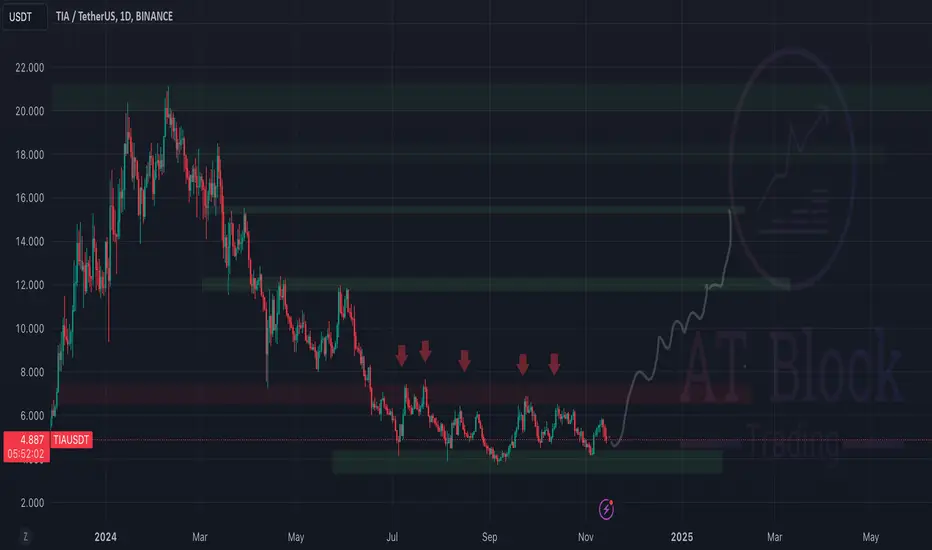
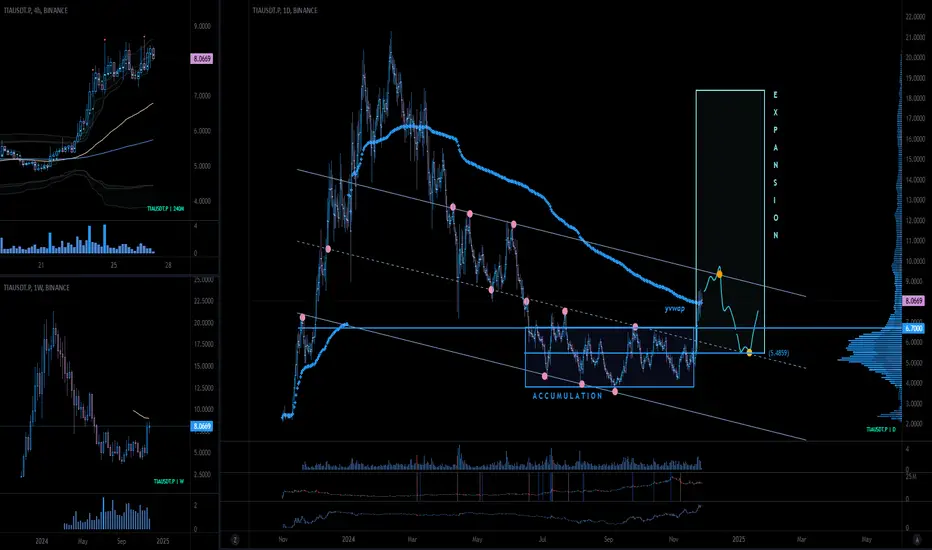
$TIA - Buying ZonePrice Action Overview:
TIA (Celestia) surged by 80% following its major token unlock last October. It broke out from a 150-day accumulation range.
Current Situation:
The price is currently facing rejection at the yearly VWAP. While there’s potential for a spike to $9.50–$10 range, a breakout from this channel is unlikely in the immediate term.
Potential Pullback:
A retest around $6.70 (previous range high) is expected. There’s also a possibility of deviation down to $5.50
Accumulation Zone:
If you’re looking to accumulate, the $6.70–$5.50 range is an ideal area to consider.
tia usdtWe have a good probability to see above the price to 12 at this week, i guided by just technical analysis.
TIAUSDT CelestiaThis chart is just for fun. I bought big bag of TIA (4.55 avg) just in case. If my idea is correct, it could go more then 1000% up Do your research...
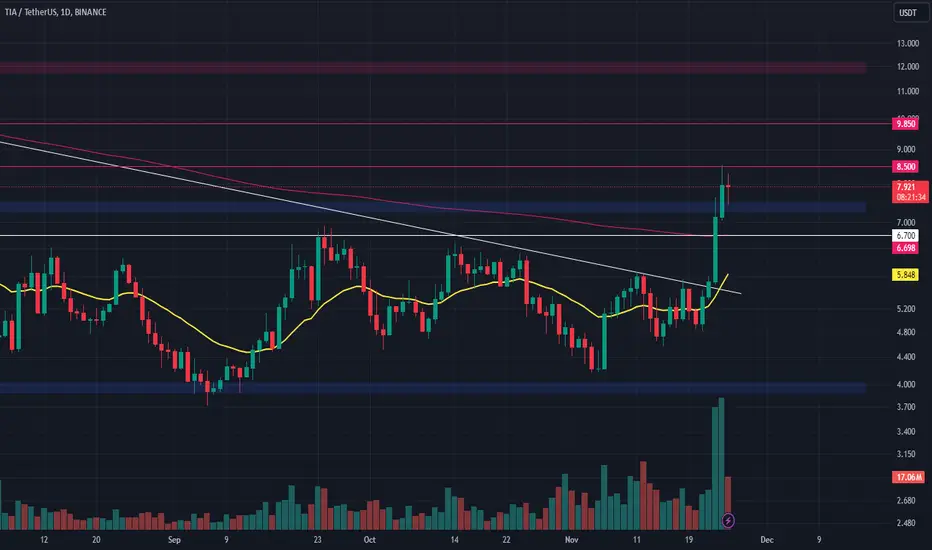
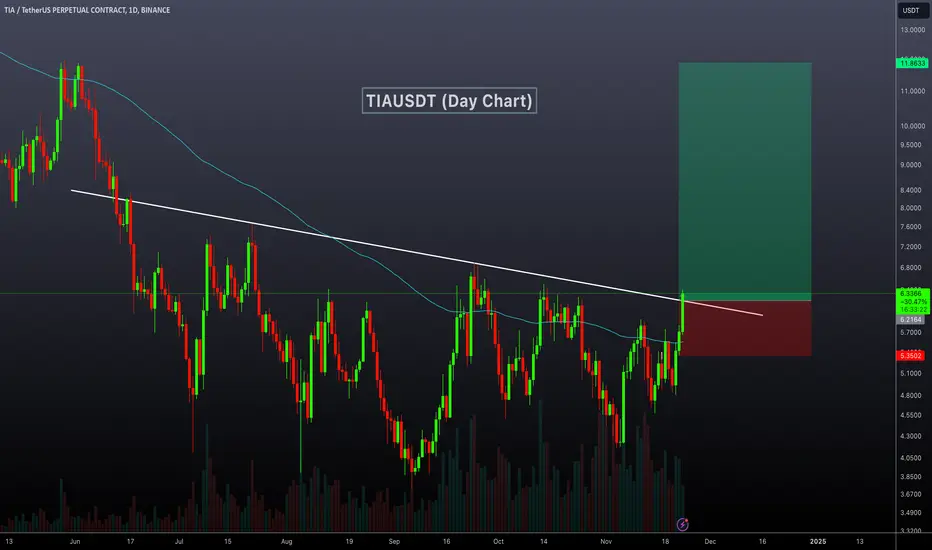
TIA Long Spot Trade (Reversal Potential) Market Context:
TIA has faced a significant downturn due to distribution, but it appears to have bottomed after breaking out of its trend line resistance. The price has reclaimed its bear market range and is consolidating above support, signaling potential for a strong rebound.
Trade Setup:
Entry Zone: Around $7.40 (support level)
Take Profit Targets:
First target: $8.50
Second target: $9.85
Stop Loss: Just below $6.70
This setup leverages the breakout confirmation and support retest for a calculated risk-to-reward opportunity. Monitor for sustained price action above the breakout level.
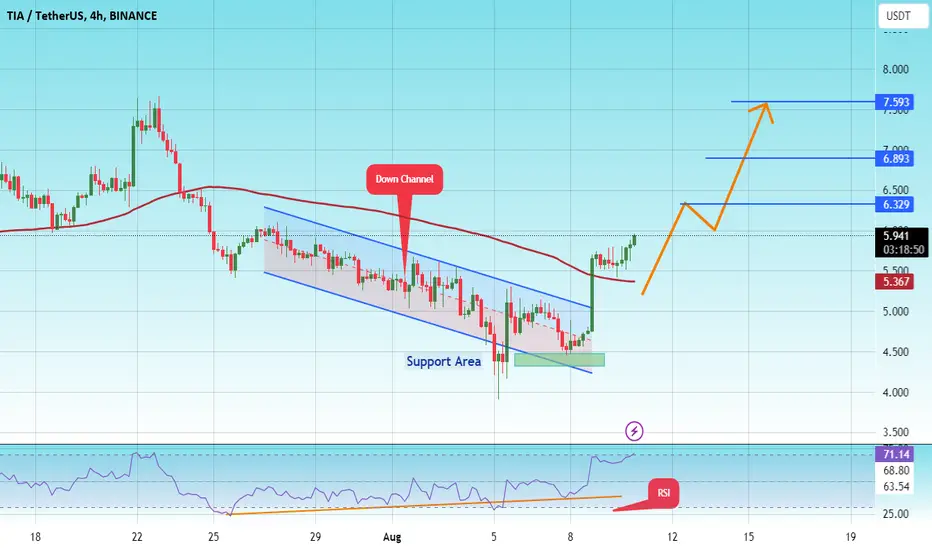
#TIA/USDT#TIA
The price is moving in a descending channel on the 4-hour frame and it was broken upwards
We have a trend to stabilize above the moving average 100
We have an upward trend on the RSI indicator that supports the rise by breaking it upwards
We have a major support area in green at a price of 4.50
Entry price 5.40
First target 6.33
Second target 6.60
Third target 7.60
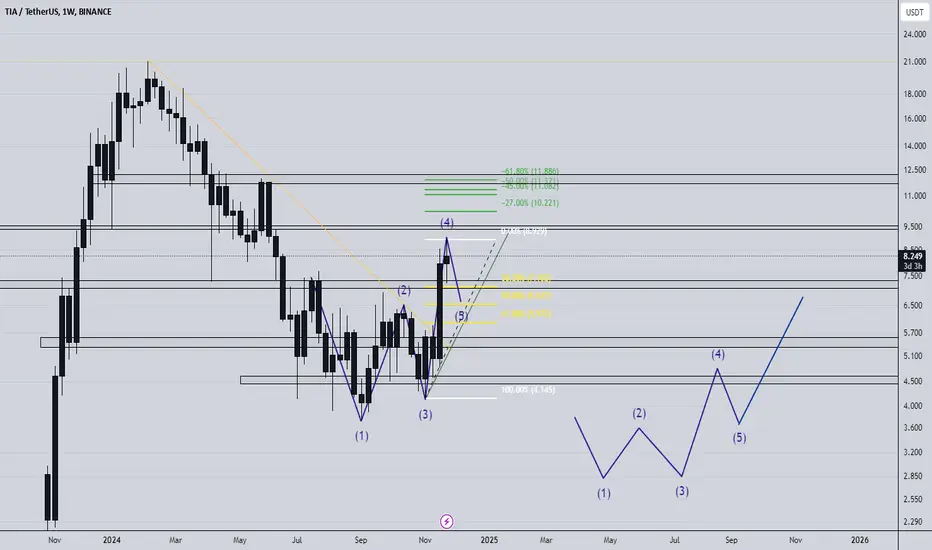
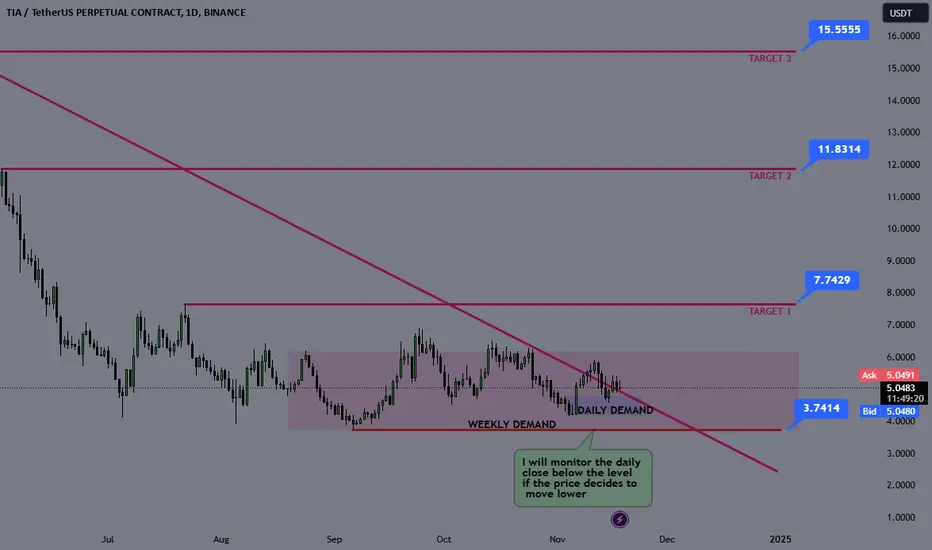
TIA Swing Long Idea - Celestia Altcoin LongTIA was one of the best-performing assets during the 2023-2024 altcoin run. As a leader in modular blockchain technology, I find its fundamentals very strong. I’ve been holding a significant number of TIA spot positions since 2023."
Technical Analysis:
The price has been relatively weak over the past few months. However, starting from September 2024, we saw an upward movement, creating a weekly bullish structure. The price broke the bearish trendline and closed above it. After deviating from the trendline, it retraced to the daily demand zone below, found support, and is currently holding above the trendline.
The price appears to be in an accumulation phase, lagging behind the upward movement of other coins. Despite this, I like the current levels and have opened a small position here.
Note: If Bitcoin retraces sharply, it could trigger the stop loss and take me out of the trade. To manage this risk, I will monitor the daily close below my stop-loss level before fully exiting.
SL: $3.60
TP1: $7.60
TP2: $11.90
TP3: $15.55
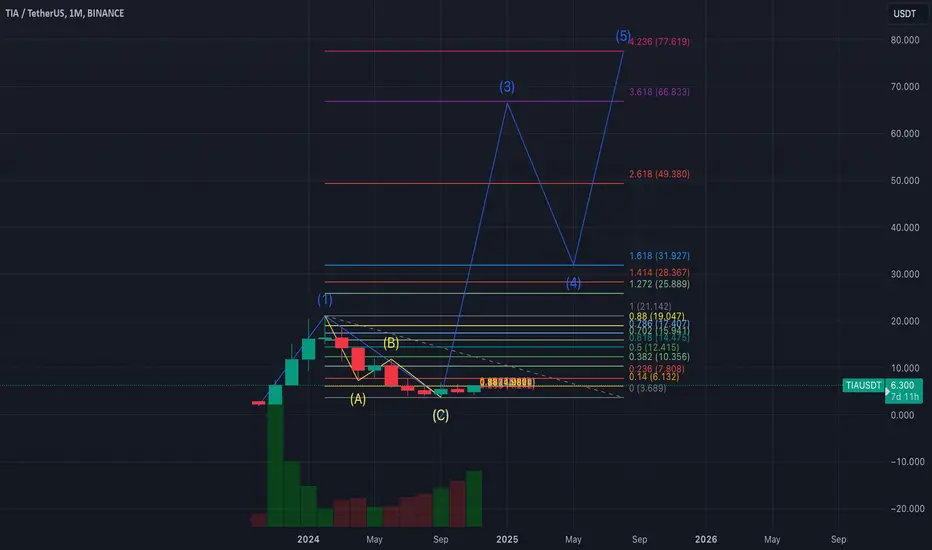
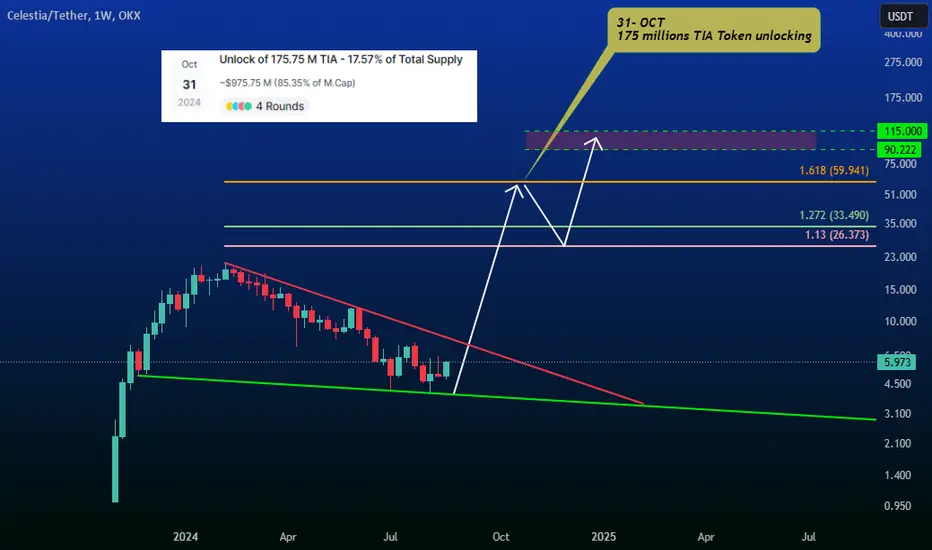
TIA to 100$🚀 TIA 🚀
close to breakout
$59 post-breakout target at Fib 1.618
before unlocking 175.75 millions LSE:TIA tokens
Expecting retracement to Fib 0.382 with a buyback,
then aiming for $90-$110 before selling unlocked supply
like + follow + repost = appreciation
#NFA
#DYOR
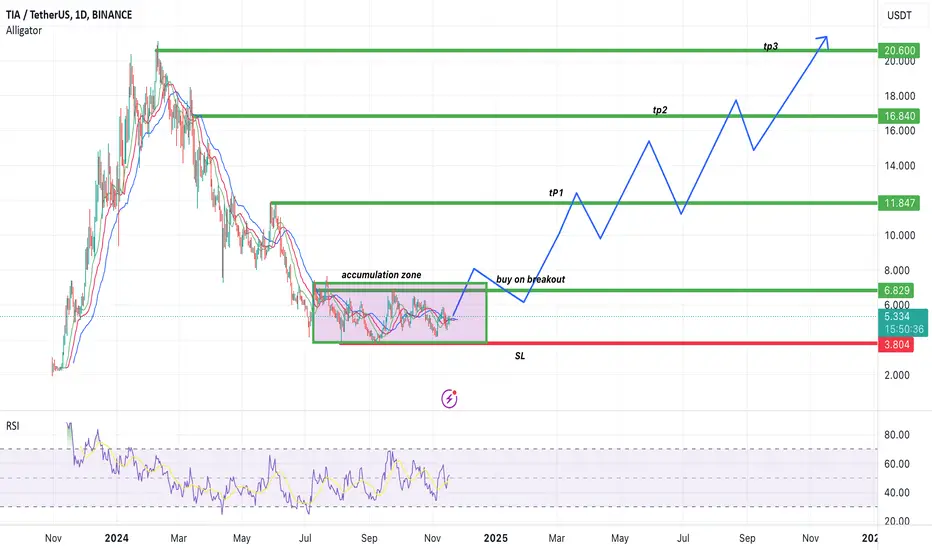
TIAUSDT Long term trade IdeaTIAUSDT is in accumulation zone since long time and expects a breakout at the mentioned point, possible target and SL are highlighted.
TIA IS ON OF TheM ( ALTSEASON ALERT )hello everyone
wish you best
Tia can make some targets as I drow in chart
you can enter now or wait for pull back and last confirmation
I WILL go riGHt now for next ALTSEASON from this coin
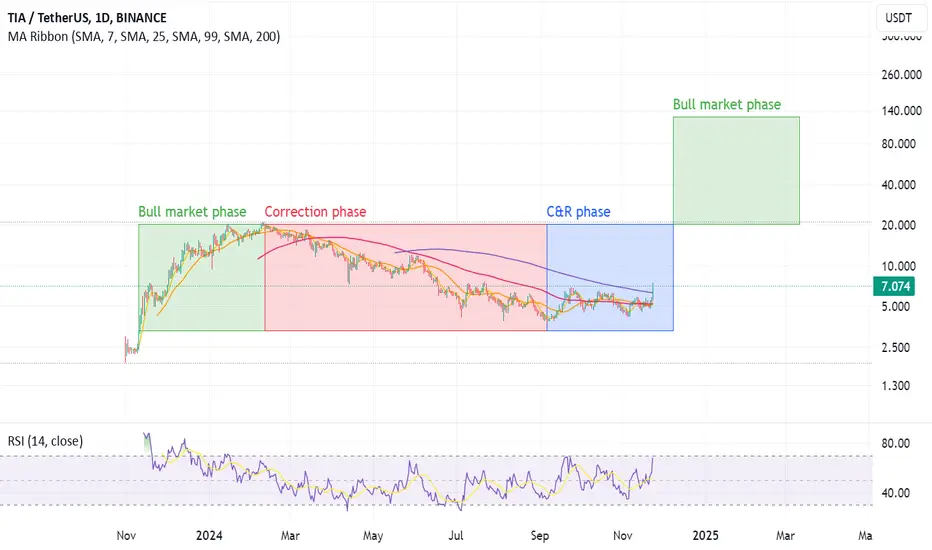
Consolidation and Recovery phase for TIA/USDTBINANCE:TIAUSDT has entered Consolidation and Recovery (C&R) phase.
which should last upper till it reaches previous ATH, if cross it, then it will enter new BULL run phase.
P.S.: When you get rich with my analysis, don't forget to thank me to my wallet, I will appriciate it.
P.S.S.: DYOR.
TIA´s monster short squeeze setup- TIA is an unique coin in the sense that it was a heavy overperformer in the latter part of Q4 last year but has since then known nothing but downside
- with 82% from its ATH it is safe to say TIA´s bottom is in however due to the nature of the correction there is reason to believe that the upwards move from this bottoming base will be extremely violent, near vertical
- 5D RSI is incredibly constructive with a clear inverse head and shoulders formation alongside 5D stoch momentum turning up

TIAUSDT Breaks Resistance: Strong Bullish Move AheadTIAUSDT Technical analysis update
TIAUSDT has been consolidating for the past 160 days, repeatedly testing the trend resistance line. Today, the price broke above the resistance line on the daily chart and crossed above the 100 EMA. A strong bullish move is anticipated in the coming days.
Buy zone : Below $6.30
Stop loss : $5.32
Take Profit 1: $7.10
Take Profit 2: $8.50
Take Profit 3: $11.85
TIATIA / USDT
After long correction period and another 5 months accumulation many people lost confidence in TIA but it finally brokeout
Its flying above our entry by 24% but looking at chart its just brokeout and long Journey still ahead
Best of wishes
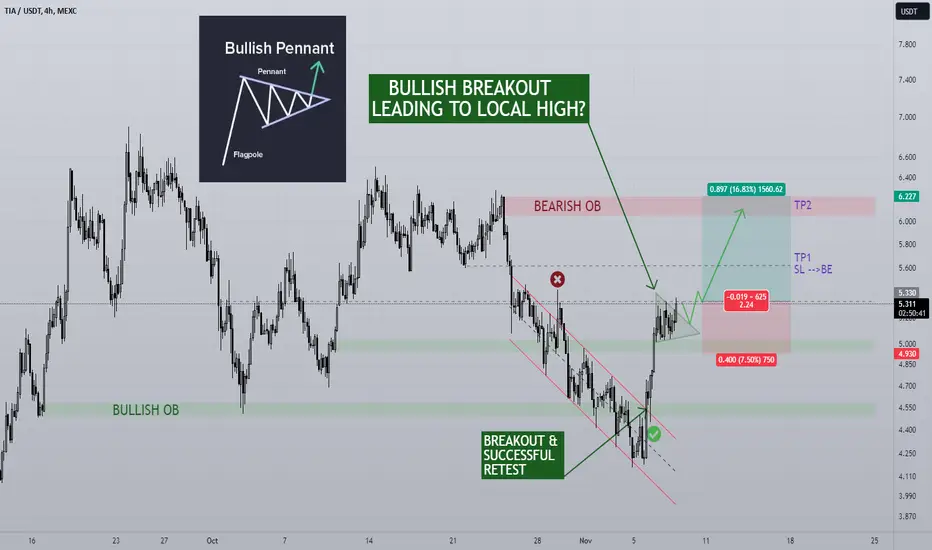
TIA/USDT 4H Celestia is a project that has a lot of potential this Bullrun, we saw an early surge in the beginning of the year once the project was released nearly one year ago. A modular blockchain network, first of its kind is an exciting new technology and we've seen how well new projects do during their first Bullrun often outperforming their older rivals.
I would like to see the bullish pennant formation playing out now. The bearish downtrend breakout caused by a republican victory results in a breakout & retest of the BULLISH OB as new support. Now a bullish pennant has formed midway up the mini range, normally this is a continuation pattern and with the bullish narrative in play I think it's probable we see this pattern play out fully with the resulting rally hitting resistance around the $6 mark (BEARISH OB).
IF deciding to take the trade once the parameters are met a conservative 2.25R trade is in play , once the first TP is hit the larger SL can be moved to Break Even . I do believe that TIA continues to move beyond the $6 mark however there is a lot of resistance there for now. A separate trade outlook will be needed to tackle that area.
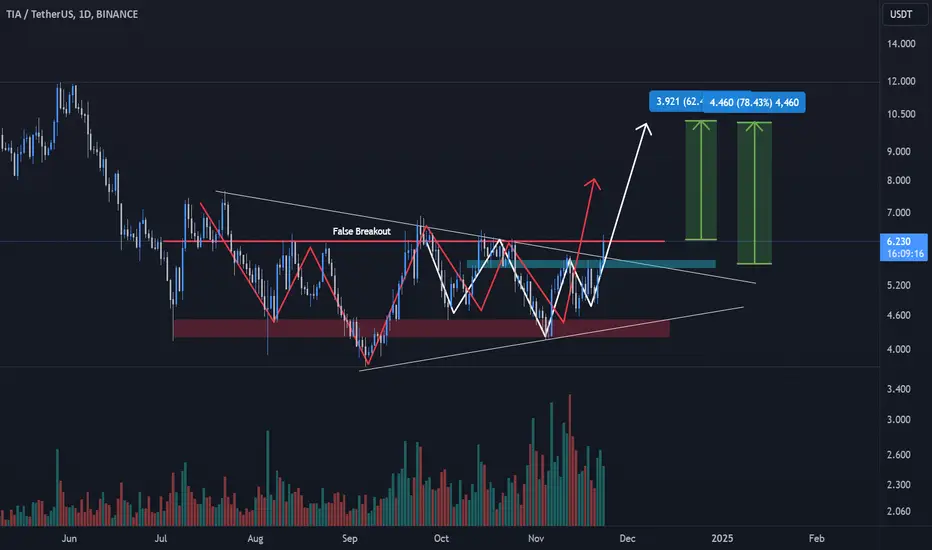
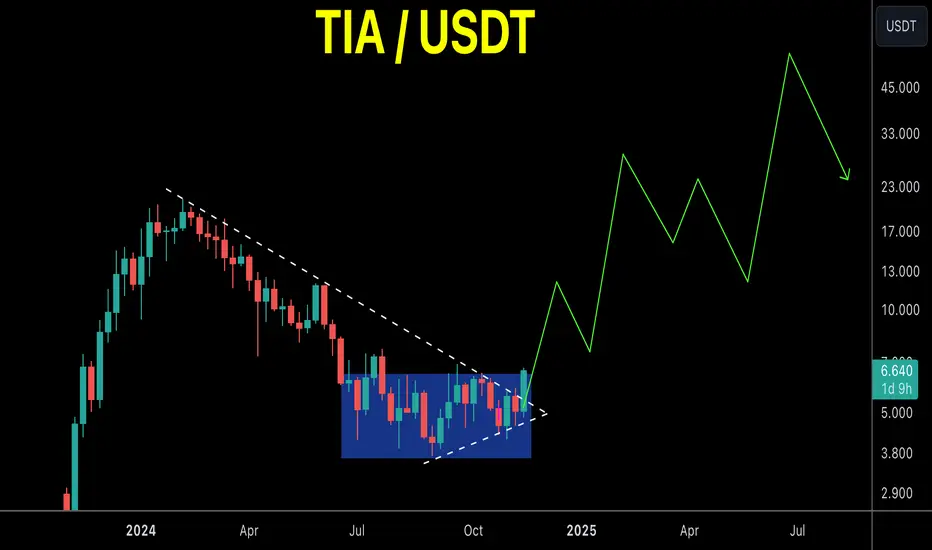
TIA USDTToo great to be ignored. This time sorry the chart is a bit messy, but there are more than one POV that could give you the conviction why the only way is up from now on.
The red lines indicates a complex Inverse Head and Shoulder pattern featuring many retests on the shoulder part and even false breakout happened in the process.
The white lines could be seen as again another Inverse Head and Shoulders.
Finally, it can also be seen as a triangle breaking out from the range. The ideal range is to bid is at the blue box if the trend allow us to do so. Consider start your entry multiple times along the trend to have optimal average.
Based on the flow in the market, you can see all its peers has gained crazy momentum of more than 20% recently. Do you think TIA will fall behind or following the footsteps. Let's share the ideas in the comments. Appreciate it.