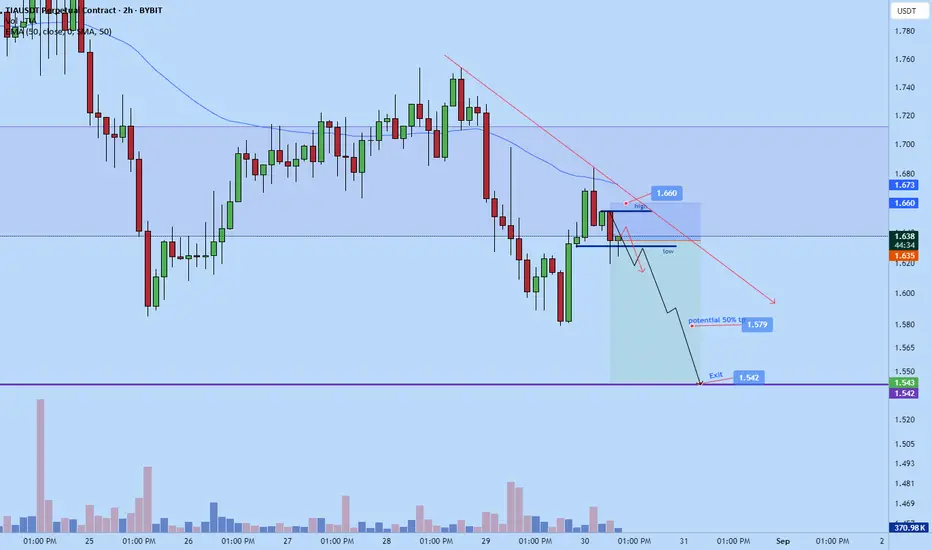
Celestia short to $1.542sl: 1.660
tp: 1.542
I think the market will continue down soon. Might correct up a little bit more but overall I think it's likely we we'll make new lows.
Related pairs
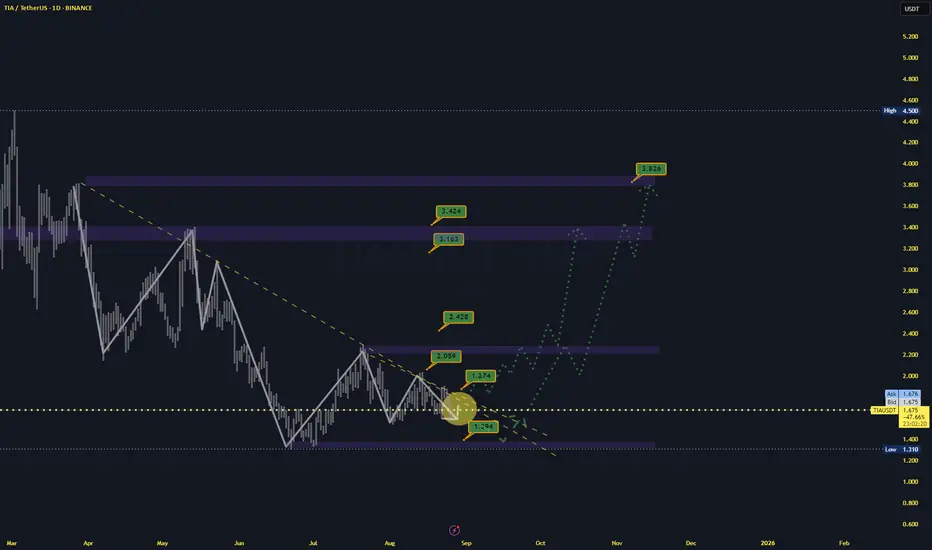
TIA/THETHER Bullish till canceledI am very bullish on this pair.
Tia has rejected the strong support, and the bulls are accumulating, also volume and vp rising.
The first profit target will be 1.64.
If breaking above the following profit targets will be:
2.059
2.42
3.163
3.423
3.826
I notoce many touches of the trend line,that
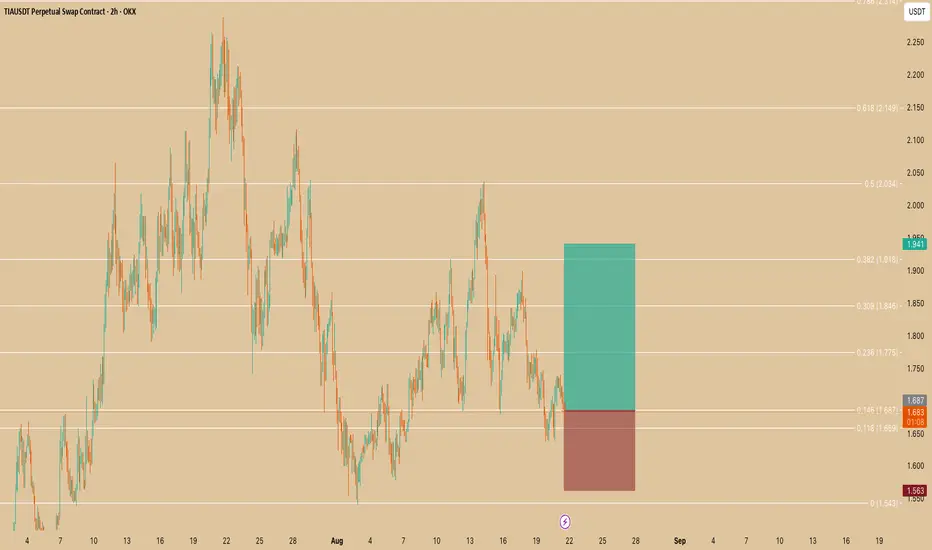
TIA/USDT (Perpetual Swap on OKX)📝 Trade Setup Explanation
Pair: TIA/USDT (Perpetual Swap on OKX)
Timeframe: 2H (2-hour chart)
Indicators/Tools Used: Fibonacci retracement, support/resistance levels, risk-to-reward (RR) box
📊 Technical Breakdown
Fibonacci Levels:
The chart shows a pullback near the 0.146 (1.687) level.
Price is hol
TiausdtVolatility may be high in the short term; I believe the news coming on Wednesday and Friday will add volatility to the market. It is recommended that you follow the trade with stop limits and risk analysis in mind, and without using high leverage.
TIAUSDTwe are experiencing last falling and whole charts going to weekly idm and fvg and mitigation block triple. So i am expecting manupilation for usdt.d you can look that chart. i shared also i put my buy order specified levels on char. Good luck..
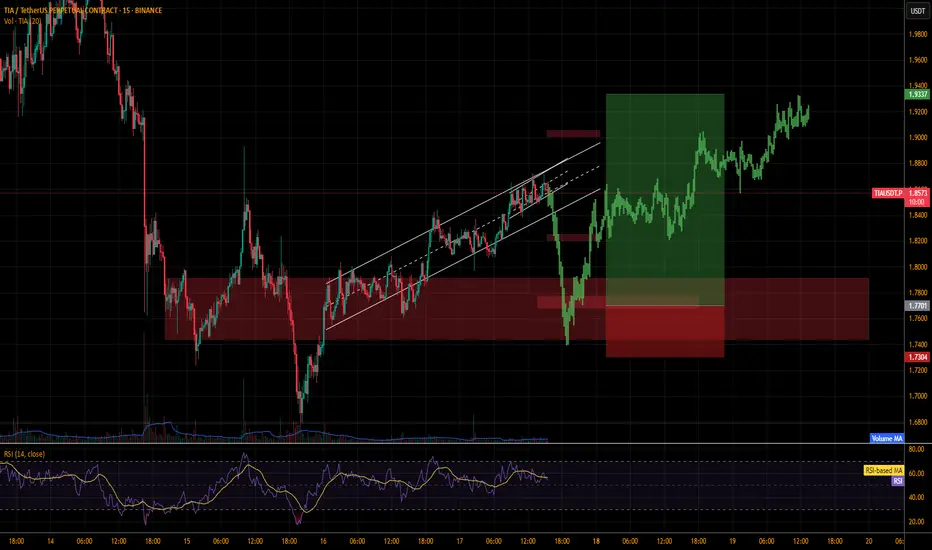
TIAUSDT.PIm expecting the price to move according to the previous pattern.
The price is consolidating at the moment in the parallel channel as you can see.
It might just go up directly but we are traders not gamblers we will trade it not just jump in and try the luck..
Traders always have a certain level
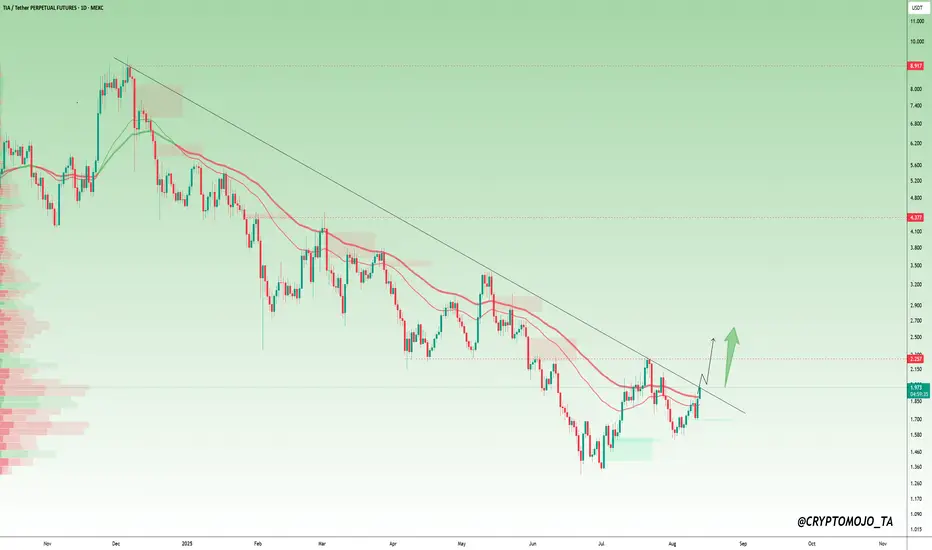
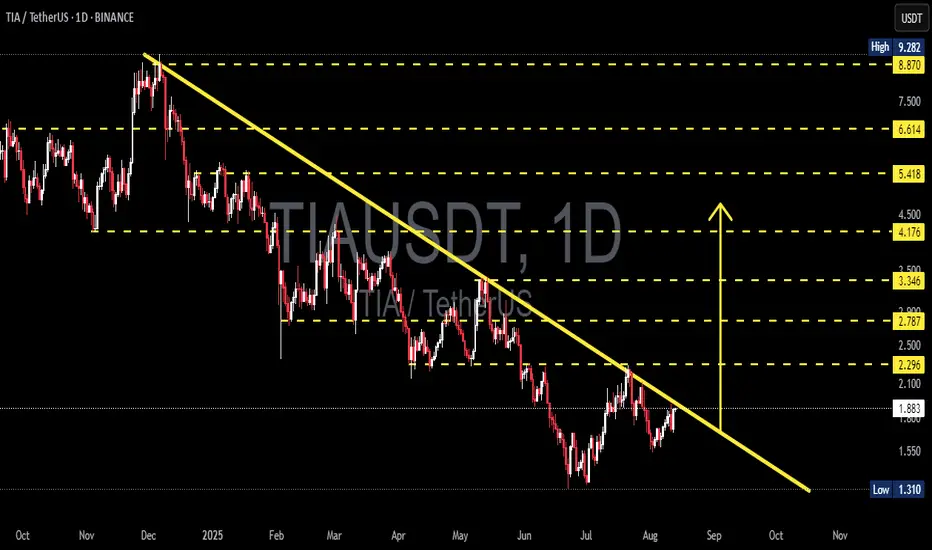
$TIA is trying to break the downtrend!LSE:TIA is trying to break the downtrend!
Price is pushing above the trendline after a long downtrend.
If TIA holds above $1.95, it could target $2.25 next. A successful breakout may lead to a strong move up.
If it fails to hold, it may retest lower supports.
DYOR, NFA
#Altseason2025
TIA momentum crazy good!!!Just several pips to go. And surely it will be in this market situation and TIA will go super quick to 3usd minimum super easy and super quick!
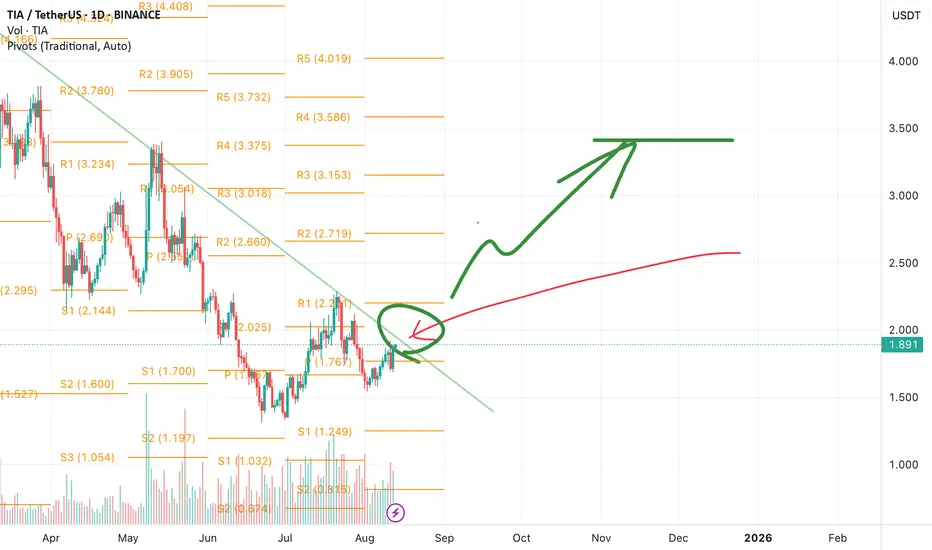
TIA/USDT Testing Downtrend Line: Reversal or More Downside?Summary:
TIA price remains below the main descending trendline (yellow) drawn from the Dec–Jan peak. Price is currently hovering around $1.87–$2.00, right under the key $2.00–$2.10 resistance zone and the trendline. This is a decision zone: a breakout could trigger a reversal, while rejection could
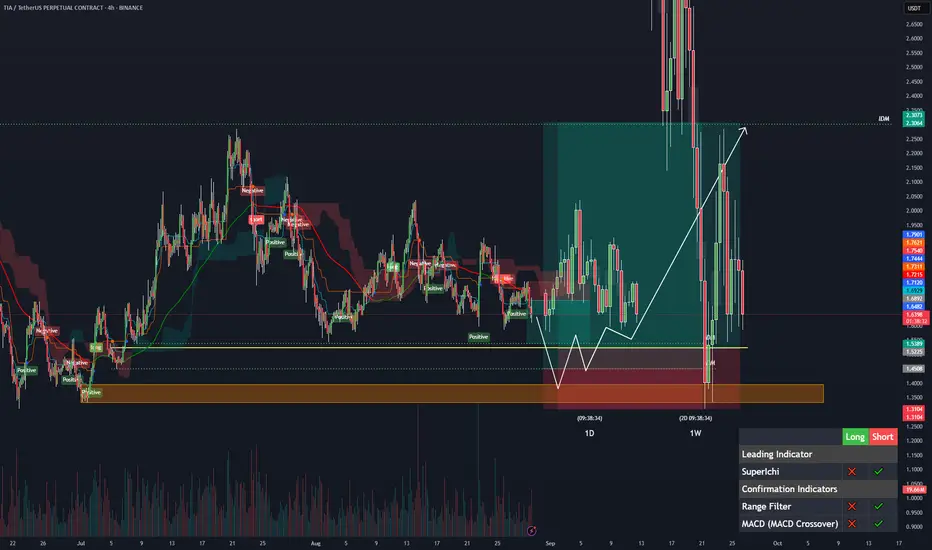
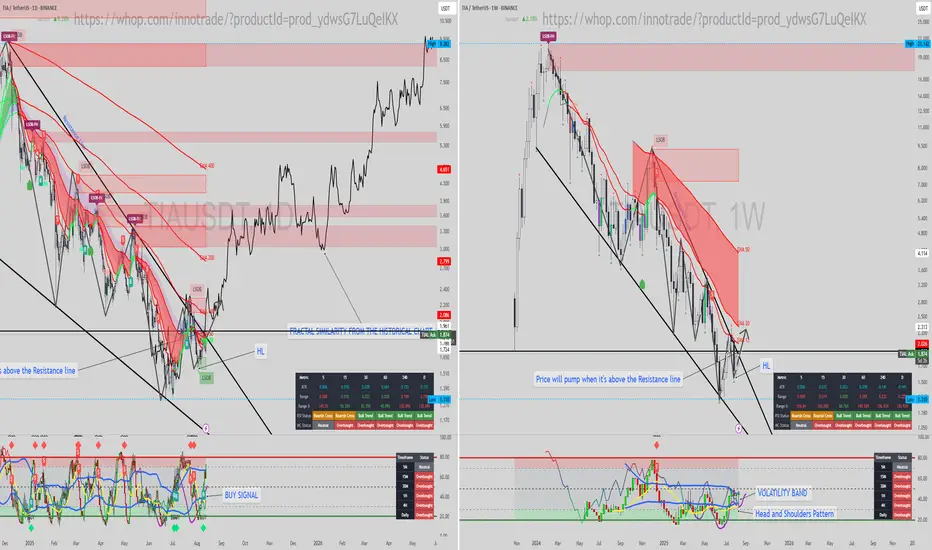
TIA/USDT: Bullish Patterns Emerge at Key ResistanceSUBSCRIBE, BOOST AND COMMENT IN ORDER TO GET HIGH QUALITY TECHNICAL ANALYSIS.
Firstly, our Algo-based indicators are used to create this analysis.
Daily (1D) & Weekly (1W) Analysis:
TIA/USDT has been in a sustained downtrend, but price is now tightening within a classic bullish pattern, su
See all ideas
Summarizing what the indicators are suggesting.
Oscillators
Neutral
SellBuy
Strong sellStrong buy
Strong sellSellNeutralBuyStrong buy
Oscillators
Neutral
SellBuy
Strong sellStrong buy
Strong sellSellNeutralBuyStrong buy
Summary
Neutral
SellBuy
Strong sellStrong buy
Strong sellSellNeutralBuyStrong buy
Summary
Neutral
SellBuy
Strong sellStrong buy
Strong sellSellNeutralBuyStrong buy
Summary
Neutral
SellBuy
Strong sellStrong buy
Strong sellSellNeutralBuyStrong buy
Moving Averages
Neutral
SellBuy
Strong sellStrong buy
Strong sellSellNeutralBuyStrong buy
Moving Averages
Neutral
SellBuy
Strong sellStrong buy
Strong sellSellNeutralBuyStrong buy
Displays a symbol's price movements over previous years to identify recurring trends.
Frequently Asked Questions
The current price of Celestia / Tether (TIA) is 1.5804 USDT — it has risen 1.80% in the past 24 hours. Try placing this info into the context by checking out what coins are also gaining and losing at the moment and seeing TIA price chart.
Celestia / Tether price has fallen by −2.02% over the last week, its month performance shows a −0.90% decrease, and as for the last year, Celestia / Tether has decreased by −62.63%. See more dynamics on TIA price chart.
Keep track of coins' changes with our Crypto Coins Heatmap.
Keep track of coins' changes with our Crypto Coins Heatmap.
Celestia / Tether (TIA) reached its highest price on Feb 10, 2024 — it amounted to 21.1365 USDT. Find more insights on the TIA price chart.
See the list of crypto gainers and choose what best fits your strategy.
See the list of crypto gainers and choose what best fits your strategy.
Celestia / Tether (TIA) reached the lowest price of 1.0000 USDT on Oct 31, 2023. View more Celestia / Tether dynamics on the price chart.
See the list of crypto losers to find unexpected opportunities.
See the list of crypto losers to find unexpected opportunities.
The safest choice when buying TIA is to go to a well-known crypto exchange. Some of the popular names are Binance, Coinbase, Kraken. But you'll have to find a reliable broker and create an account first. You can trade TIA right from TradingView charts — just choose a broker and connect to your account.
Crypto markets are famous for their volatility, so one should study all the available stats before adding crypto assets to their portfolio. Very often it's technical analysis that comes in handy. We prepared technical ratings for Celestia / Tether (TIA): today its technical analysis shows the sell signal, and according to the 1 week rating TIA shows the sell signal. And you'd better dig deeper and study 1 month rating too — it's sell. Find inspiration in Celestia / Tether trading ideas and keep track of what's moving crypto markets with our crypto news feed.
Celestia / Tether (TIA) is just as reliable as any other crypto asset — this corner of the world market is highly volatile. Today, for instance, Celestia / Tether is estimated as 3.04% volatile. The only thing it means is that you must prepare and examine all available information before making a decision. And if you're not sure about Celestia / Tether, you can find more inspiration in our curated watchlists.
You can discuss Celestia / Tether (TIA) with other users in our public chats, Minds or in the comments to Ideas.