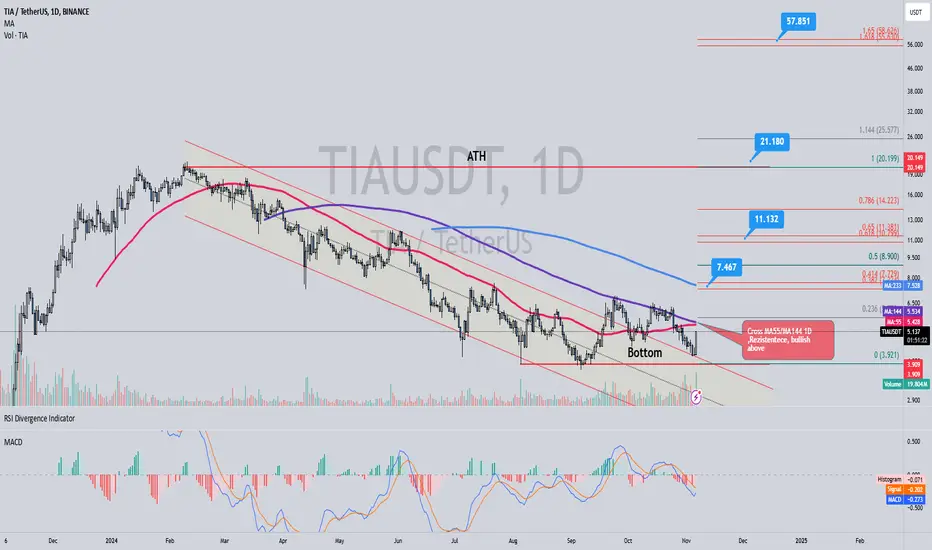
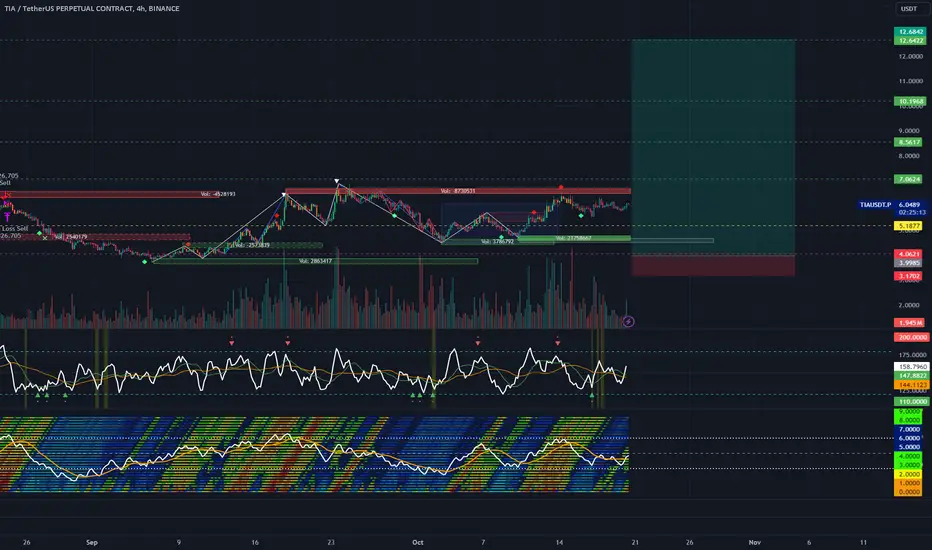
TIAUSDTOn the TIAUSDT chart, we observe a descending parallel channel that has been recently retested 📉, indicating potential price consolidation. MA55 and MA144 are close to forming a bullish cross 🔄, suggesting a possible upward impulse 📈. The next significant resistance is at the confluence of MA233 and the Fibonacci 0.382 level 📊, which could influence the future price direction. Monitoring these levels closely is essential for anticipating upcoming market moves 👀.
I am currently long on this setup 🚀.
TIAUSDT trade ideas

Doomsday Coming for $TIASummary:
The LSE:TIA market is on the brink of a significant downturn as market makers and exchanges prepare to hunt shorters before the impending selling pressure becomes unmanageable. With a lack of regulations, the environment is ripe for manipulation, and the sharks are circling, ready to capitalize on the blood in the water.
---
Key Points:
1. Current Market Dynamics:
- The circulating supply of LSE:TIA is 218.41 million, with a staggering 80.85% (175 million) of that supply set to unlock soon. This is a critical moment for traders, as the potential for inflation is imminent.
2. Pending Undelegation:
- An additional 17.5% (37.6 million) is pending undelegation. Keep in mind that unbonding takes 21 days , and many savvy traders are looking to front-run the unlock, which could exacerbate the selling pressure.
- For detailed undelegation statistics, refer to the analysis on smartstake.
3. Misleading Information:
- There is a lot of misinformation circulating, with some traders claiming that the upcoming unlock is bullish. This is clearly not the case.
- WARNING: Do not listen to those who are promoting this narrative! Many of them may be affiliated with market makers or large LSE:TIA stakeholders who are hoping to offload their assets before a potential crash.
4. Upcoming Unlocks:
- There are many significant unlocks but here are three of them on the horizon, with millions of dollars worth of LSE:TIA expected to be sold just before the cliff unlock.
- For verification, check smartstake.
---
Conclusion:
The situation surrounding LSE:TIA is precarious, and traders should be cautious. The combination of significant unlocks, pending undelegation, and the potential for market manipulation suggests that a downturn is imminent. Stay informed and make decisions based on solid analysis rather than hype.
**Disclaimer:** This is not financial advice. Always do your own research before making investment decisions.

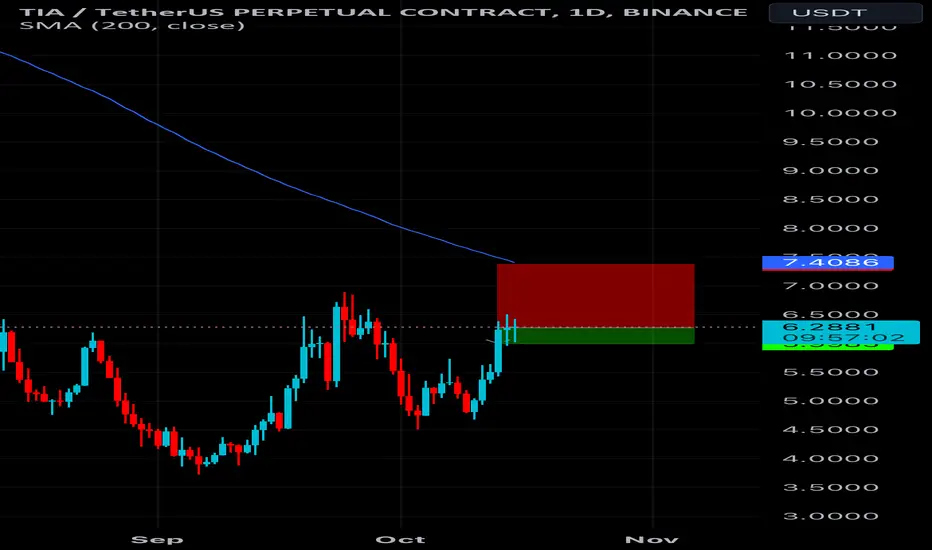
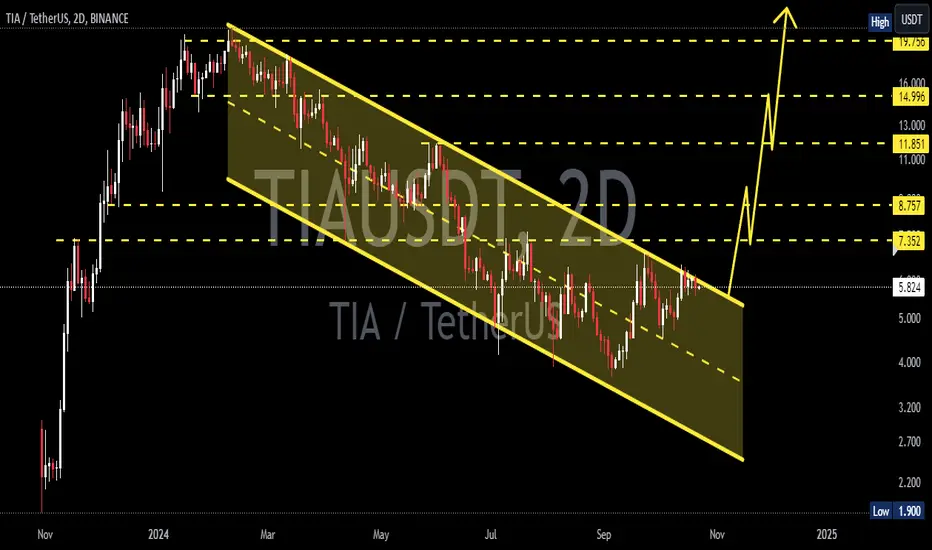
Has $TIA already bottomed after its major unlock?A recent release of 175 million TIA raises the question: will it follow ARB’s pattern post-unlock?
ARB initially showed stability but gradually declined, eventually reaching a local bottom before reversing into a bull run.
Currently, TIA is retesting its horizontal support level.
If we hold above $4.60, I expect it to push toward $5, which remains to be the local resistance.

Tia Looking Ready For Some Recovery After Token Unlock seems like tia finally getting ready for recovery after big token unlock
falling wedge breakout and retest has already confirmed expecting recovery towards 6.50%$ incoming days

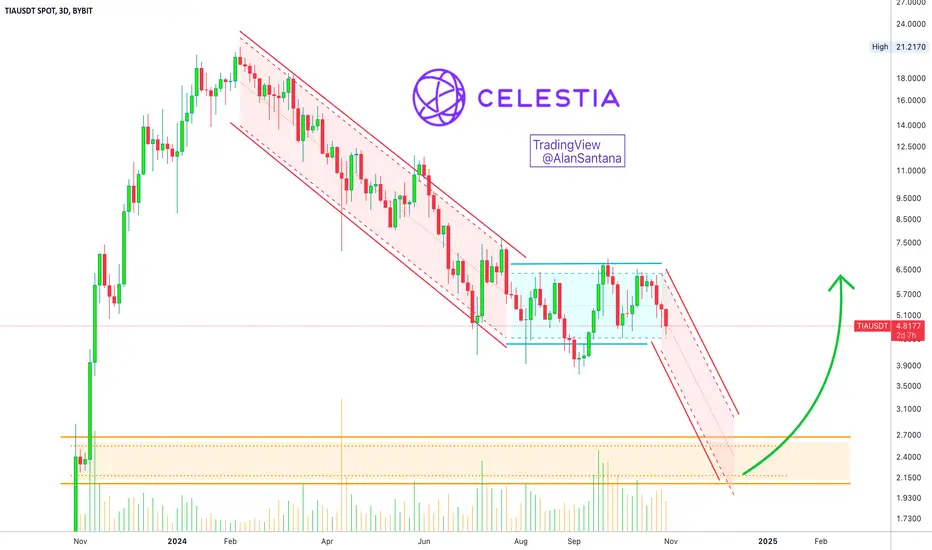
Celestia Potential 50% Drop In The Making...Here we have a classic sequence. TIAUSDT (Celestia) starts a descent after a major bullish wave. The descent stops momentarily and produces a period of consolidation (blue), the consolidation leads to one final drop.
The second and final drop will be much smaller in size and duration compared to the first drop. Trading volume will be lower.
The next support and logical level sits between $2.08 and $2.65. Between $2.20 and $2.48 to be more exact. This is the level where TIAUSDT consolidated a little bit back in November 2023 before a massive bullish run. The same level that worked as resistance will now be tested as support, another classic.
If this support levels holds, we should see some consolidation around it together with strong volatility and then maximum growth. This would produce a v shaped bottom, or something of that nature.
In short, we will see a final drop before the market turns.
Namaste.
TIAUSDT UNLOCK 31OCT 79.6% Target SetupTIAUSDT UNLOCK 31OCT 79.6% Target Setup In 930m so hopefully to be greatest dump

TIA after Coin-Unlock possibilityTIA will have a big unlock at the end of the october. There is a high chance of a big sell off due to almost 2x the supply and less demand. Because early investors could start selling big the price could fall to its start prices. It's also possible that the correction already appeared due to the news and nothing much happens.
We will see

Celestia $TIA is ready to spark an upside trajectoryBeautiful triangle being formed with Higher Lows and Lower Highs.
Chart is self explanatory. Daily timeframe is used, meaning it might take some days to start accumulating momentum. IMO the token unlock is priced in, as major support at ~5 USD was retested in a single day candle.
Let's see how that goes.
*This is not an investment advice, just my personal analysis.
Good luck.

TIA break-out
TIA is breaking out its trendline with a good green candle.
Setup is proposed as in chart.
Disclaimer:
This analysis is based on my personnal views and is not a financial advice. Risk is under your control.

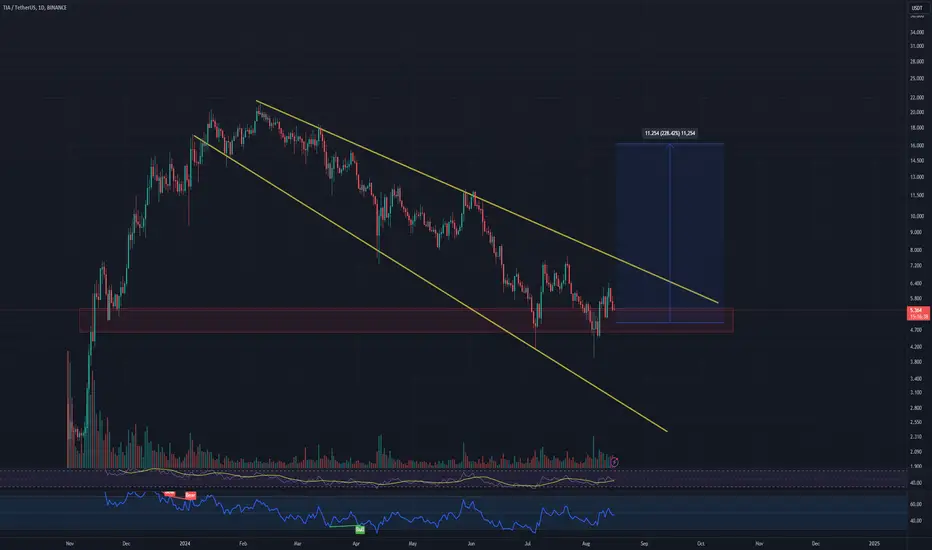
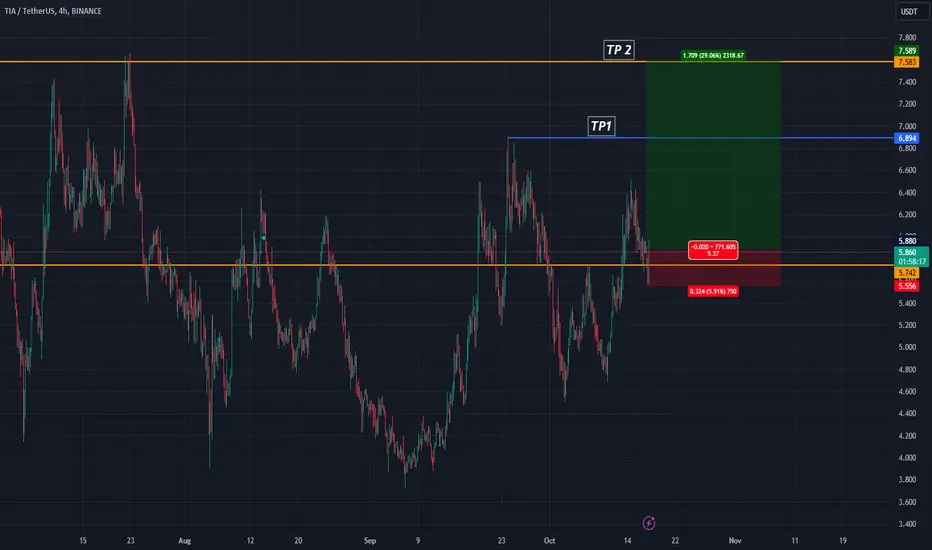
#TIA 's Explosive 228% Growth – Are You Ready for This Move?#TIA #TIAUSDT is setting up for a potential breakout from its descending channel on the daily chart. Currently priced at $5.361, the chart indicates a possible surge to the $11.254 level, translating to an impressive 228.42% gain. With the price nearing a critical support level, traders should keep a close watch for a bullish reversal that could offer substantial returns!
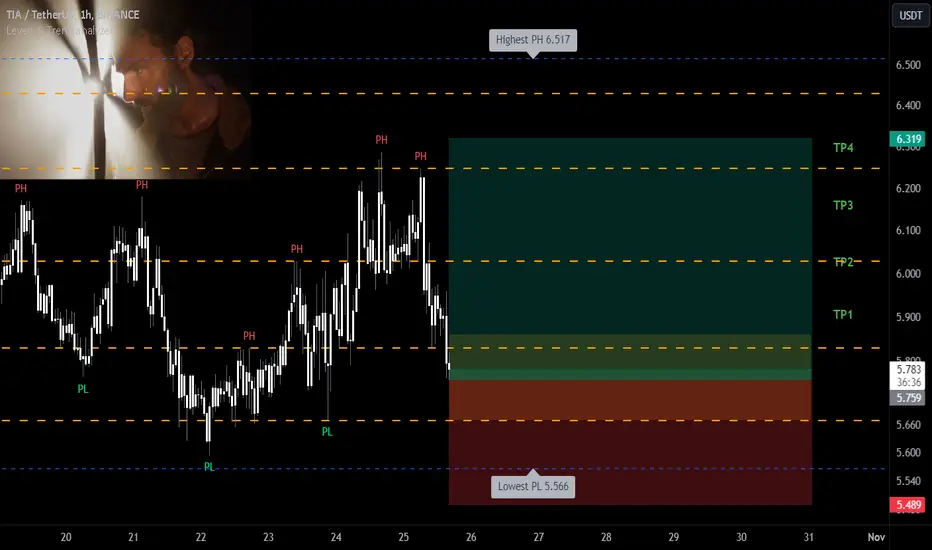
TIAUSDT Long Setup Setting / Levels are on the ChartBINANCE:TIAUSDT
COINBASE:TIAUSD
📈Which side you pick?
Bull or Bear
SL1 ---> Low-risk status: 3x-4x Leverage
SL2 ---> Mid-risk status: 5x-8x Leverage
(If there is just one SL on the chart, I suggest, low risk status)
👾Note: The setup is active but expect the uncertain phase as well. also movement lines drawn to predict future price reactions are relative and approximate.
➡️Entry Area:
Yellow zone
⚡️TP:
5.90
6.02
6.16
6.31
🔴SL:
5.489
🧐The Alternate scenario:
If the price stabilize against the direction of the position, below or above the trigger zone, the setup will be canceled.
Tia 5R long & 9R shortLong trigger if we make HH on daily, flip and hold 6.24 (significant fib level), btc bullish.
Short trigger if we don't make HH on daily, fail to break 6.24, btc bearish

Celestia Prepares for Token Unlock Amidst Market AnticipationCelestia ( LSE:TIA ), the first modular blockchain network, is on the brink of a major token unlock, scheduled for October 31, 2024. The blockchain world is buzzing with anticipation as this event could propel LSE:TIA into a breakout scenario. With 175.74 million TIA tokens worth an estimated $175.74 million set to be unlocked, representing 16.30% of its total supply, the market is watching closely for price movement and volatility.
The Unlock Details
The upcoming token unlock comprises four key allocations:
- Cliff Unlock
- Seed Round: 52.47M TIA worth $302.28M
- Initial Core Contributors: 58.08M TIA worth $334.6M
- Series A & B: 65.01M TIA worth $374.52M
- Linear Unlock:
- R&D & Ecosystem: 182,240 TIA worth $1.05M
These allocations are expected to drive significant liquidity into the market. Historically, token unlock events can lead to increased volatility, and many are predicting that LSE:TIA will experience heightened trading activity in the coming days.
Celestia’s Unique Value Proposition
At its core, Celestia is a modular blockchain designed to enable developers to easily deploy their own blockchains with minimal overhead. It redefines blockchain scalability by decoupling execution from consensus and introducing a novel primitive: data availability sampling. This groundbreaking architecture allows developers the freedom to create custom execution and settlement environments, unlocking a wide range of possibilities for blockchain development.
Since its Mainnet Beta launch in October 2023, Celestia ( LSE:TIA ) has made waves in the blockchain space, with the first 20 rollup chains deployed and Celestia data blobs accounting for over half of the total data published by rollups. The network’s modular design allows it to scale block space beyond the constraints of monolithic Layer 1 (L1) blockchains, where applications typically share a single execution layer.
With Celestia, developers aren’t limited by smart contract languages, virtual machines, or even rollup frameworks. This flexibility has the potential to supercharge innovation, whether in scaling existing ecosystems like Ethereum or building sovereign blockchain networks from scratch.
$100 Million Raise and Future Vision
Last month, the Celestia Foundation secured $100 million in funding, led by Bain Capital Crypto with participation from Syncracy Capital, 1kx, and others. This brings Celestia’s total funding to $155 million, marking significant confidence in its future.
Celestia’s core developer community recently announced an ambitious technical roadmap aimed at scaling block space to 1-gigabyte blocks, promising a huge increase in data throughput for its rollup ecosystem. This move positions Celestia to potentially deliver throughput on par with (or exceeding) legacy systems like Visa’s 24,000 transactions per second (TPS), with the capacity of many Visa networks operating simultaneously.
According to Mustafa Al-Bassam, co-founder of Celestia, "When Celestia launched last year as the first modular data availability layer, it scaled blockspace from the dial-up era to the broadband era. Now, the core developers have introduced the technical roadmap to scale blockspace to the fiber optic era - while keeping it verifiable and low latency."
Technical Analysis: A Bullish Breakout on the Horizon?
From a technical perspective, LSE:TIA is currently priced at $5.878 up by 1.69%, but down significantly from its all-time high of $20. Despite the price correction, LSE:TIA remains a blue-chip investment in the blockchain space, even amidst some concerns about transparency. The daily price chart shows the formation of a falling wedge pattern, often considered a bullish reversal signal.
With the upcoming token unlock, traders should prepare for increased volatility. A positive market response could push LSE:TIA past the resistance ceiling of the wedge pattern, potentially triggering a rally toward the $10 mark. However, it is essential to remain cautious, as token unlock events often bring significant price fluctuations.
The Relative Strength Index (RSI) for LSE:TIA sits at 52, indicating that while momentum is weak, there is room for growth if buying pressure intensifies. The token is currently trading well below its key moving averages, further highlighting the possibility of a breakout if market sentiment shifts in its favor.
Conclusion
Celestia ( LSE:TIA ) is poised for a breakout, with its upcoming token unlock event likely to trigger heightened activity in the market. Backed by its innovative modular blockchain design, $100 million in recent funding, and a growing developer ecosystem, Celestia is well-positioned to redefine blockchain scalability.
However, as with any token unlock, caution is warranted. The market will be closely watching how LSE:TIA responds to the influx of unlocked tokens. If sentiment remains positive, LSE:TIA could see a surge in value, possibly making a run toward $10. Traders and investors should keep an eye on key technical indicators, as the next week could be pivotal for $TIA.

TIAUSDTTIA ~ 2D
#TIA for now it is trying to break out this descending pattern.
if you have Conviction on this coin,. Make purchases in stages from here.
long setup $TIAtia was a little bit choppy butt if you take a close look it printed a patter (cup and handle) i assume this will play out en even go higher as the profit target.
this is my setup for it.
CHEERS!
TIA USDTLooking at the chart, we can see that price action shows signs of potential consolidation around $5.69. I anticipate a higher low forming above $5.250. This would confirm bullish momentum and pave the way for a breakout.
A significant resistance zone in Green is situated around $6.782 to $7.317. A successful breakout above this zone would likely lead to a strong upward move, targeting the next key resistance around $11.93. Therefore, a breakout above the Green Zone would likely project the price toward the $11.930 mark. Keep an eye on how the price interacts around $5.25–$5.69 for confirmation of a higher low before the upward move.

TIAUSDT in ending diagonal formationTIAUSDT has experienced a significant downtrend, and there is strong reason to believe that this downtrend might be approaching a key zone.
We anticipate a potential ending diagonal formation, with the chart detailing all possible wave movements.
The final target of the principal pattern, which led to the last major drop—a bearish flag—presents a promising accumulation zone for the coin.
Enjoy the analysis, and let us know your thoughts on this coin.

Quant Model PredicationWorking on integrating my current predictive model with a few tools put together on trading view, currently the setup is predicting a massive rally for this asset with it practically doubling in price by the first week of November.
bullish TIA after accumulation 🚀🚀🚀🚀🚀
falling wedge
4.700-5.570 as an entry area
bullish TIA after accumulation

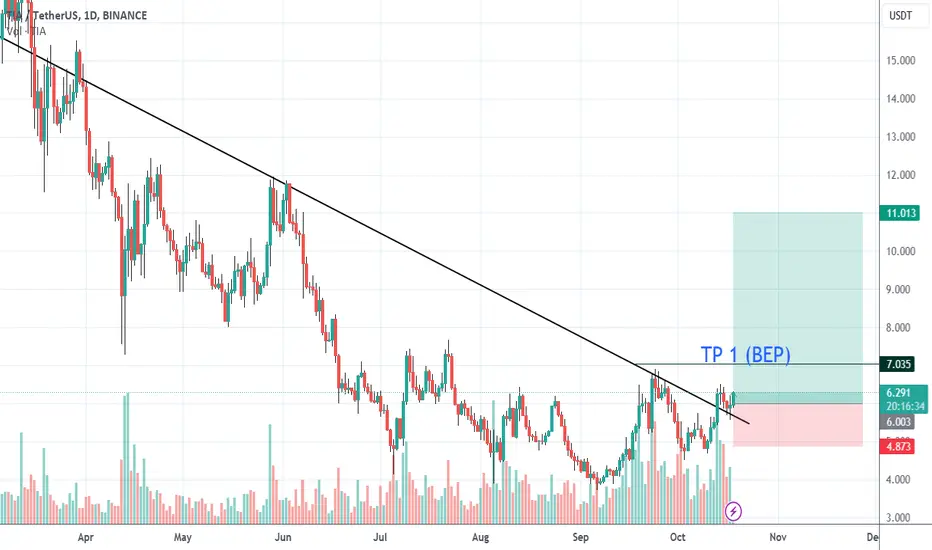
TIA to $11One of the key events shaping the conversation around TIA is the latest call highlighting a massive token unlock scheduled for October 30th, 2024.
This is expected to influence market dynamics and trigger shifts in price, as substantial amounts of tokens will be released into circulation.
The market currently sees TIA trading close to $4.9, with major targets set for $7, $9, and $11.
However, there are risks involved, with experts advising only a maximum 3% risk tolerance.
This token unlock has created an anomaly in the charts, with many investors and analysts closely watching how the market will respond.
As with many cryptos, significant unlocks often introduce volatility, which presents both opportunities and risks for traders and investors alike.
Celestia (Tia) price prediction in the coming months.#Tia has been down trending for 253 days now, and has finally broke the Lower Highs showing that it's still alive. We are currently seeing that probably a consolidation phase will occur before a new rally starts and take us to 11.79$ by december which is the first resistance. We believe that Tia is gonna explode in the near future as all the altcoins. LIKE 👍, FOLLOW ✅, SHARE 🙌

SellOver pulled back, 1 in 1000 opportunity,putting 20% for 5% profit, in 1-5 days, we will see if I am right or not