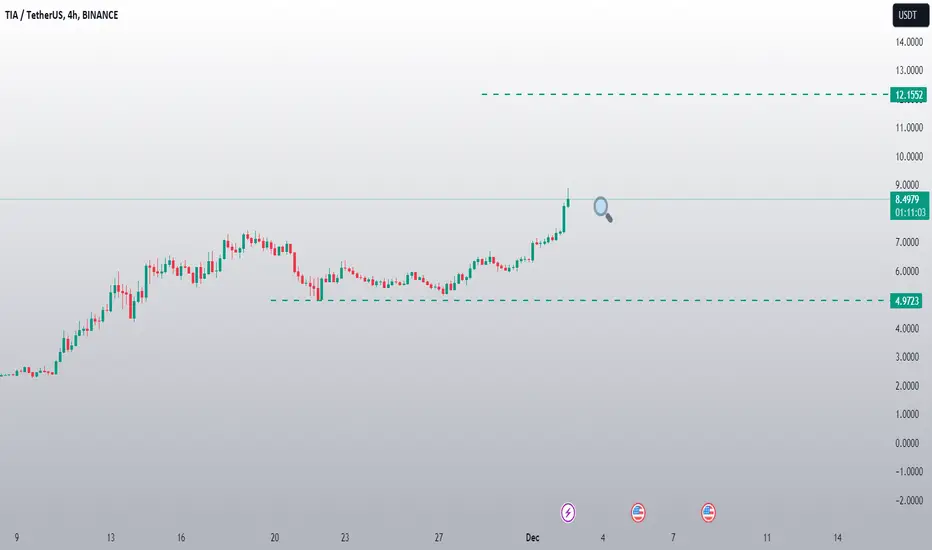
Tia Again 🤑Tia/USDT is showing promising signs. It looks like it's gearing up for a bullish move, and I anticipate the price to increase by 15-30% in the coming days. However, it's important to note that this is not financial advice, so please do your own research before making any decisions.
TIAUSDT trade ideas
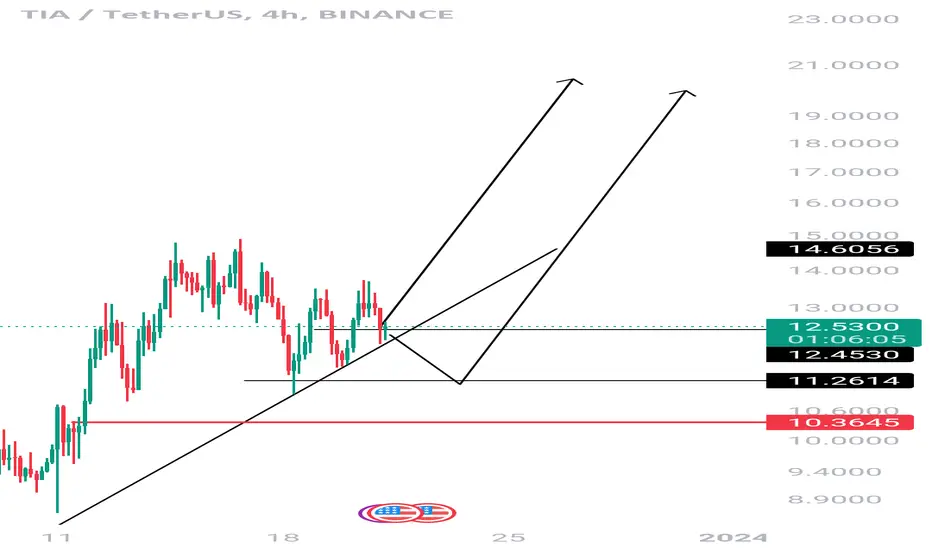
Tia - Decision Time
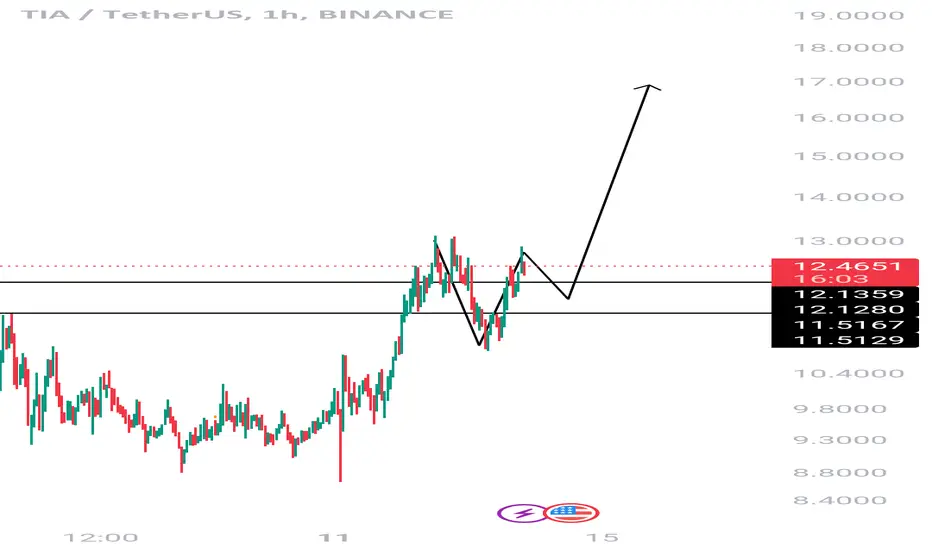
Here is an update to my last TIA post. On the 4H we are very close to breaking out of our symmetrical triangle. If we print a daily doji around $12.40 that could give us the signal that TIA is about to have a breakout higher instead of a breakdown.

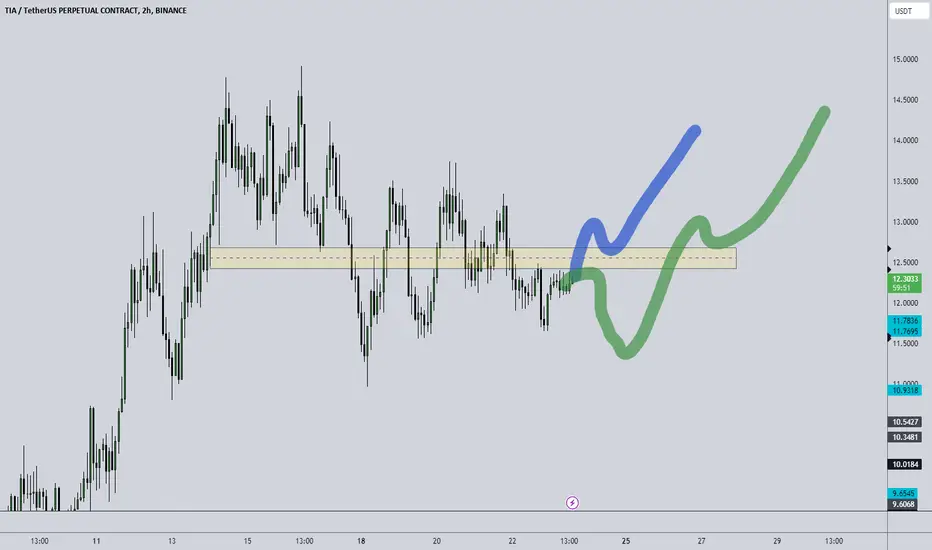
TIAUSDT - S/R FLIP1- carry on the sr area and then retrace the area back for the higher prices.
2- grab the lower liquidities and push for the sr area, again a small retrace and go.
Ethereum's hero #TIA#TIA, which set out to reduce fees on the Ethereum network and was very successful in this regard, will be the ALPHA of the 2024-2025 bull market. Every project that wants to do business on the Ethereum network must integrate with #TIA. Although the price may drop to 11 USD in the short term, the medium term price is 25 USD and the long term price is 150 USD. Since the number of long positions in the market is high, the price will be suppressed for a while.

what's up with TIA !? big move coming soon !?? i can see big move waiting in TIA !
break out & retest/consolidate is important .
depends of over all markets eg. DXY , US stocks and news etc.
_______________________________________________________________________________
⚠ I'm not a financial advisor; I'm learning trading just like you guys. I can't tell anyone what to do with their money, but I suggest, as a fellow trader, to use proper risk management to safeguard your funds and be wary of market manipulation (DYOR).

Tia long
BINANCE:TIAUSDT.P TIA/USDT
Signal Type: Long
Leverage: Cross 8x
Entry Targets: 12-11.78
Take Profit Targets
1) 12.23
2) 12.406
3) 12.586
4) 12.706
5) 12.886
Stop Loss: 11.65

Mock Up Price Action for TIA | Mid Term (12HR)Mock Up Price Action for TIA | Mid Term (12HR)
- Watching and waiting for opportunity to enter short

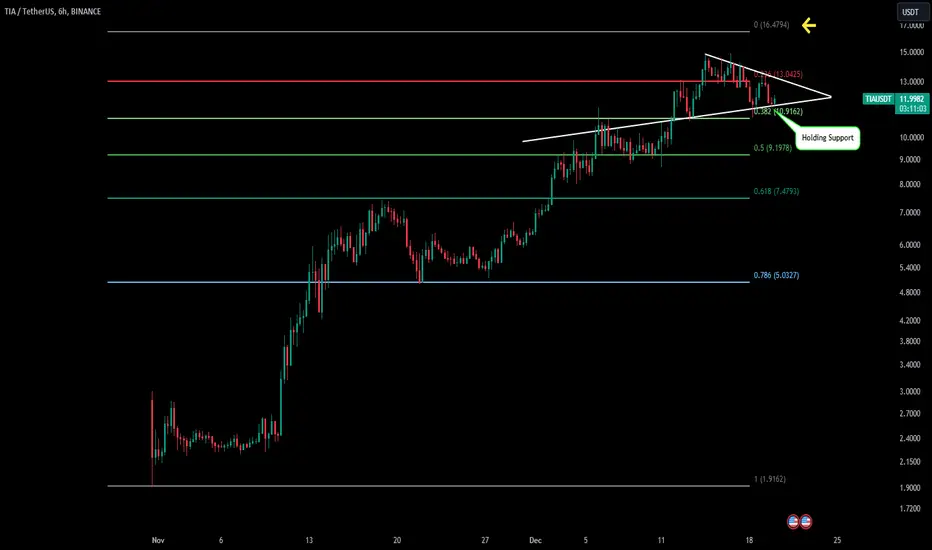
TIA - More Fuel in the Tank?Right now TIA is still holding support of our triangle pattern. If we are able to breakout of the pattern and continue price discovery I think TIA could reach around $16.50 based on predictive Fibonacci.
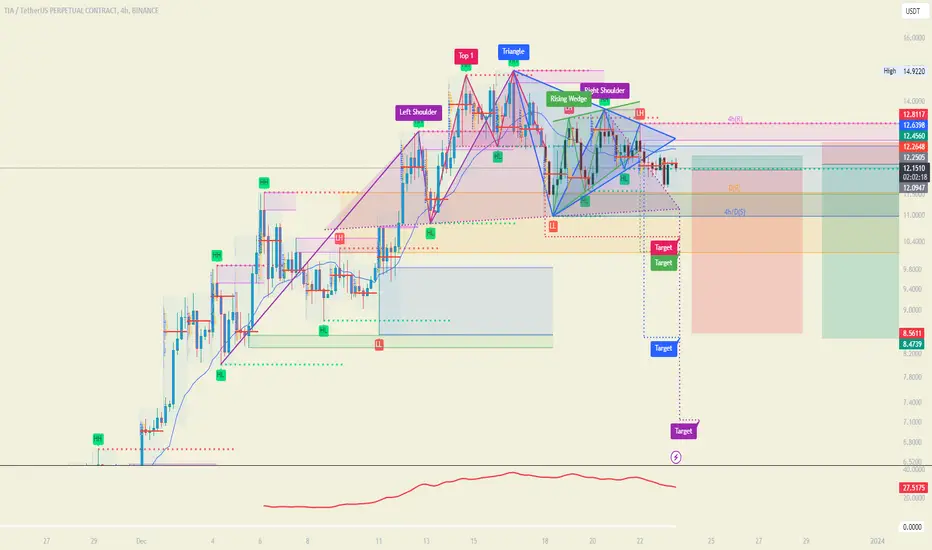
📊#TIA ’s potential smile structure deserves attention👀🧠After completing the daily level target, we consolidated and fell below the inflection point below. Being broken here means the end of the strong upward trend. In addition, we have not made adjustments to the daily level, so there are also downward expectations here. 🙏
➡️If we continue to fall below the low (L), it means that the smiley bearish structure is established, which means that we are about to enter the adjustment phase of a larger cycle📉
Let’s see 👀
⚠️Note that technical analysis is for reference only, don’t forget risk management. If you find it useful, please don’t forget to follow, like❤️ and share my analysis post📤
💕 Follow me so you don't miss out on any signals and analyze 💯

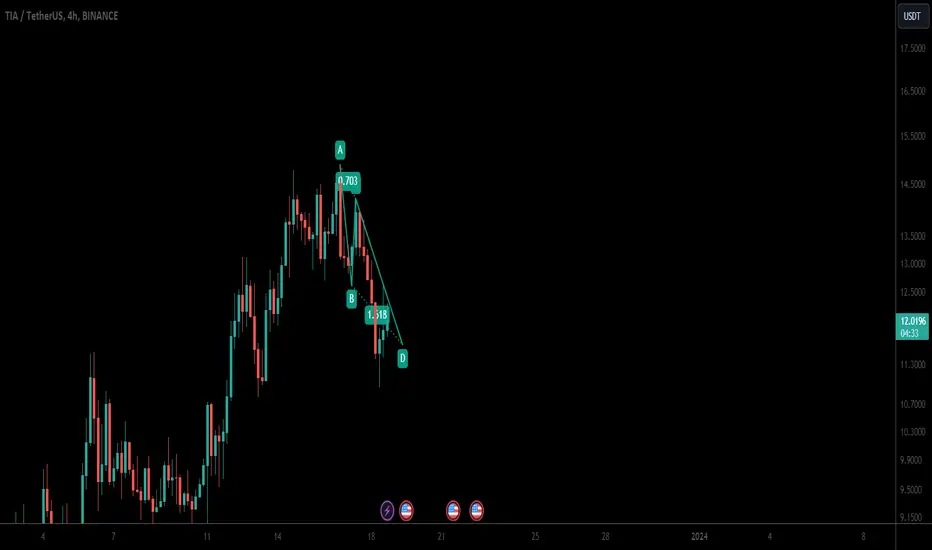
Celestia (TIA) completed setup for upto 17% pumpHey dear friends, hope you are well, and welcome to the new trade setup of Celestia (TIA).
Recently we caught almost 182% pump of TIA as below:
Now on a 4-hr time frame TIA has formed a bullish AB=CD move for the next pump:
Note: Above idea is for educational purpose only. It is advised to diversify and strictly follow the stop loss, and don't get stuck with trade.
$TIA CELESTIA ON A TREND LINELSE:TIA on a trend line, support is resisting but for how long?
There could be a buy opportunity, make the decision remains with you
TIA CELESTIAAfter forming a wedge pattern and breaking the lower trendline, we have 2 paths to the yellow target. The first is direct and the second way is to retrace to the trend line (and the new ATH) and then retrace to 5-7

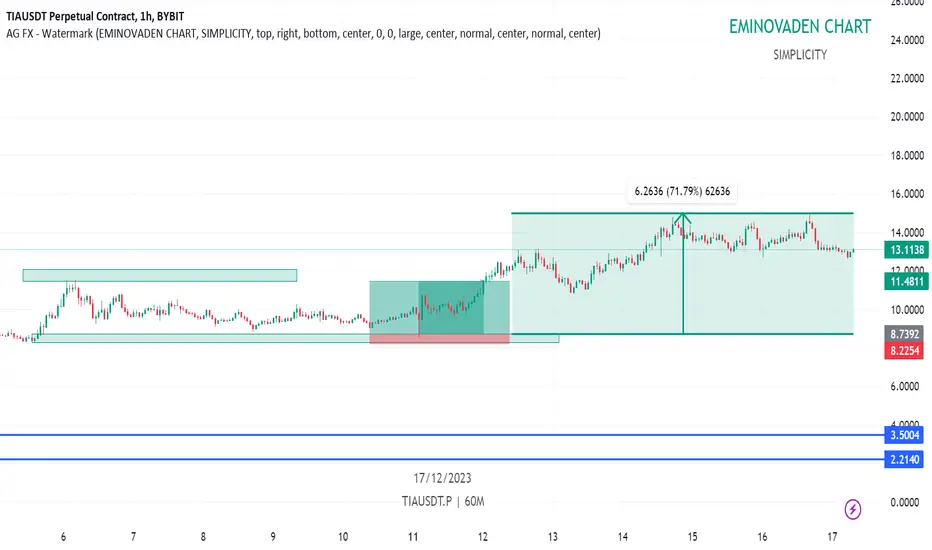
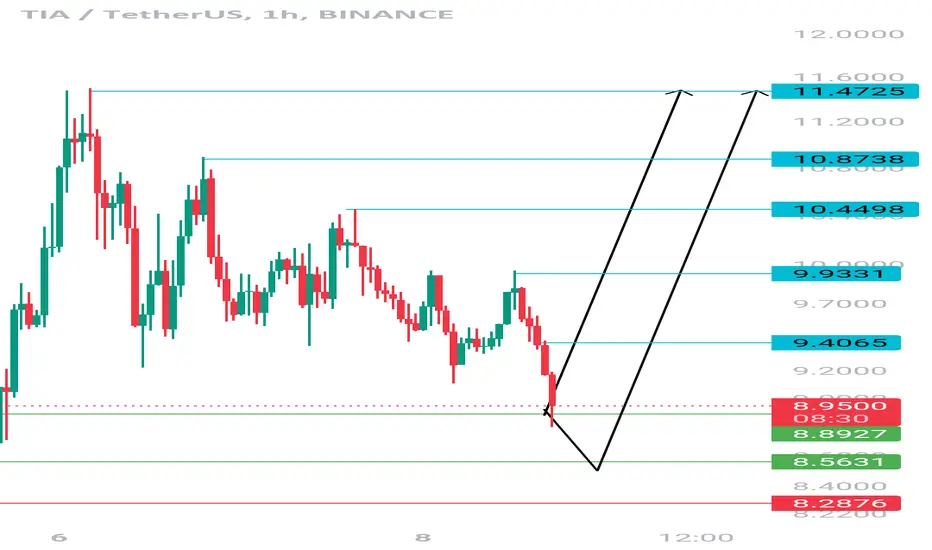
LONG FULL TARGET OVER HIT ON TIA Snap shot of long on TIA
Entry at 8.7392
Sl at 8.2254
First possible target hit 11.4811
All time high to break out to $15
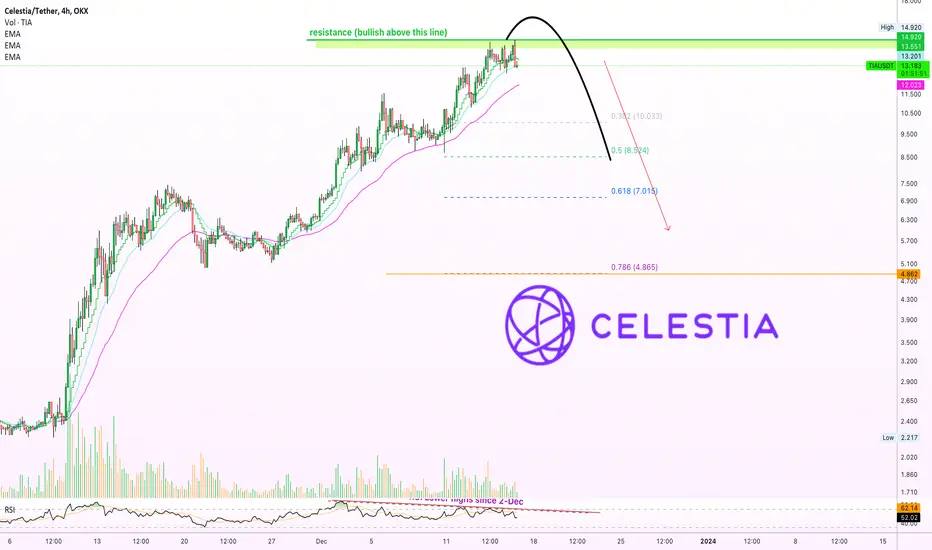
✴️ Celestia | TIAEverybody wants to know about "TIA"... Here is the problem, TIA is new.
The name sounds good to start and there is some hype for this pair, TIAUSDT.
When a new Altcoin is added to the exchanges, it tends to grow really fast and strong but then in reverse, it is followed by a very strong correction, sometimes a long one.
Celestia | This is what the chart is saying on the 4H timeframe.
➖ New high today, All-Time High (ATH).
➖ Volume was high early November, volume is low today (bearish).
➖ As prices rise, bearish divergence is showing up with the RSI.
Here the RSI is producing lower highs while TIAUSDT is producing higher highs; this is the bearish divergence.
On the daily timeframe, the last two candles are bearish, the last one being a "shooting star".
The potential for this pair is bearish (red), with the key word being 'potential'.
The chart is young and has no history, so it is hard to make a valuable analysis.
➖ We know from experience that new pairs tend to crash a few weeks after they are added to the exchanges.
➖ We know that new pairs/projects are added right before a major correction because market sentiment is high, greed, and this attracts newbies and they get trapped.
Knowing this, we will go with red.
It can grow more of course... I know this is not what you would like to hear/read, but that is just what the chart says.
Thank you for your support.
Namaste.
TIA/USDT Long Position.Clear bear flag. Channel has been broken and is currently being retested. Expecting a move to 14.5

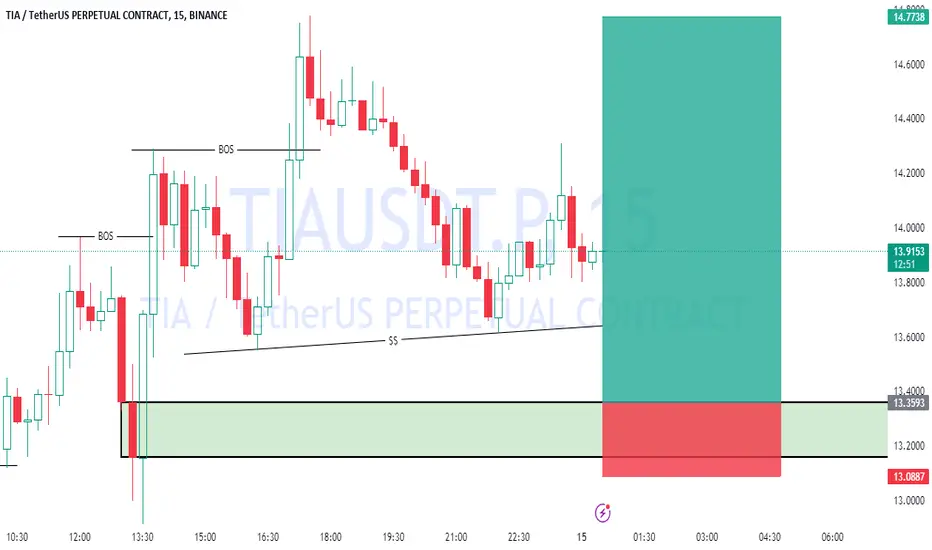
TIA Bullish OBTIA UPDATE: TIA currently on an uptrend movement and I’m currently expecting a liquidity to mitigate the bullish OB below at 13.3593 as displayed on the chart above…..
Follow for more market update and trade setup
Tia Is Still Strong Tia/usdt
Looking still strong don't ry to short, Shorters will wrekt
Not financial advice (DYOR)
Tia 11$ Again Tia/usdt
I am expecting tia price to touch again 11$ .Let's see
It's not financial advice, Do your own research
TIA NEW VOLUME ENTERINGThank you for reading this update.
Depending on our study we see that TIA has a good chance of volume increase.
This updates depending on day trade, And the market should confirm with time the right market way.
#Nottradingadvice
#For day traders take always profits when market increase
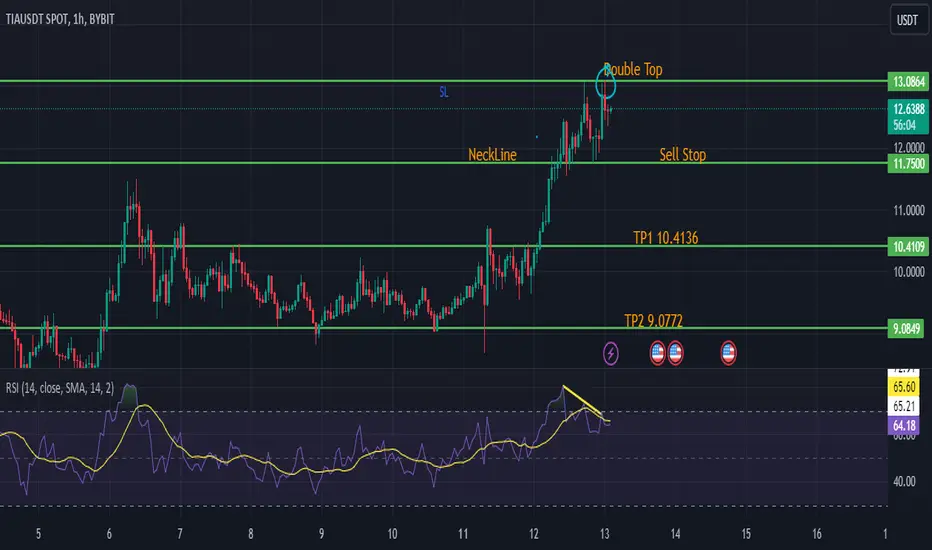
TIAUSDT In Trend ReversalTIAUSDT is making a double top and RSI indicator also showing divergence, indicating a trend reversal. Can take an entry by placing sell stop order on breaking of the neckline or can take instant entry of neck line is already broken.
TIA Growth Spurt: Buy Your Ticket to Profit!"**Short Fundamental Analysis of TIA**
**Overview**
Cellestia TIA is a decentralized token and platform that aims to create a new type of economy based on trust, transparency, and efficiency. The platform uses a unique consensus mechanism called Proof of Trust (PoT) that is designed to be more equitable and efficient than traditional blockchains. TIA is the native token of the Celestia network, and it is used for a variety of purposes, including paying transaction fees, securing the network, and participating in governance.
**Fundamental Strengths**
* **Unique consensus mechanism:** Proof of Trust (PoT) is a novel consensus mechanism that is designed to be more equitable and efficient than traditional blockchains. PoT is based on the idea of trust between nodes in the network, rather than competition for block rewards. This makes it less susceptible to centralization and more energy efficient.
* **Decentralized governance:** Celestia is governed by a decentralized council of validators. This means that the platform is not controlled by any one entity, and decisions are made by the community.
* **Scalability:** Celestia is designed to be scalable, meaning that it can handle a large volume of transactions without sacrificing performance. This makes it well-suited for use in a variety of applications, including financial services, supply chain management, and IoT.
**Fundamental Weaknesses**
* **Early stage:** Celestia is still a relatively new project, and it is not yet widely adopted. This means that there is a higher level of risk associated with investing in TIA.
* **Lack of liquidity:** TIA is not yet listed on many major exchanges, which means that it can be difficult to buy and sell. This can also make it difficult to price the token accurately.
* **Technical complexity:** Celestia is a complex project, and it may be difficult for some users to understand how it works. This could limit its adoption.
**Recent News**
* **Celestia Mainnet Launch:** Celestia's mainnet launched in October 2023. This is a major milestone for the project, and it is expected to attract more users and developers.
* **Celestia Integration with dYdX:** Celestia has integrated with dYdX, a popular decentralized exchange. This integration will allow users to trade TIA on dYdX, which could increase the token's visibility and liquidity.
* **Celestia Foundation Grants:** The Celestia Foundation has awarded grants to several projects that are building on the Celestia network. This funding will help to accelerate the development of the ecosystem.
**Disclaimer AI**
Please note that I am not a financial advisor, and this information is not financial advice. Always do your own research before investing in any cryptocurrency.
**Conclusion**
Celestia TIA is a promising project with a number of strengths. However, it is also a relatively new project with some risks associated with it. Investors should carefully consider their own risk tolerance before investing in TIA.
I hope this information is helpful.

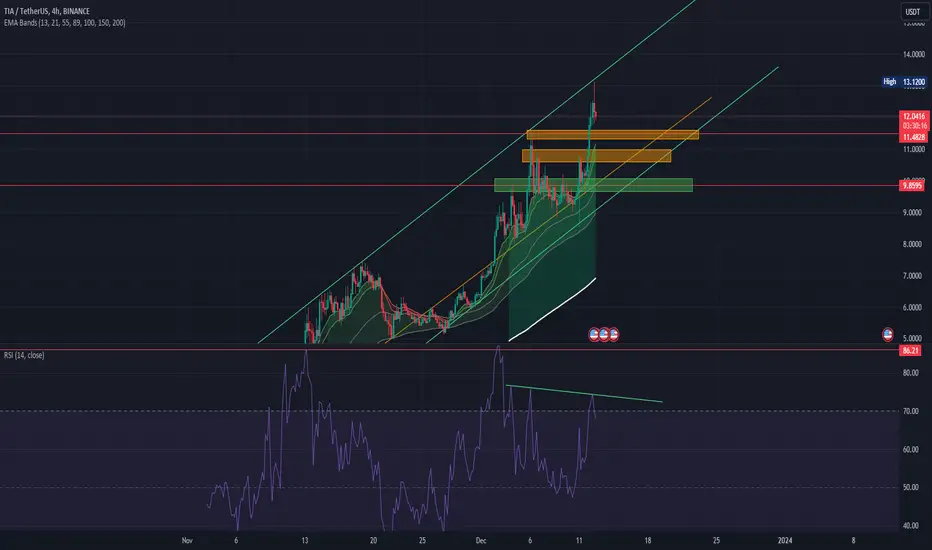
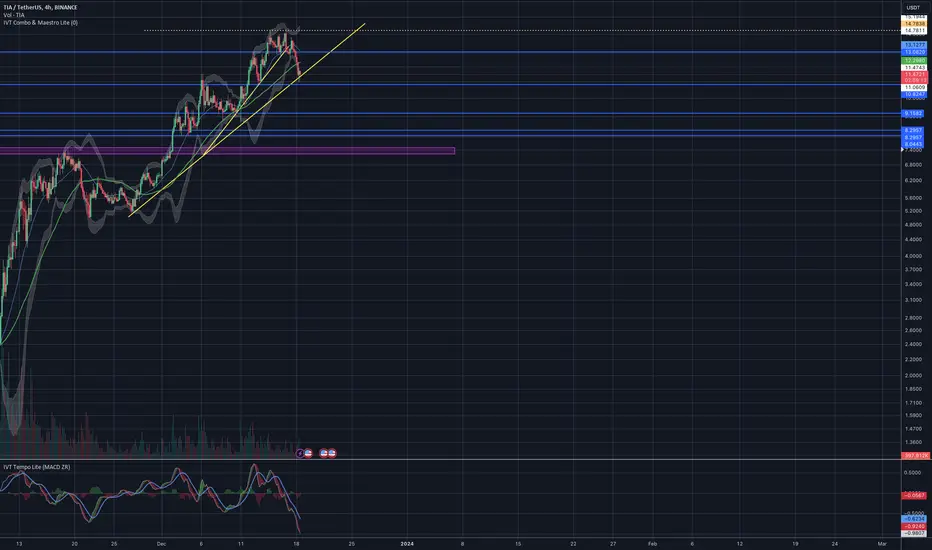
Time for retracementAfter a massive pump it's time for a short term retracement on TIA.
On the 4h chart there is a bearish divergence - I place in the chart my three entry points in the short term.
The green rectangle represents a good support zone, so I do not expect it to go below that price at the moment