TIA/USDT BULLISH reversal from Fibonachi GOLDEN ZONE📈 TIA/USDT – 4H Analysis (BINANCE)
🟢 Bullish Reversal Setup Identified
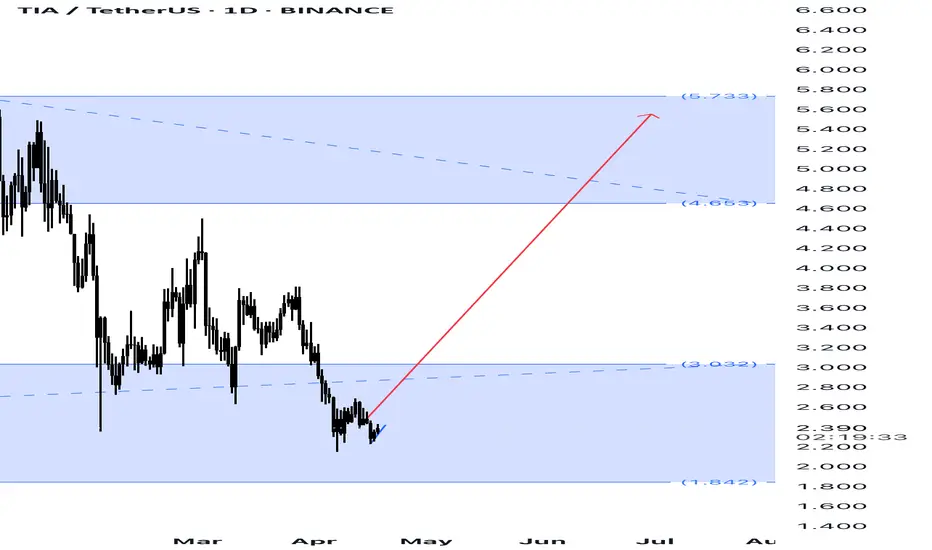
Price has tapped into the Fibonacci golden pocket (0.705–0.79) and shown a strong reaction from the demand zone at $2.32–$2.34. A clean bounce suggests potential upside towards the previous high at $3.03.
🎯 Trade Plan:
Entry: $2.34 – $2.36
TP: $3.03
SL: $2.17
Risk-Reward: ~3.5R
❗DO YOUR OWN RESEARCH
TIAUSDT trade ideas

TradeCityPro | TIA: Key Support Test in Cosmos-Based Token👋 Welcome to TradeCity Pro!
In this analysis, I want to review the TIA coin for you. This project is one of the protocols in the Cosmos ecosystem and currently ranks 53 on CoinMarketCap with a market cap of $1.51 billion.
📅 Daily Timeframe
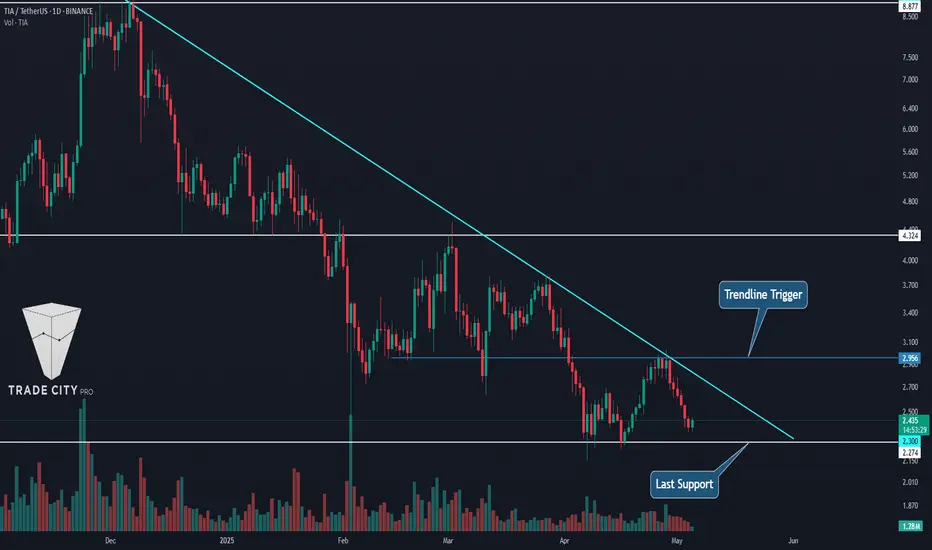
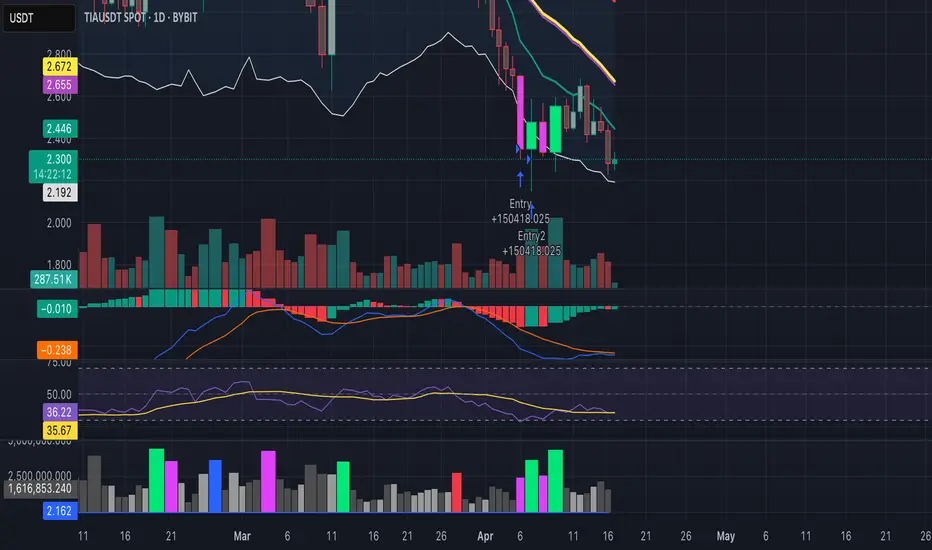
As you can see on the daily chart, there's a descending trendline, and the price has been moving down along with it. Currently, the price has reached its main support zone at 2.274.
✨ This is the most critical support for this coin, and if it breaks, the price will move toward a new all-time low. So, buyers will do everything they can to protect this support.
💥 If the price gets supported at this level, the first trigger for opening a long position would be the breakout of the descending trendline. That trigger level is the break of 2.956.
🛒 You can also use this trigger for spot buying. The main trend reversal confirmation comes with a break above 4.324. However, in any case, if any of these triggers are activated, I personally will wait for Bitcoin dominance to show a trend reversal before buying altcoins on spot using the first solid trigger I find.
🔽 For short positions, the key point to remember is that the trend is already downward, so we don’t need a trend reversal confirmation to go short.
⭐ The short trigger is very clear and straightforward — if the 2.274 level breaks, you can enter a short position. Additionally, a pullback to the trendline can also be used as an entry point.
📝 Final Thoughts
This analysis reflects our opinions and is not financial advice.
Share your thoughts in the comments, and don’t forget to share this analysis with your friends! ❤️
Tia short down to $2.28 todayJust now opened a short position on tia. I anticipate continuation fall towards $2.28
Time sensitive.
Stop and partials on chart

Tia scalp short to $2.576Just now opened a scalp short on Tia. Time sensitive.
2RR
Stop: $2.649
Target; $2.576

TIA - Some Major LevelsTIA, i would call it for more Short purposes, but market sentiment can change really quickly.
If you wanna be on safer side, then trade it on retest of those levels.
12h: Bigger TL as R on Chart and on OBV.
1: Below an overview of Lines of 1h OBV.
Follow for more ideas/Signals.💲
Check out my previous TA/Signals which played out nicely. :)
Just donate some of your profit to Animal rights or other charity :)✌️

TIAUSDT 1D AnalysisTIA ~ 1D Analysis
#TIA Buy after successfully penetrating this resistant line with a short -term target of at least 10%+.
TIAUSDT - Daily Chart - Complex Correction AnalysisHere's my Elliott Wave analysis for TIAUSDT, outlining a potential complex corrective structure.
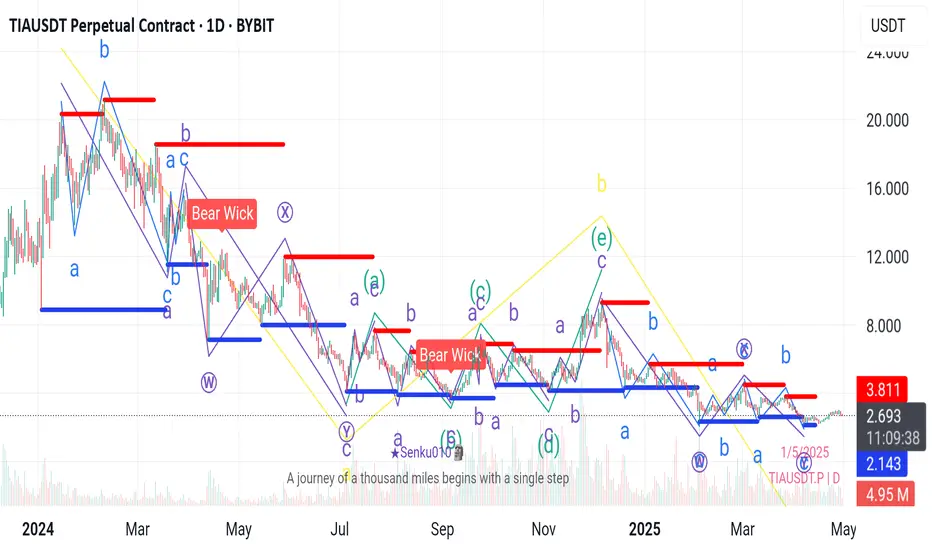
Primary Scenario: Large ABC Correction
I've identified a primary three-wave correction (Big A - Big B - Big C).
Big A: A completed three-wave (a-b-c) correction with a deep Wave B (100% retracement) and an extended Wave C (1.414 extension).
Big B: A shallower three-wave (a-b-c) correction retracing 0.382 of Big A.
Big C: A deeper complex correction retracing 1.272 of Big A, unfolding as a W-X-Y structure. The sub-waves of W and X appear complete, with Wave Y currently unfolding.
Alternative Scenario: Triangle for Big B
An alternative interpretation suggests Big B could have formed a complex Expanding Triangle (a-b-c-d-e). If this is the case, the subsequent move (currently labeled as part of Big C in the primary scenario) would be the wave following the Triangle's completion.
Current Outlook and Bias:
The long-term structure suggests a significant correction is underway.
Primary Scenario: If Big C's W-X-Y structure is complete or nearing completion, we could anticipate a potential move in the opposite direction of the overall correction (bullish if the preceding trend was up).
Alternative Scenario: If Big B was a Triangle, the direction of the breakout from the Triangle will dictate the subsequent move.
TIAUSDT UPDATE
TIA Technical Setup
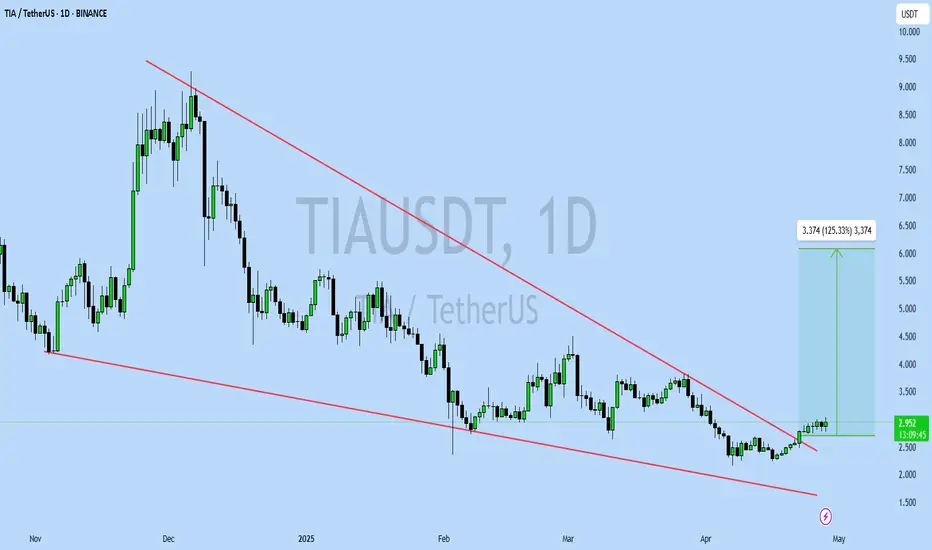
Pattern: Falling Wedge Breakout
Current Price: $2.96
Target Price: $6.33
Target % Gain: 125.33%
Technical Analysis: TIA has broken out of a falling wedge pattern on the 1D chart, showing bullish momentum. Volume is picking up, confirming the breakout and a strong move toward the target.
Time Frame: 1D
Risk Management Tip: Always use proper risk management.
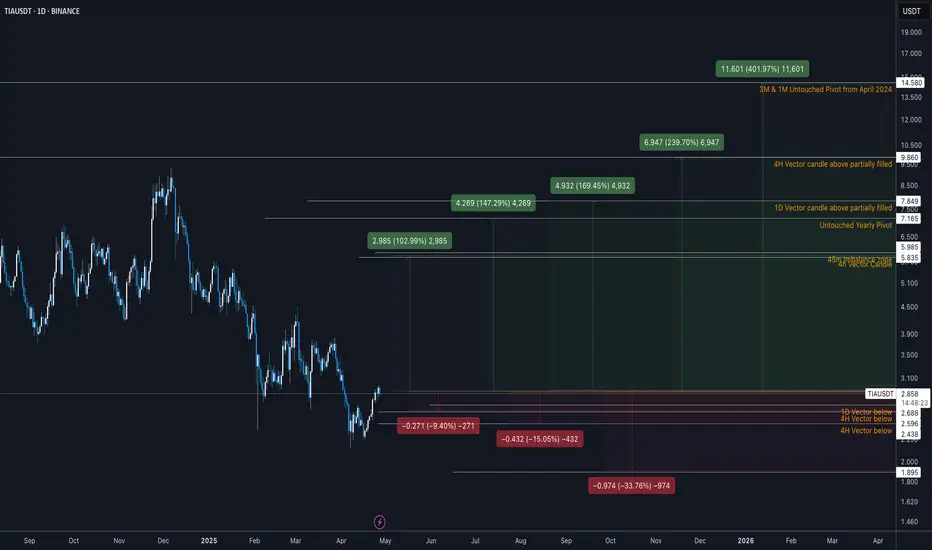
TIAUSDT — 2025 Technical RoadmapTIAUSDT — Daily Technical Roadmap
🕞 60-Second Read
Trend on the 1-D chart is still structurally bearish ; price (spot 2.865 USDT) just carved a higher-low off the 2.44 vector block and is knocking on the Yearly BC lid. Two large upside voids now beckon.
Hot-Zone #1 – 2.60 → 2.44 (1 D + 4 H vector demand): stacked fresh liquidity, 9-15 % under spot.
Hot-Zone #2 – 2.985 (Yearly BC): first breaker & range cap, only 4 % above; a daily close above here opens the air-pocket to 4.27.
Hot-Zone #3 – 4.932 → 6.947 (Yearly Pivot ↔ Yearly TC): macro supply shelf guarding a 72-142 % rally window.
💧 Liquidity & Imbalance
Daily vector 7.85 (77 % fill-rate inside 60 d).
Stacked 4 H vectors 9.86 / 9.83 = 2.5 % supply shelf.
Demand stack 2.69 – 2.44 only 18 d old.
⚡ Volatility & Momentum
GMMA Z-Score curling up from −2 σ; short ribbons still under long ribbons – suggests pause, not reversal.
🎲 Probability Dashboard
HTF Structure −3
Liquidity voids +1
Momentum −1
Vol-regime 0
Bear / Neutral / Bull ≈ 42 % / 33 % / 25 %
📈 Trade Playbook
Strategy 1
1. Layered Limit Grid – Aggressive Counter-Trend Long
Entry layers (size %):
2.60 – 40 % of your allocated TIAUSDT size
2.44 – 30 %
2.05 – 20 %
1.90 – 10 %
SL = 1.75 (≈ 1 ATR below extreme demand)
TP ladder:
2.985 – 25 % off-load
3.722 – 25 %
4.932 – 25 %
6.947 – 15 %
7.849 – 10 %
Weighted R:R ≈ 4.3
Strategy 2
2. Layered Limit Grid – Conservative Breakout Long
Trigger: daily close > 3.722 (Yearly Low reclaim), then place grid orders.
Entry layers (size %):
3.75 – 40 %
3.55 – 30 %
3.25 – 20 %
2.985 – 10 %
SL = 2.70
TP ladder:
4.932 – 30 %
6.947 – 30 %
7.849 – 20 %
9.860 – 15 %
12.432 – 5 %
Weighted R:R ≈ 3.8
⚠️ Risk Radar
Low-float token – slippage risk on size.
Macro event: FOMC 1 May → volatility spike possible.
BTC options IV rising – spill-over risk to alts.
Price must conquer 2.985 to open the upside magnet trail toward 4.27 → 4.93. Failure keeps 2.60 → 1.90 demand stack in play before any durable markup.
Not financial advice – do your own research & manage risk.
TIA buy/long setup (4H)TIA seems to be in the middle of a bullish pattern, especially as it has reclaimed key levels and there is an order block located below the current price.
Two entry points are marked on the chart, indicating where we’re looking for buy/long positions.
Targets are specified on the image.
A 4-hour candle closing below the invalidation level would invalidate this setup.
For risk management, please don't forget stop loss and capital management
When we reach the first target, save some profit and then change the stop to entry
Comment if you have any questions
Thank You

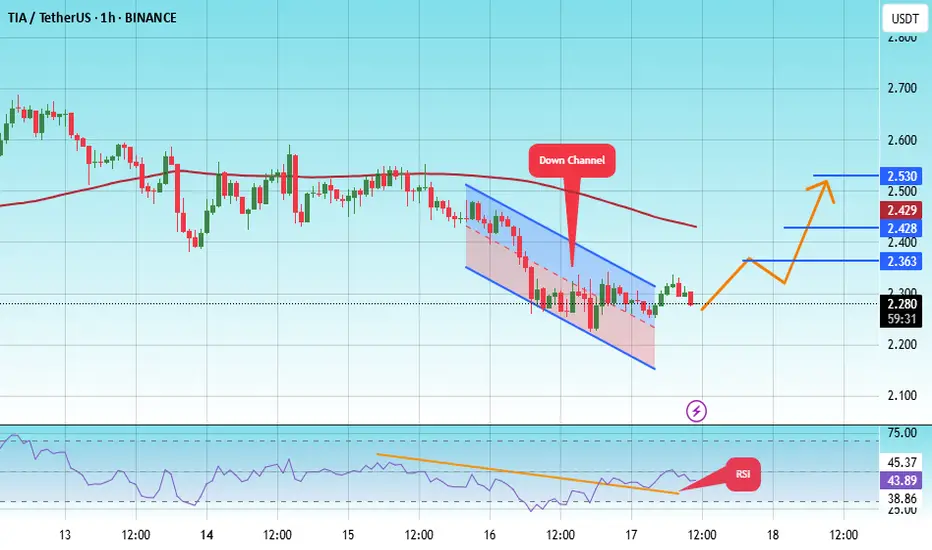
#TIA/USDT#TIA
The price is moving within a descending channel on the 1-hour frame, adhering well to it, and is heading towards a strong breakout and retest.
We are experiencing a rebound from the lower boundary of the descending channel, which is support at 2.18.
We are experiencing a downtrend on the RSI indicator that is about to be broken and retested, supporting the upward trend.
We are looking for stability above the 100 Moving Average.
Entry price: 2.27
First target: 2.36
Second target: 2.42
Third target: 2.53
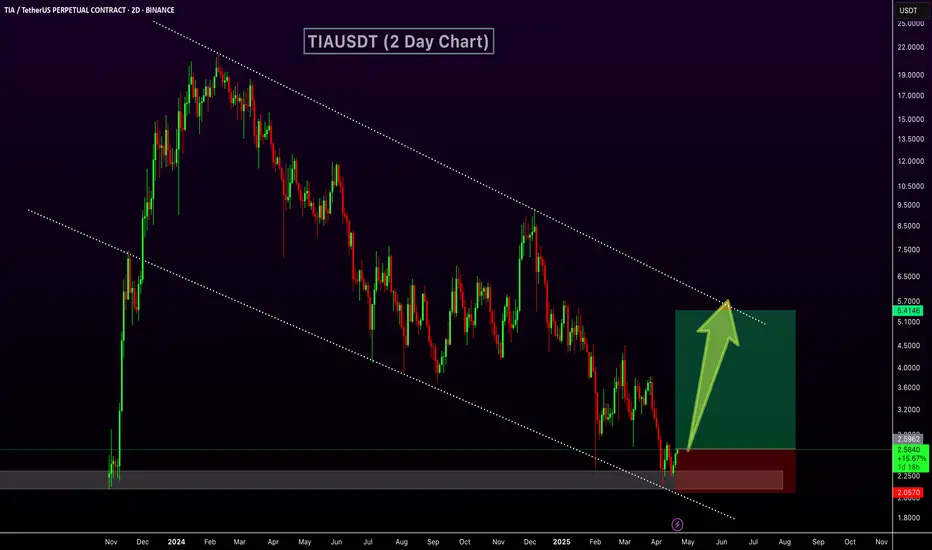
TIAUSDT Bottoming Out?TIAUSDT Technical analysis update
TIAUSDT has been trading within the longest descending channel. The price has once again touched the channel support and also retested the November 2023 support level or bottom. A strong bounce from this zone is likely, and we could potentially see a 100–150% move from the current level.
TIA - Quick ShortTIA is at resistance with divergence on 1min chart.
Just opened a quick short to catch the retracement.


TIA: Crazy Risk to Reward Ratio#Tia faced steep losses since Dec 2024, underperforming similar coins.
Now near its ATL, it presents a high risk-to-reward setup.
Below $2.10 is the stop-loss, while passing above $3.80 signals a bullish reversal in trend with higher targets ahead.
#Celestia

TIAUSDT reflection too100%The crypto is inside a monthly demand zone and is expected to move to the weekly supply zone with a target if 100% profit.
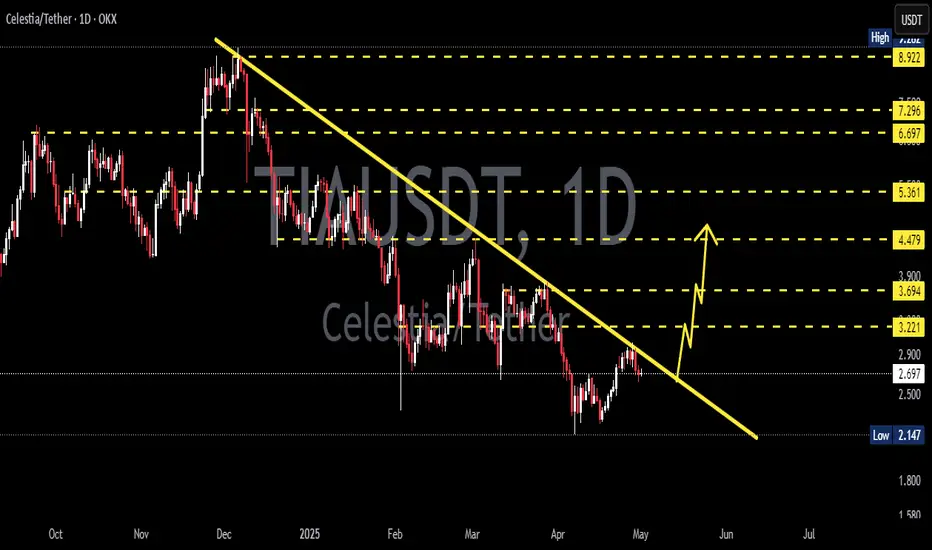
Long TIA from 2.30 to 5.5 dollars When price comes to the weekly chart lower band and bounces away as we have it now. The bears have been firmly defeated.
We have a weekly divergence and relative to selling there is more buying volume.
We could pop down to 2.05 as the final scare drop but am not counting on it but be prepared to load up more there.
Price should be going to the upper band around 5.50 to 6 dollars.
TIA Rejected on Last Strong SupportTIA range is around 2.1 till 4.1
this range is approx 100% gain and 50% loss
buy now is good risk reward

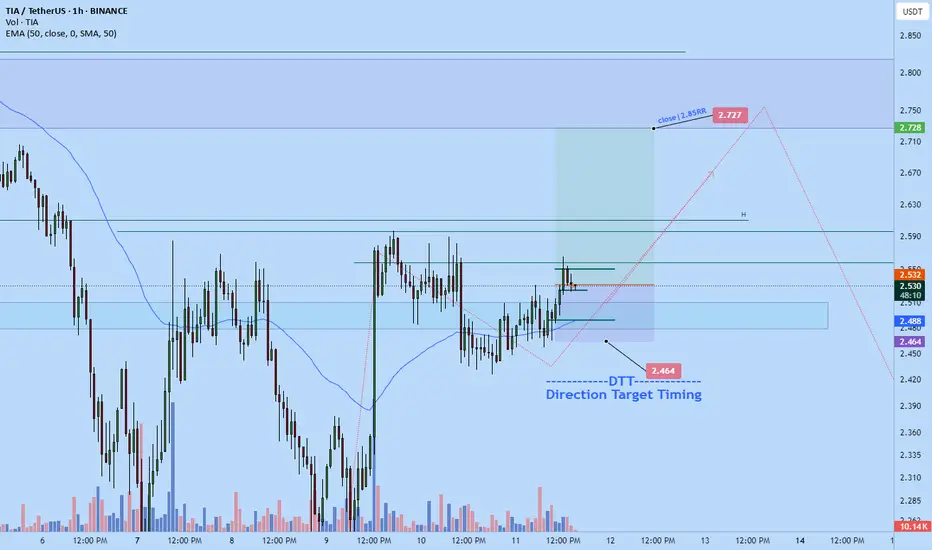
Celestia long to $2.727 possiblyJust opened a long position on #Celestia
Targeting $2.727 🎯but willing to exit earlier
#tia
DTT setup
Is TIA About to Break Down Hard? Traders Beware Before It’s lateYello, Paradisers! Did you catch the recent bullish rally on #TIAUSDT? It’s been delivering solid gains over the past couple of days, giving traders reason to celebrate. But what if we told you that this rally might just be setting up a classic trap—one that smart money is already preparing to take advantage of? The technical structure forming right now suggests a high probability of a reversal, and if you’re not paying attention, you might end up on the wrong side of the move.
💎#TIAUSDT, at the core of setup is a developing a probable Bearish Gartley pattern. These harmonic structures are rare but extremely powerful when they align with multiple technical confirmations and that’s exactly what we’re seeing here. With the recent move upward, TIAUSDT appears to have completed its C leg, a critical part of the Gartley structure. This sets the stage for the D leg, which typically completes much lower. The price reacted strongly from the C leg area, which also happens to line up perfectly with a previous local high adding even more probability to the resistance at that zone.
💎This resistance isn't just horizontal there's a dynamic element at play as well. The 21-period EMA on multiple timeframes is currently acting as a ceiling for price action. When a key moving average starts rejecting price repeatedly, it often signals that the current trend is losing steam and this dynamic resistance only strengthens the case for a downside move from here.
💎Looking deeper, the bearish signs are confirmed by momentum indicators. The RSI on lower timeframes is not only overbought but also showing clear signs of bearish divergence. This divergence occurs when the price continues to make higher highs while RSI starts forming lower highs a classic sign that momentum is weakening. It’s one of the more reliable early warnings that a reversal may be near. In this case, RSI is flashing that warning now, suggesting that buyers may soon run out of fuel.
💎If this bearish probable scenario plays out as expected, the first key level to watch on the downside sits around the 3.278 zone. This minor support may offer a temporary bounce, but if the D leg of the Gartley is to be completed, we could see even deeper price action. This makes the current area extremely sensitive—any weakness from bulls could trigger a fast move downward.
💎However, no pattern is complete without an invalidation level, and for the Bearish Gartley, that comes in around the 3.805 resistance zone. A strong, sustained close above this level would invalidate the bearish setup and signal renewed bullish momentum. Until then, all technical signals are pointing toward caution, especially for those still riding long positions without a tight risk plan.
Stay alert, Paradisers. The market is about to decide. This is a textbook moment where emotions can take over, and late buyers get punished for chasing green candles. That’s why, we are playing it safe right now. If you want to be consistently profitable, you need to be extremely patient and always wait only for the best, highest probability trading opportunities.
MyCryptoParadise
iFeel the success🌴

TIAUSDT 3DTIA ~ 3D Analysis
#TIA Key support that must be maintained. Loss of this support, LSE:TIA price will be more depressed lower.

$TiaI am ready to get wrong (again) in Tia,
Buying zone: (3$ - 2$)
Selling for around ATH or new lows against BTC.

Celestia scalp longJust took celestia scalp long.
Its moving . Time sensitive
Target: $3.00 or a bit higher but going to bed soon so $3.00
