Short term Bullish DollarExpecting a short term bullish dollar this month
watchin the market for next week
DXY trade ideas
DXY's pullback is dueThe USD has been very weak, which means that a pullback is due. I won't be participating in shorting the USD this coming week despite the Fundamentals have been telling us. Seeing through the technical point of view, we 've seen that May's low had been purged last week. Price action is anticipated to make its way buyside. The full-bodied Daily bearish candle to the left at 100.500 is going to be the magnet for price to seek into mitigate next week.

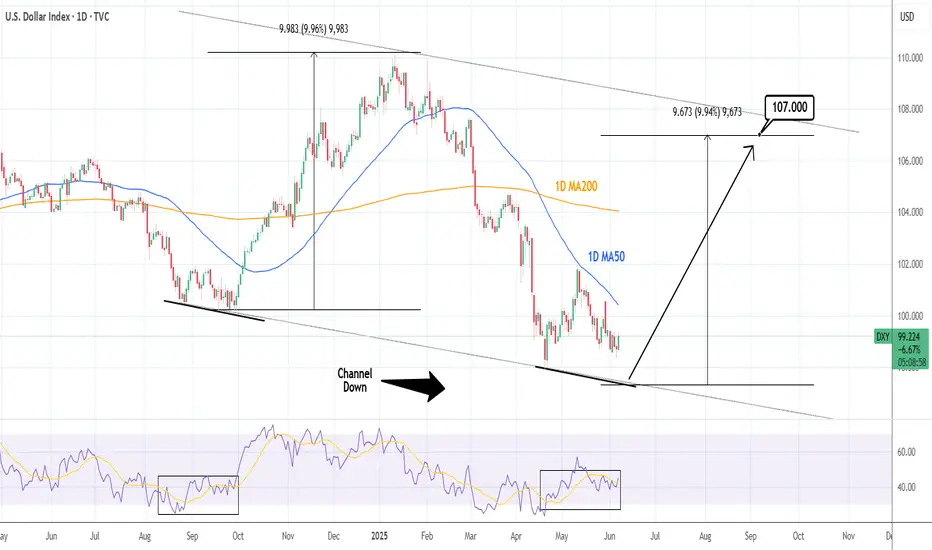
DXY: Approaching a bottom. Wait for the 1D MA50 to break.The U.S. Dollar Index is neutral on its 1D technical outlook (RSI = 45.278, MACD = -0.450, ADX = 23.415) as it seems to be approaching a long term support level, the bottom of the 12 month Channel Down. As long as it stays under the 1D MA50, the trend will remain bearish towards the bottom but once it crosses above, we will turn bullish and aim for a +9.95% bullish wave (TP = 107.000) same as the one before. Notice how similar the 1D RSI fractals are now and the previous bottom in September 2024.
## If you like our free content follow our profile to get more daily ideas. ##
## Comments and likes are greatly appreciated. ##
DOLLARImpact of June 6 Non-Farm Payrolls (NFP) Data on Fed Rate Decisions
Key Data Points
Non-Farm Employment Change: 139K (vs. 126K forecast, revised April: 147K from 177K).
Unemployment Rate: Steady at 4.2% (matches forecasts).
Average Hourly Earnings: 3.9% YoY (vs. 3.7% expected).
Labor Force Participation Rate: Declined to 62.4% (from 62.6%).
Fed Policy Implications
Labor Market Cooling but Resilient:
Job growth slowed (139K vs. 147K prior), with cumulative downward revisions of 95K for March and April. This signals moderation but avoids a sharp deterioration.
Stable unemployment rate (4.2%) and wage growth (3.9% YoY) suggest the labor market remains tight enough to sustain consumer spending but is losing momentum.
Inflation Concerns Persist:
Sticky Wage Growth: Elevated wage inflation (3.9% YoY) complicates the Fed’s inflation fight, particularly in services sectors.
Productivity-Sensitive Costs: Rising labor costs without productivity gains could pressure corporate margins and consumer prices.
Fed’s Balancing Act:
Near-Term Hold Likely: The Fed is expected to keep rates at 4.25–4.50% in July, prioritizing inflation control over labor market softness.
Rate Cut Odds Shift: Markets now price a ~55% chance of a September cut (up from ~40% pre-NFP), contingent on further cooling in inflation (June 11 CPI data critical).
Market Impact
DXY (Dollar Index): Minimal immediate reaction, but sustained labor market cooling could weaken the dollar if rate cuts gain traction.
Equities: Mixed signals (slower jobs vs. stable wages) may limit gains, though tech and growth stocks could rally on delayed Fed tightening.
Bonds: 10-year yields (4.40%) may edge lower if growth fears outweigh inflation risks.
Conclusion
The Fed will likely delay rate cuts until September unless inflation softens decisively. While job growth is slowing, persistent wage pressures and a stable unemployment rate justify a cautious stance. Traders should monitor June CPI (June 11) and Q2 GDP data for clearer signals.
Summary:
No July cut expected; September cut remains contingent on inflation easing.
DXY range-bound near 98.50–99.50 until CPI release.
stay cautious
#gold #DOLLAR

US Dollar Analysis - by MMFX This is not a prediction, it never is.
My bullish anticipation on the instrument is rooted from many catalyst of course, though the proof of the pudding is communicated on the charts itself.
I zero in on the Weekly to Day bias on price action looking for: Market Structure, Inducement, CISD, Candle Stick Patterns, Voids/Gaps, SMT, Liquidity Sweeps, Bullish ChoCH, BOS, etc.
On the 4H - 30M scope i look to refine and define the narrative.
Monitoring fundamentals & lending rates on the global and domestic scale I pair this with
barometers related to the index such as Treasury's, GOLD and other securities to identify if my Bullish suspicions are true..
Thank you.

Just got the May NFPs... Let's have a lookWe just received the May NFPs, which, overall, are not bad. Let's dig in.
TVC:DXY
TVC:DJI
FX_IDC:USDJPY
FX_IDC:USDCAD TVC:GOLD
Let us know what you think in the comments below.
Thank you.
77.3% of retail investor accounts lose money when trading CFDs with this provider. You should consider whether you understand how CFDs work and whether you can afford to take the high risk of losing your money. Past performance is not necessarily indicative of future results. The value of investments may fall as well as rise and the investor may not get back the amount initially invested. This content is not intended for nor applicable to residents of the UK. Cryptocurrency CFDs and spread bets are restricted in the UK for all retail clients.


DXY June 6 Over all notesDXY
June 6
Over all notes
Parent bias is bear
Discount range current/previous
MONDAY-EXPANSION
*Expands to equal lows
TUESDAY REVERSAL
*gaps lower
*Rally to retrace
*Creates equal highs
WEDNESDAY REVERSAL-CONSOLDATION
*Gaps lower
* takes equal highs
*Expands lower creates equal lows
THURSDAY CONSOLIDATION-EXPANSION
*Asia retrace to minor buy side, taps a bearish order block, CE of hourly FVG
*London 2 macro expansion sell off
*classic 7 macro retrace fake out
*NY 8 macro ND Price expands to target of the week equal lows
*NY 10 macro SILVER BULLET reversal
*Consolidation
*dealers range retraces to 50 level
F DELIVERY RETRACE
Sell side taken expected buy day
*Asia on the 50 level previous session-sign that price is seeking buy side liquidity
*20:00 expands buy side
TAKE AWAYS- REMEMBER THIS
Parent bias is KING
*4 hour is bias and order flow
*1 hour confirm cycle where price has delivered to and what liquidity taken
*5 equal lows/highs and candle formations
TRADE CHECKLIST
confirming bias, direction, liquidity taken, previous session fib levels, and time of day are the keys
In hindsight price delivered perfectly to a equilibrium to premium logic, back tested logic for direction on Wednesday, Thursdays speculation for new driver. Wow it must be random ICT 2022 model

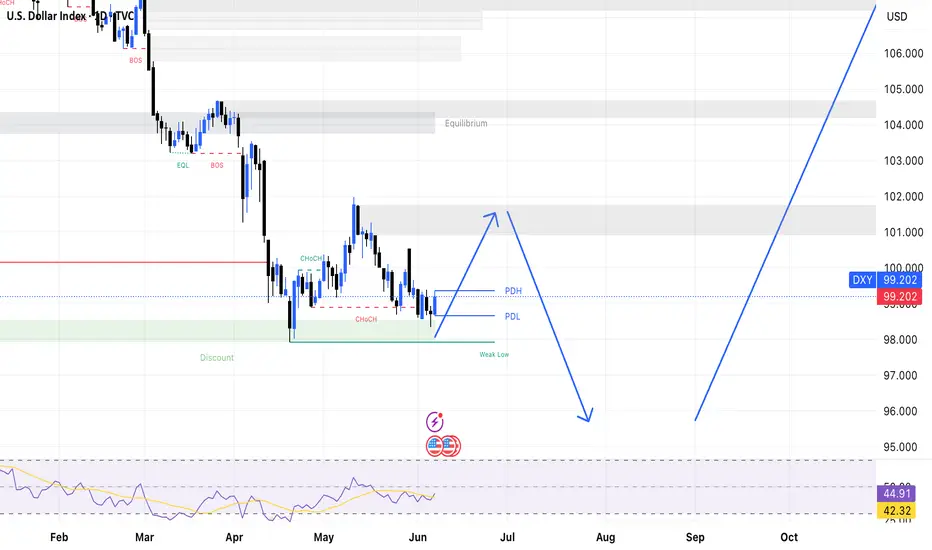
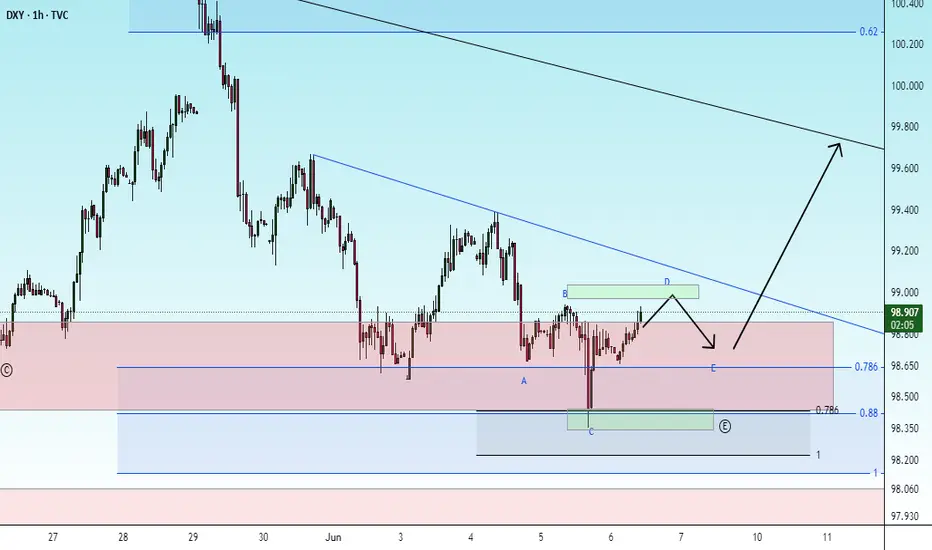
uptrendThe triangle pattern is expected to continue along the specified paths. Then, with the completion of the corrective pattern, the start of an upward trend is likely.
Highly likely the DXY goes down.Trading the DXY increase in 2022 was my best trade of that year. Specifically on the USD/CAD pair not the whole index. Options worked great for this.
I had call options on USX not the company. It's Options on the US Dollar (USX) on the TMX exchange in Montreal Canada. To gain exposure to a rising dollar, or to hedge existing positions, call options on USX can be an effective tool. If DXY is going down like 2020-2021 it's great for stocks and equities. A falling dollar is also beneficial from the perspective of US national debt, as it makes interest payments cheaper in relative terms. Also many people outside the US have USD debts so example they make CAD but their debts are in USD. Well now their company is worth more as debt went down and revenue up. Otherwise known as currency risk. Very important for companies dealing in multiple currencies regardless of the type of business they do.
The US has incentive for a weaker dollar as the interest payments on their debt are now around $1 Trillion a year.
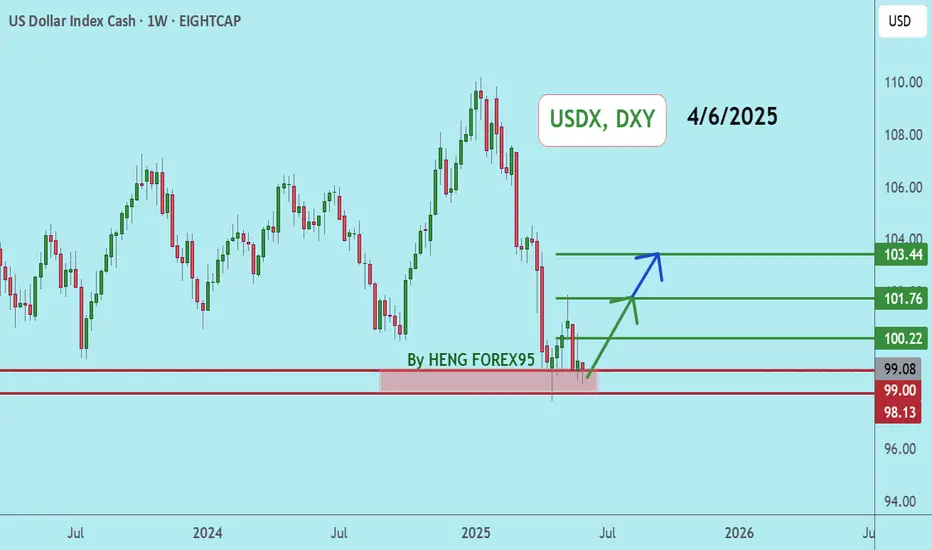
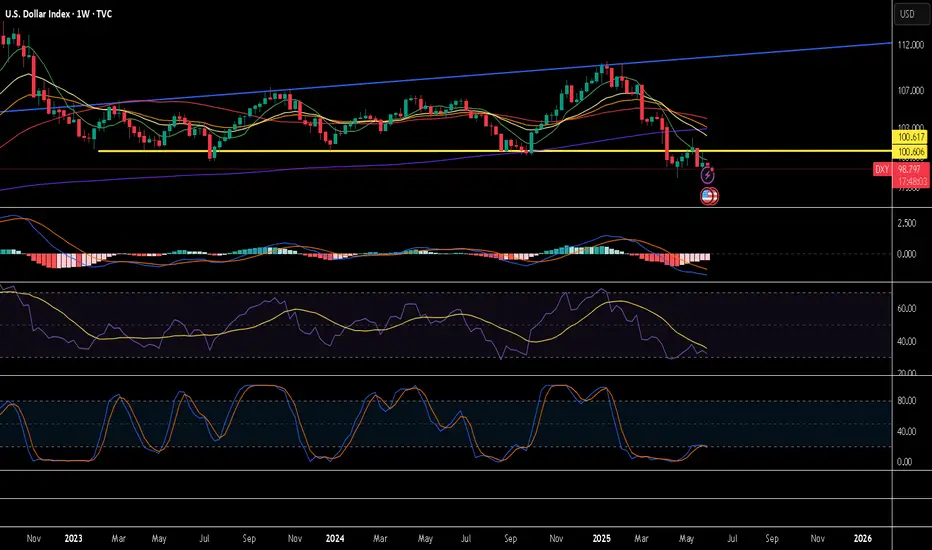
This yellow line represents a significant long-term resistance level. As long as the price fails to break and hold above this zone, the path of least resistance remains to the downside.
The MACD is currently moving down, supporting a bearish bias. However, there are two key bullish signals I am watching that would challenge this view:
The Bullish Crossover: This occurs if the blue MACD line crosses above the orange signal line.
On the daily timeframe, a simple crossover can sometimes be a temporary fake-out (like
the "flip-flopping" seen around April 3rd-9th). While it's a warning, it's not always a
definitive trend changer on its own.
The Bullish Divergence: This is the more powerful signal. If the price has set a new low since
April 2025 but the MACD has formed a higher low, it creates a bullish divergence. A
confirmation of this pattern could signal the end of the long-term downtrend and mark a
serious change in market conditions.
A bullish crossover happening at the same time as a confirmed bullish divergence would be a very strong combination, making a short position on the DXY extremely risky.
**Disclaimer:**
*The information provided in this post is for educational and informational purposes only. It does not constitute financial advice, investment recommendations, or a solicitation to buy or sell any financial instruments. All investments involve risk, and the past performance of a security, market, or trading strategy does not guarantee future results. I am not a financial advisor. Please conduct your own thorough research and consult with a qualified financial professional before making any investment decisions. You are solely responsible for any investment decisions you make.*
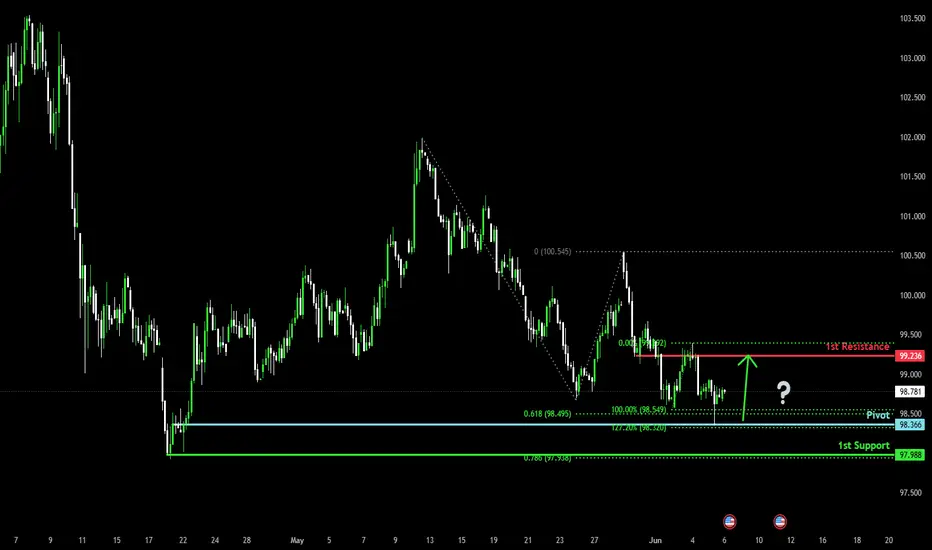
Bullish bounce?US Dollar Index (DXY) has bounced off the pivot and could rise to the 1st resistance.
Pivot: 98.36
1st Support: 97.98
1st Resistance: 99.23
Risk Warning:
Trading Forex and CFDs carries a high level of risk to your capital and you should only trade with money you can afford to lose. Trading Forex and CFDs may not be suitable for all investors, so please ensure that you fully understand the risks involved and seek independent advice if necessary.
Disclaimer:
The above opinions given constitute general market commentary, and do not constitute the opinion or advice of IC Markets or any form of personal or investment advice.
Any opinions, news, research, analyses, prices, other information, or links to third-party sites contained on this website are provided on an "as-is" basis, are intended only to be informative, is not an advice nor a recommendation, nor research, or a record of our trading prices, or an offer of, or solicitation for a transaction in any financial instrument and thus should not be treated as such. The information provided does not involve any specific investment objectives, financial situation and needs of any specific person who may receive it. Please be aware, that past performance is not a reliable indicator of future performance and/or results. Past Performance or Forward-looking scenarios based upon the reasonable beliefs of the third-party provider are not a guarantee of future performance. Actual results may differ materially from those anticipated in forward-looking or past performance statements. IC Markets makes no representation or warranty and assumes no liability as to the accuracy or completeness of the information provided, nor any loss arising from any investment based on a recommendation, forecast or any information supplied by any third-party.
USDX 1-Hour Timeframe – NFP 6 Jun 2025
Technical Analysis Report on USDX in Relation to the Non-Farm Payroll (NFP) Data – 6 June 2025
Tags: PEPPERSTONE:USDX

USDX-NEUTRAL BUY strategy Daily chart Reg.ChannelThe index is still under pressure, but am slightly cautious on SELL as we are near support 98.40 area, and as long it holds we should expect some recovery. Channel wise we have room further down.
Strategy BUY 98.60 - 98.75 and take profit near 99.75 for now. However, break below mentioned support opens 96.50 and lower.

Dollar Still making its way to our targetDollar is still drifting lower. We do have NFP Tomorrow so want to watch what it does. I think we might spike up to some LTF stops then droft lower to the target again. This is just experience speaking I have no idea what will happen. No one does!!!

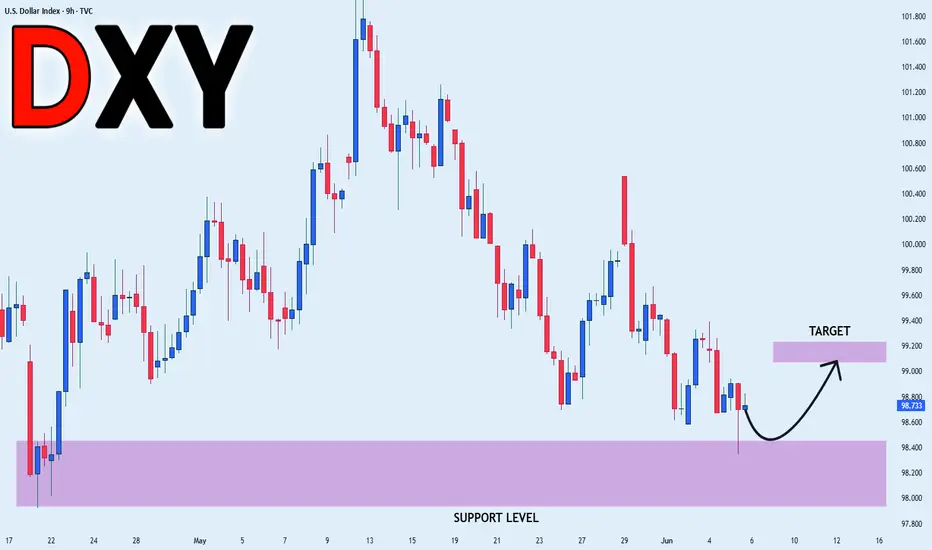
DXY POTENTIAL LONG|
✅DXY will soon retest a key support level of 98.000
So I think that the index will make a rebound
And go up to retest the supply level above at 99.088
LONG🚀
✅Like and subscribe to never miss a new idea!✅
Disclosure: I am part of Trade Nation's Influencer program and receive a monthly fee for using their TradingView charts in my analysis.
DOLLAR INDEX The higher-than-expected US Unemployment Claims (247K actual vs. 236K forecast) suggest emerging softness in the labor market, increasing the likelihood of Federal Reserve rate cuts in 2025. Here’s how this data impacts the Fed’s policy outlook:
Key Implications for the Fed
Labor Market Cooling:
The uptick in claims aligns with recent trends of slowing payroll growth (Q1 2025 average: 152K jobs/month vs. Q4 2024: 209K) and a stagnant unemployment rate near 4.2%.
Fed projections already anticipate unemployment stabilizing around 4.3% in 2025, but persistent claims increases could signal risks to their "maximum employment" mandate.
Rate Cut Probability:
The Fed has maintained rates at 4.25–4.50% since May 2025 but emphasized data dependence. Weak labor data strengthens the case for cuts, with markets now pricing in a ~60% chance of a September rate cut (up from ~50% pre-data).
The Fed’s March 2025 projections flagged rising unemployment as a risk, with some participants favoring earlier easing if labor conditions deteriorate.
Inflation Trade-Off:
While unemployment claims rose, wage growth remains elevated (ADP reported 4.5% YoY pay gains in May). The Fed will weigh labor softness against sticky inflation, particularly in services (ISM Prices Paid index at 68.7).
A cooling labor market could ease wage pressures, aiding the Fed’s inflation fight and enabling cuts without reigniting price spikes.
Market Impact
DXY (Dollar Index): Likely to weaken further as rate cut expectations rise. Immediate support at 98.40, with a break targeting 97.00
Equities/Gold: Potential gains as lower rates boost risk assets and non-yielding gold.
Bond Yields: 10-year Treasury yields may retreat below 4.40% if markets price in dovish Fed action.
What’s Next?
June 6 NFP Report: A weak jobs number (<150K) would solidify rate cut bets.
June 11 CPI Data: Lower inflation could give the Fed confidence to cut sooner.
Fed Decision (July 31): Odds of a cut rise if labor data continues to soften.
Conclusion
The Fed is likely to prioritize labor market stability over inflation concerns if unemployment claims persist above 240K. While a July cut remains possible, September is the most probable start date for easing, contingent on confirming data.
#DOLLAR #GOLD #DXY

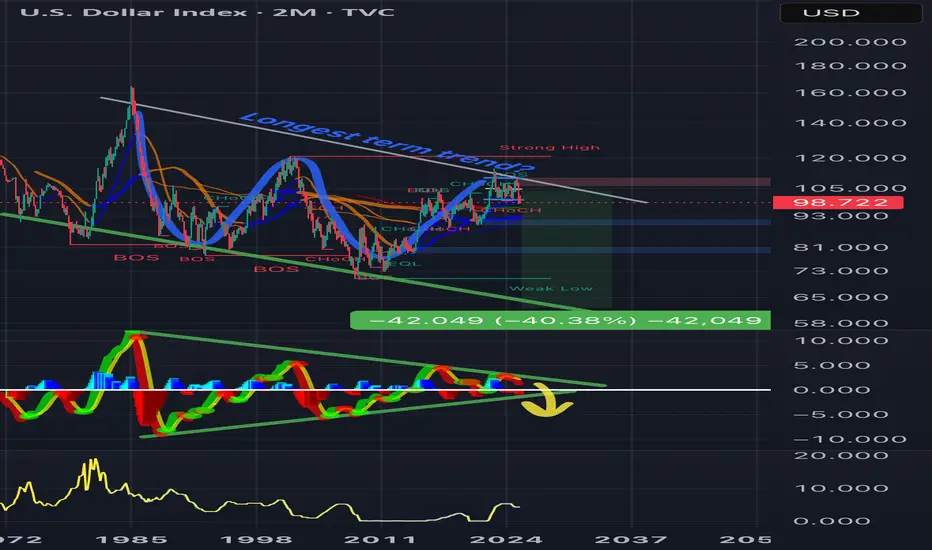
Bretton Woods 2.0?Examining the long-term trend of TVC:DXY since the 1980s, we might be facing a staggering 40% reduction in valuation, potentially landing us around 60. If the US were to devalue the dollar this drastically, could it effectively erase the national debt? 🤔 Is Trump bold enough to consider such a move?
We know the FED is going to cut eventually, the question is when and by how much? Initial claims came in higher than estimated, with cracks beginning to show in the labor market, how much longer can JPow hold out?
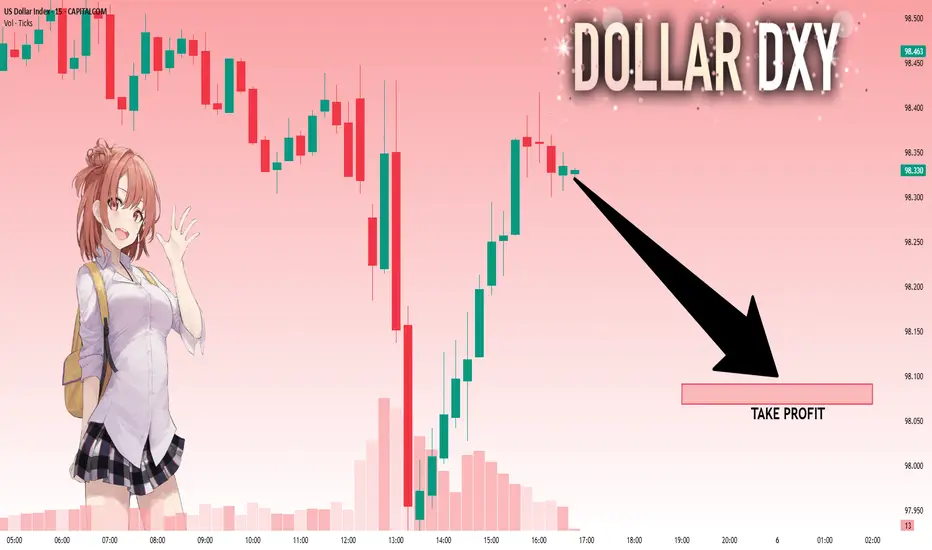
DXY: Local Bearish Bias! Short!
My dear friends,
Today we will analyse DXY together☺️
The market is at an inflection zone and price has now reached an area around 98.335 where previous reversals or breakouts have occurred.And a price reaction that we are seeing on multiple timeframes here could signal the next move down so we can enter on confirmation, and target the next key level of 98.090..Stop-loss is recommended beyond the inflection zone.
❤️Sending you lots of Love and Hugs❤️
DXY dumpsAll assets with the dollar pair will continue to grind higher including commodity .....while DXY dips lower

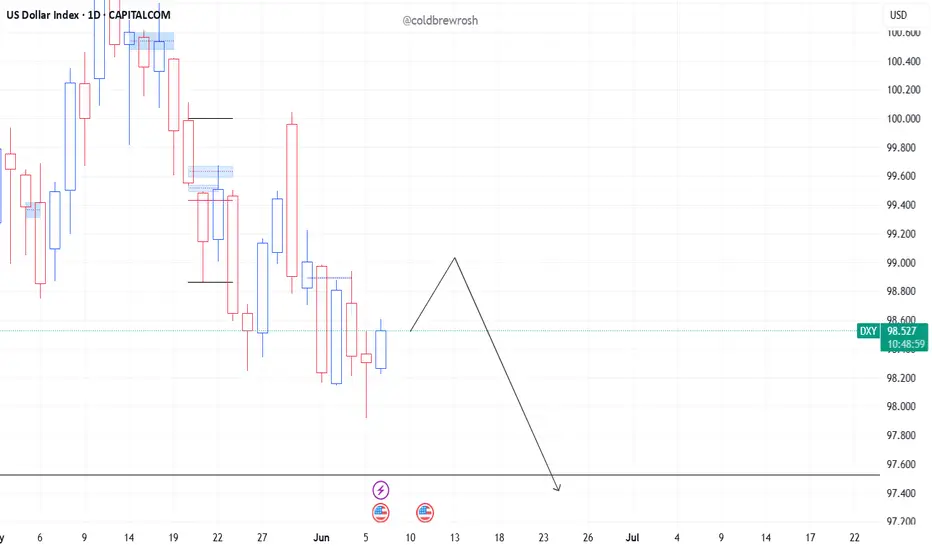
4 June 2025 DXY Bearish BIAS4 JUNE 2025
DXY Expected to be bearish, Price has retrace to 50% - 75% with a momentum bearish signal Expected DXY to Continue Bearish.
DXY Bearish :
SELL USDXXX atau Buy XXXUSD & GOLD

US DOLLAR SPECULATIVE OPINION.Greetings, At last price action seems to be drawn to the upside.
Multiple breaks of structure on the 30M and a liquidity sweep.
I further investigate..

DXYDXY price is near the support zone 98.74-97.87. If the price cannot break through the 97.87 level, it is expected that the price will rebound. Consider buying the red zone.
🔥Trading futures, forex, CFDs and stocks carries a risk of loss.
Please consider carefully whether such trading is suitable for you.
>>GooD Luck 😊
❤️ Like and subscribe to never miss a new idea!