TON New Update (1D)This analysis is an update of the analysis you see in the "Related publications" section
Since we started publishing a series of bearish analyses on TON, the coin has experienced a significant drop | despite the ongoing growth of the Telegram app and its expanding user base.
Before reaching the support zone mentioned in our previous analysis, a strong intermediate demand zone is visible along the way, located just below a notable liquidity pool. A solid bullish reaction is expected from this identified demand area.
Targets are clearly marked on the chart.
A daily candle close below the invalidation level will invalidate this analysis.
For risk management, please don't forget stop loss and capital management
When we reach the first target, save some profit and then change the stop to entry
Comment if you have any questions
Thank You
TONUSDT trade ideas

TONCOIN Preparing for Liftoff from the Golden Zone! Potential UpDetailed Breakdown:
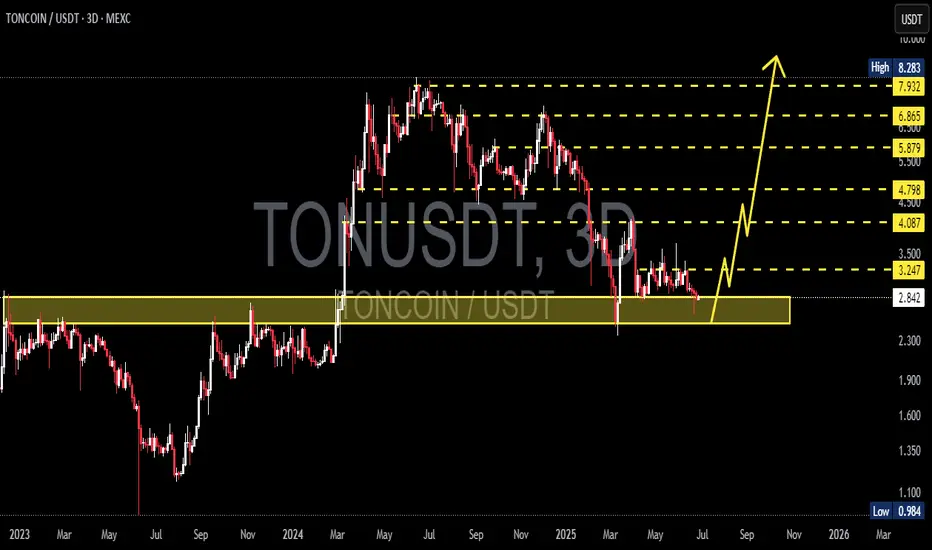
🔶 Major Support Zone (Golden Accumulation Area):
TON is currently trading within a strong support zone between 2.839 - 2.300, which previously acted as a key resistance throughout 2023. This zone now serves as a high-probability accumulation area.
🔶 Double Bottom Structure & Reversal Potential:
The price action is forming a potential double bottom pattern, often signaling a major reversal after a prolonged downtrend. This is also supported by sideways consolidation on the support with decreasing selling momentum.
🔶 Bullish Targets (Based on Fibonacci & Historical Resistance):
If a bounce occurs from this golden support area, TON could rally towards the following key resistance levels:
🎯 Target 1: 3.247
🎯 Target 2: 4.087
🎯 Target 3: 4.798
🎯 Target 4: 5.879
🎯 Target 5: 6.865
🎯 Target 6: 7.932
🎯 Ultimate Target (ATH): 8.283
🔶 Maximum Potential Upside:
From the current level (around 2.839) to the all-time high (8.283), TON presents a +190% upside opportunity in a full bullish scenario.
Trading Strategy:
✅ Buy Zone: Accumulate within the golden support box (2.3 - 2.8 USDT)
🔁 Additional Entry: Upon breakout confirmation above 3.25 USDT
❌ Stop Loss: Below 2.2 USDT with strong bearish volume
📈 Take Profit Levels: Use resistance levels as partial TP targets
Conclusion:
TONCOIN is positioned at a technically significant support area, offering a high-risk-reward opportunity for swing traders and mid-term investors. A bullish reaction from this zone could initiate a strong multi-wave rally. Watch for breakout confirmation with volume before entering aggressively.
#TON #TONCOIN #CryptoBreakout #AltcoinSetup #TONUSDT #SwingTrade #BullishPattern #CryptoSignals #FibonacciLevels #TechnicalAnalysis
TON It will grow soon...Do you think this will happen, or do you see TON below $2.5 in the future?
Best regards CobraVanguard.💚
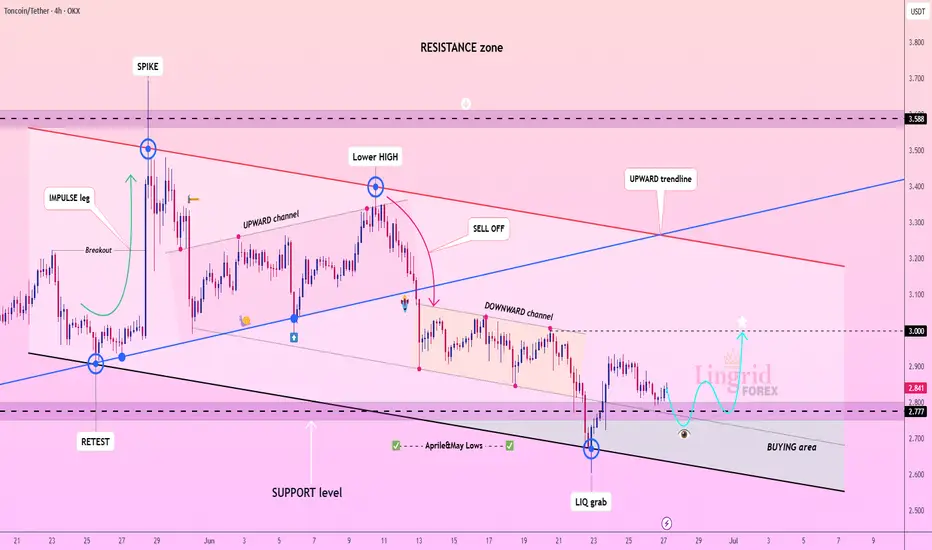
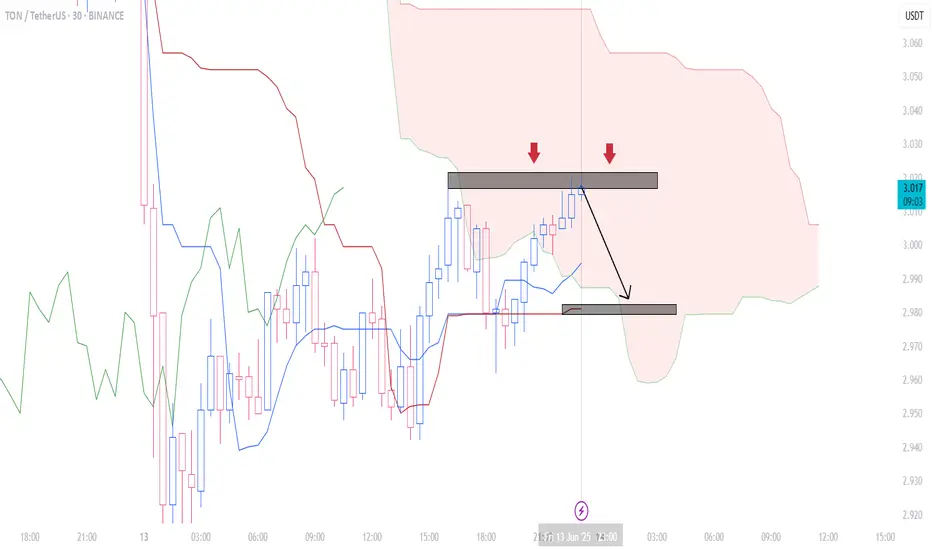
Lingrid | TONUSDT April-May Low Fake BreakoutOKX:TONUSDT is recovering after a liquidity grab near the April–May lows, bouncing from the lower boundary of the descending channel. The current move is stabilizing inside the BUYING area, suggesting accumulation and possible breakout preparation. If the 2.77 support holds, price may rally toward the 3.00 psychological barrier. A deeper dip below 2.77 would negate the bullish setup and reintroduce downside risks.
📈 Key Levels
Buy zone: 2.75–2.80
Sell trigger: sustained close below 2.75
Target: 3.00
Buy trigger: breakout above 2.90 with volume
💡 Risks
Low demand at the base could stall recovery
Failure to break out of the downward channel weakens upside case
Price rejection near 2.90 may trap early buyers
If this idea resonates with you or you have your own opinion, traders, hit the comments. I’m excited to read your thoughts!
Toncoin Final Call: Last Chance For Bottom Prices (3-5X Lev Pos)The last 3D session that closed produced a major reversal signal and this is the last chance truly, the last opportunity; the final call. It is the final call to get Toncoin at low prices before a major bull market. It will be a massive bullish wave and this wave will reach new all-time highs and beyond during the price discovery phase.
This chart setup can be traded with leverage. Traders can use 3-5X leverage with very low risk. Spot traders can buy and hold and this will be one of the biggest projects in this cycle.
The pairs that moved weakly in the first bounce, 7-April, will do much better in this second jump. These pairs will also move fast and stronger compared to the ones that already moved strong between April and May.
There are many pairs and many projects. In each wave, a different set of pairs moves strong and becomes top performers. The ones that didn't move last time can move this time. Those that did move can move again but they tend to lag behind. The energy moves around the entire market and never gets stuck in one place.
Adapt and change. The market is always changing... Choose wisely.
This is a huge opportunity. It is time to trade.
Buy the bottom and hold; you will be happy with the results.
Namaste.
TONUSDT: Short the Rejection,Buy the Capitulation – A Dual-Level
📉 TONUSDT Technical Analysis – Trending in a Long-Term Descending Channel, Is the Ideal Short Entry Coming?
TONUSDT is currently trading inside a long-term descending channel, with clear bearish momentum dominating the structure.
🔻 Scenario 1 (Early & Risky Entry):
Traders may consider opening a short position from the current level, but this setup carries higher risk, as the price could still push upward toward the upper boundary of the channel.
Stop-loss level is clearly marked on the chart.
🧭 Scenario 2 (Smarter, Low-Risk Entry):
A more calculated approach is to wait for the price to revisit the upper resistance zone of the descending channel (marked as Entry 1 on the chart).
This zone offers a clean low-risk, high-reward short opportunity, with a tight stop-loss and excellent setup.
🎯 Defined Targets in This Analysis:
Target 1: The midline of the descending channel
Target 2: The bottom of the long-term descending channel
💎 Important Insight:
If this bearish scenario completes and the price reaches the bottom of the descending channel, that zone could be a prime buying opportunity for long-term holders.
Technically, it's a major support level and psychologically, it's where smart money often steps in.
⚠️ Disclaimer:
This is not financial advice. This analysis is for educational purposes only. Always wait for confirmation and apply strict risk management when trading.
📩 What’s your opinion on this setup? Do you agree with the short plan, or see another scenario unfolding? 👇
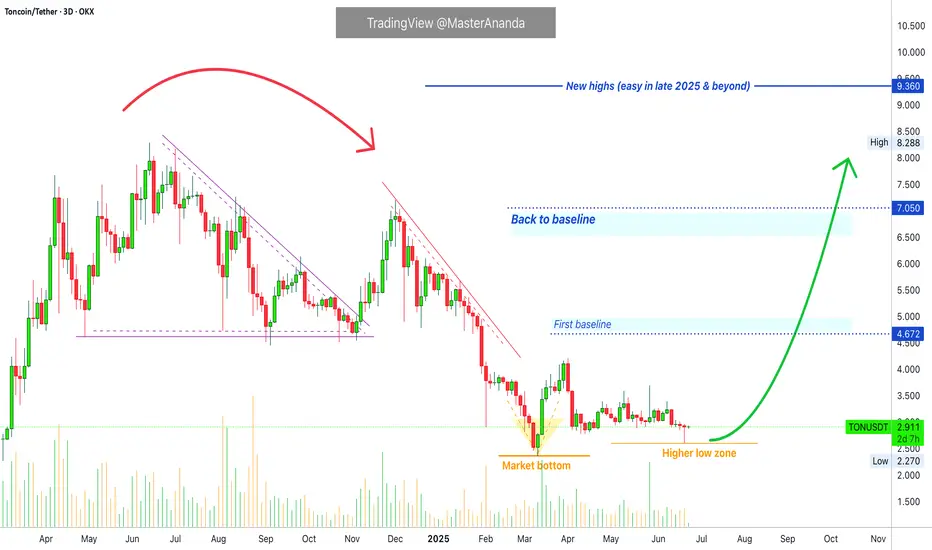
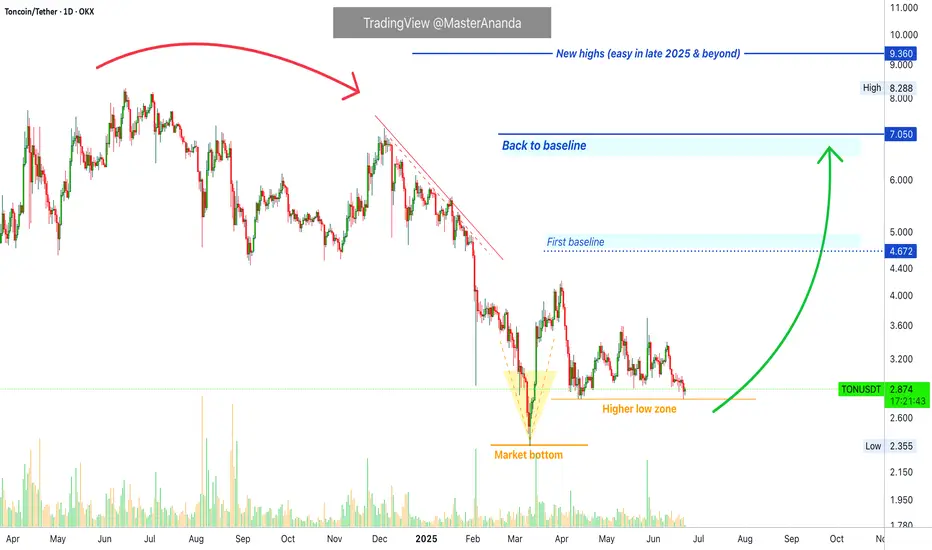
Toncoin, Bullish On Everything; We Will WinSee (or watch), Toncoin is consolidating the higher low. I think I need to use new/different words because repeating the same words will get you bored eventually. Ok, that doesn't matter since we are talking about money right? If my analysis ends up being positive and being a money maker, then we can accept repeating the same terms over and over, what do you say?
Sounds good to me; I hope it resonates with you.
Let us see if you can grasp the situation from my perspective.
When Toncoin peaked in April/June 2024 I told you the thing was going to "go back to baseline" and produce a crash and then consolidate at the lows, etc., before a new wave of growth was possible. This is happening now but the fact that it is happening now also means that the down-wave is over.
After the bearish move comes the bullish move.
You know, this bearish move took more than a year to complete so you might not even remember when I was sharing all those bearish charts. The bullish move is the same, by the time prices go up and the market becomes bearish again, you will forget that I was telling you "it is going up," when the action was happening at bottom prices.
Technical analysis —TONUSDT
Classic price dynamics are present on the chart. The bottom is hit 11-March and there is a very strong reaction supported by high volume. Then the market goes sideways within a higher low.
That's it, this is the last consolidation at low prices before maximum growth. That's just the way it is. The market goes down, the market goes up.
It peaked more than a year ago now, June 2024. That is a long time ago specially in Crypto-terms. Once the bottom is hit, the market recovers and goes on a bullish wave.
How long will it take? 2 months? 1 week? 2 weeks?
Doesn't matter; it is coming, it is sure, it is true, it is easy, we will win.
Namaste.
Lingrid | TONUSDT Mid-Term Market Structure AnalysisOKX:TONUSDT is holding just above the 2.82 support level while compressing into the apex of the downtrend and ascending support. Price action remains locked within a long accumulation range, but the bullish reaction near the black trendline hints at a potential reversal. A breakout above the downward trendline would expose 3.40 as the next resistance target.
📈 Key Levels
Buy zone: 2.80–2.83
Sell trigger: close below 2.81
Target: 3.40
Buy trigger: bullish breakout from descending trendline
💡 Risks
Rejection from the trendline may trigger a new test of 2.35
Market-wide weakness could delay breakout
Sideways range may persist if momentum fails to build
Traders, if you liked this idea or if you have your own opinion about it, write in the comments. I will be glad 👩💻
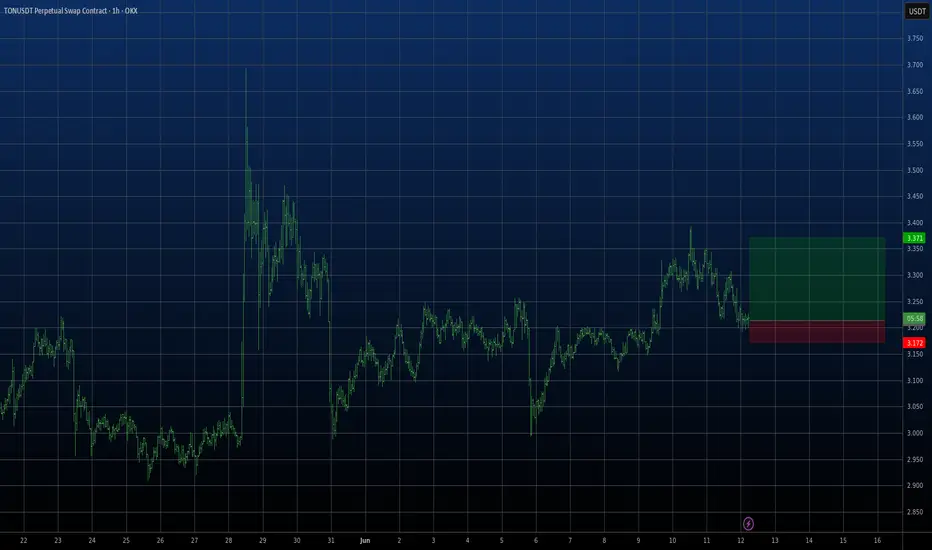
TON to $3.34? This Chart Pattern Could Deliver 12.88% GainsTON/USDT is currently showing promising signs of bullish momentum on the 4-hour chart. The most compelling reason to lean bullish is the consistent price behavior around the Key Support Zone near $2.899. Over several sessions, the price has tested this zone multiple times without any convincing breakdown. Each test resulted in a strong upward rebound, reinforcing the level’s significance. This repeated validation of support suggests that buyers are stepping in with confidence whenever the price revisits this area.
Looking at recent market structure, the price action is consolidating just above the key support level. Such sideways behavior above a major support zone often hints at accumulation. This means market participants could be preparing for an upward move, especially as there’s no sign of aggressive selling pressure. The market is essentially respecting this base, which strengthens the bullish case.
Above the current price, two resistance levels stand out. The first is around $3.240, which marks the mid-range from a previous consolidation and has acted as resistance in the past. If TON can push above this level, it would likely attract further bullish momentum. The second target is at $3.340, which is the most recent swing high. This level represents a clear take-profit area for swing traders and would complete a healthy retracement to previous highs.
Momentum indicators also align with the bullish sentiment. The MACD indicator shows a bullish crossover, with the MACD line crossing above the signal line. This crossover is happening near the zero line, which often marks the beginning of a strong directional move. Additionally, the histogram is flipping into green territory, suggesting that buying pressure is beginning to outweigh selling activity.
With this technical backdrop, a clear trade setup is present:
• Entry Level: Around $2.95–$2.96 (current price range above support)
• Stop Loss: $2.880 (just below the key support zone to minimize risk)
• Take Profit 1 (TP1): $3.240 (first resistance level)
• Take Profit 2 (TP2): $3.340 (recent local high)
The structure of this trade offers a risk-to-reward ratio of approximately 4.82, which is highly favorable for both swing traders and short-term bulls. The upside potential (~12.88%) vastly outweighs the downside risk (~2.67%). This type of asymmetry in trading setups is what experienced traders often look for — strong support, clear resistances, and momentum indicators confirming the direction.
Traders should also keep an eye on price behavior near $3.240. If the price struggles there, partial profit booking may be wise. On the other hand, a strong breakout above this zone could push TON swiftly toward the $3.340 mark. Volume will be a key factor to monitor — increasing volume on green candles would confirm institutional interest or broader market support behind the move.
In conclusion, the current chart setup on TON/USDT reflects a textbook bullish rebound scenario. With support holding firm, momentum building, and clean upside targets, this presents an attractive opportunity for a long position — especially for traders who favor structured and well-risked entries. The next 8–16 hours could be decisive in validating the move, so it’s worth watching this setup closely.

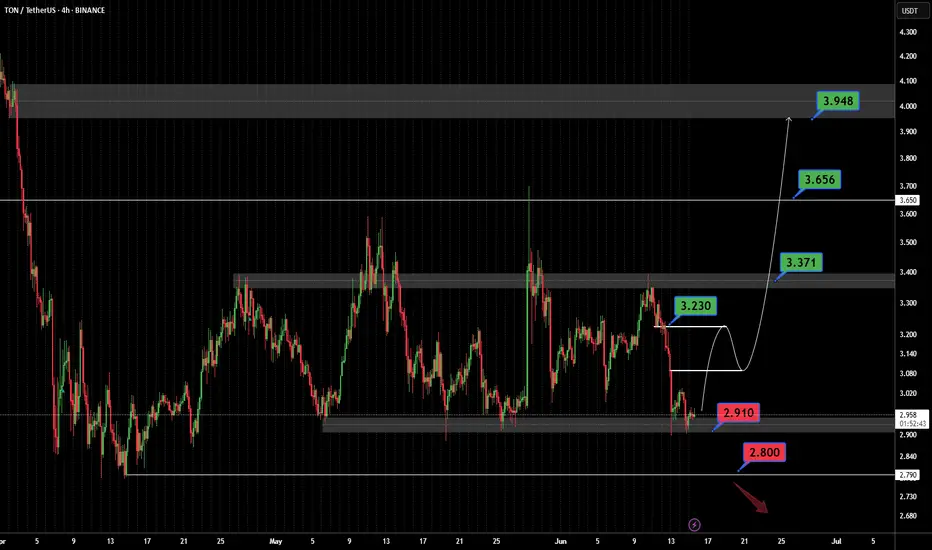
TONUSDT On the @TONUSDT chart, price is currently making a corrective move after reacting to the key support at 2.800. It may rise toward the 3.230 resistance and potentially break higher with a pullback to continue upward. However, if the 2.800 support fails, a deeper drop could follow. ⚠️📉
Resistances:
• 3.230 💥
• 3.371 🔼
• 3.656 🔼
• 3.948 🚀
Supports:
• 2.910 🛡️
• 2.800 🔻
⚠️Contorl Risk management for trades.
ton easy tradeThis is my first time using Ichimoku. Based on the levels created, I think the specified level will be touched soon. Let's sit back and watch.
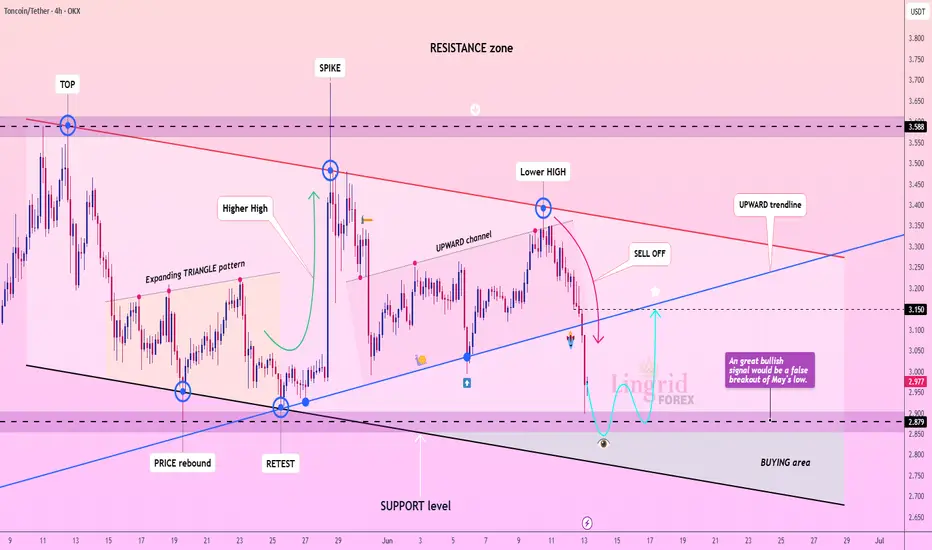
Lingrid | TONUSDT monthly Low Bounce OpportunityOKX:TONUSDT is undergoing a significant correction after forming a lower high near the 3.40 level, right under the red resistance trendline. The price has now broken below the upward channel, accelerating the sell-off toward the key support at 2.87. A false breakout below May’s low could act as a bullish trap and trigger a rebound back toward the 3.15 zone.
📈 Key Levels
Buy zone: 2.85–2.89
Sell trigger: confirmed breakdown below 2.87
Target: 3.15
Buy trigger: reclaim of 2.95 with bullish engulfing
💡 Risks
Continuation below 2.85 may invalidate bullish structure
Weak rebound could result in a lower high and further downtrend
Resistance at 3.15 remains firm and may cap upside potential
Traders, if you liked this idea or if you have your own opinion about it, write in the comments. I will be glad 👩💻
Good moment for Buy TONGood moment for Buy TON. We have small local down trend channel, but also it is low level of current "big" up trend channel. And this point can be used for good entry with good risk reward ration. Stop below of local down channel. Will see...
Phemex Analysis #89: Toncoin (TON) - Breakout or Breakdown?!Toncoin ( PHEMEX:TONUSDT.P ) has seen its price pull back to $3.22, marking a 60% decline from its all‑time high near $8.28 in June 2024. While this might raise concerns, the project’s fundamentals have been strengthening dramatically, validating long‑term optimism. Over the past month, TON has remained in a tight consolidation between roughly $3.50 and $2.88, often seen as the “calm before the storm.” This brings us to the key question: Is TON preparing for a breakout—or a breakdown?
Possible Scenarios
1. Breakout Rise
If TON rises convincingly above $3.50 with increasing volume, it could signal the end of consolidation and the start of a bullish rally. A breakout here could propel TON towards $4.21, unlocking a potential 40% upside.
Pro Tips:
Enter on a strong breakout above $3.50, ideally with volume exceeding recent averages.
For short term profit, aim for $4.21, $5.36 or $6.0.
2. Bearish Drop
If TON breaks below the $2.88 support level with increased volume, this could trigger a bearish reversal. A further breakdown toward $2.36 or lower price is possible as traders exit positions
Pro Tips:
Consider short positions if the drop occurs with significant volume.
For believers in TON’s long-term roadmap, $2.40 support zone could present a favorable accumulation zone.
3. Retest $2.35 Support
A third scenario involves TON dipping to $2.35–$2.40—where stronger foundation lies—before resuming upward momentum. A shallow retracement with declining volume would indicate a soft landing that sets the stage for another rally.
Pro Tips:
Observe volume closely; a low-volume drop often signals a drop with no follow-through.
Consider accumulating gradually at or just above this support range.
Conclusion
Toncoin is forming a classic “calm before the storm” pattern—tight consolidation backed by bullish fundamentals. Whether it breaks upward toward $4.50, dips toward $2.40, or holds within range changes how traders can approach risk and opportunity.
Prepare by:
Watching volume-driven breakouts above $3.50,
Planning entries or accumulations around $2.40,
And managing risk with tight stop-losses just beyond the consolidation boundaries.
With strategic planning, informed risk control, and attention to market cues, traders can position themselves to benefit from TON’s next major move.
🔥 Tips:
Armed Your Trading Arsenal with advanced tools like multiple watchlists, basket orders, and real-time strategy adjustments at Phemex. Our USDT-based scaled orders give you precise control over your risk, while iceberg orders provide stealthy execution.
Disclaimer: This is NOT financial or investment advice. Please conduct your own research (DYOR). Phemex is not responsible, directly or indirectly, for any damage or loss incurred or claimed to be caused by or in association with the use of or reliance on any content, goods, or services mentioned in this article.

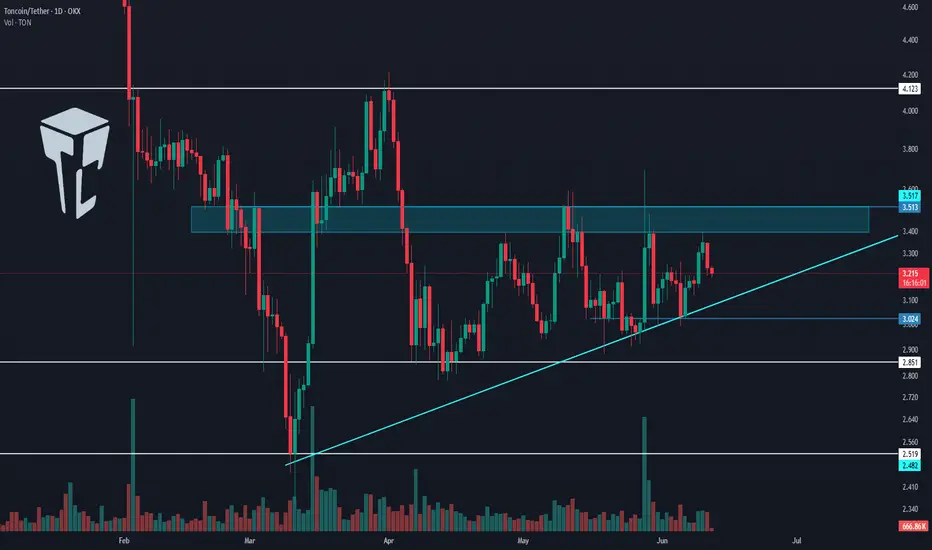
TradeCityPro | TON: Eyes Breakout from Daily Range Top👋 Welcome to TradeCity Pro!
In this analysis, I’m going to review the coin TON for you. The TON project is developed for Telegram and operates on a Layer One blockchain, enjoying significant popularity within the Telegram community.
✔️ The coin currently has a market cap of 7.95 billion dollars and ranks 18th on CoinMarketCap.
📅 Daily Timeframe
On the daily chart, as you can see, there’s a range box formed between the levels of 2.851 and 3.513, and price is oscillating between these two zones.
⚡️ I’ve marked the top of the box as a zone as well. This is a major supply zone, and a breakout above it could trigger a bullish trend.
🧩 Personally, I’m watching this coin closely. If buying volume enters and the trigger is activated, I’ll either enter a long position or buy it in spot.
📈 For a long position, the breakout of the 3.513 zone that I marked seems appropriate. If this zone breaks, we can open a long position.
🔍 The target for this position can be set around 4.123. This level is also a good spot trigger. If we enter a long at 3.513 and price moves up to 4.123, we can use the profit from the futures trade to buy this coin in spot.
✨ This way, we’ll have purchased a reasonable amount of the coin using profits, without needing any unusual risk or capital management because the capital was already managed beforehand.
📊 There’s also an ascending trendline visible on the chart that the price has responded to well. If the price gets rejected from the 3.513 zone and breaks this trendline, we can open a short position once the trendline trigger is activated, targeting the 3.024 and 2.851 levels.
📝 Final Thoughts
This analysis reflects our opinions and is not financial advice.
Share your thoughts in the comments, and don’t forget to share this analysis with your friends! ❤️
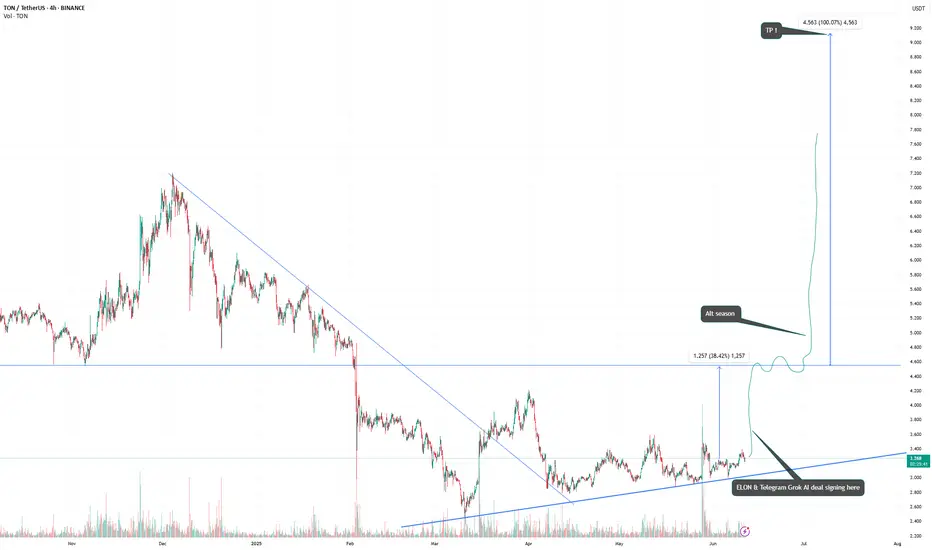
$TON is one of the best spot Bags for this cycleGROK AI & Telegram deal signing soon ... !
Alt season will bring it to 9$ !
We may see even as high as 13$ but i wont count on it
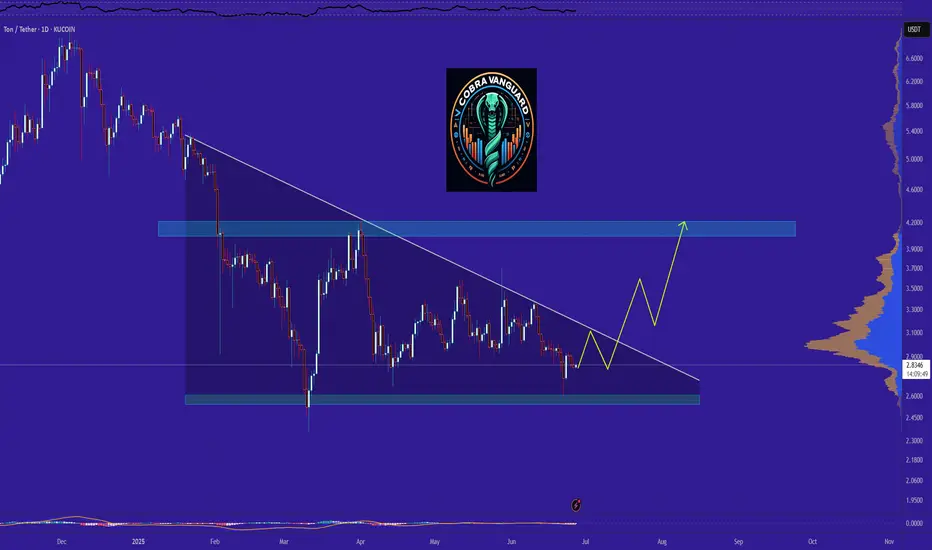
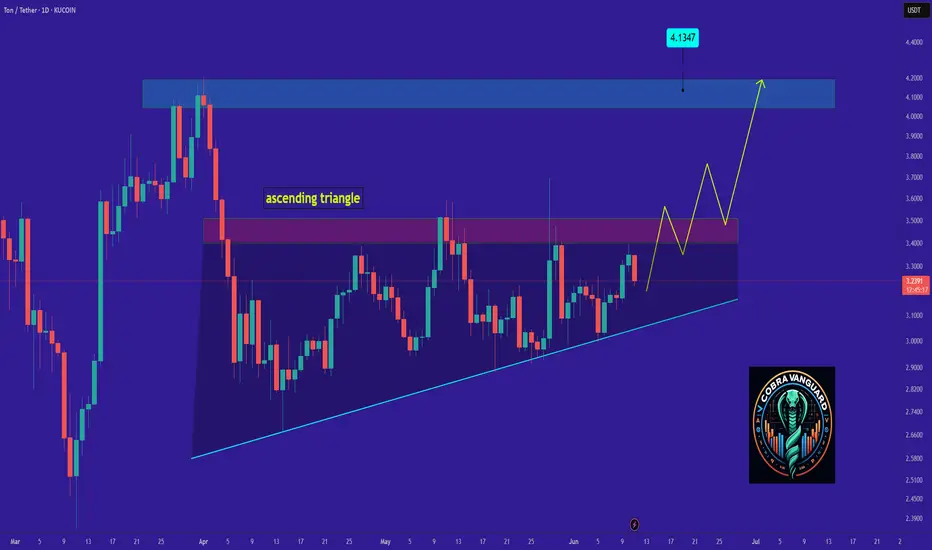
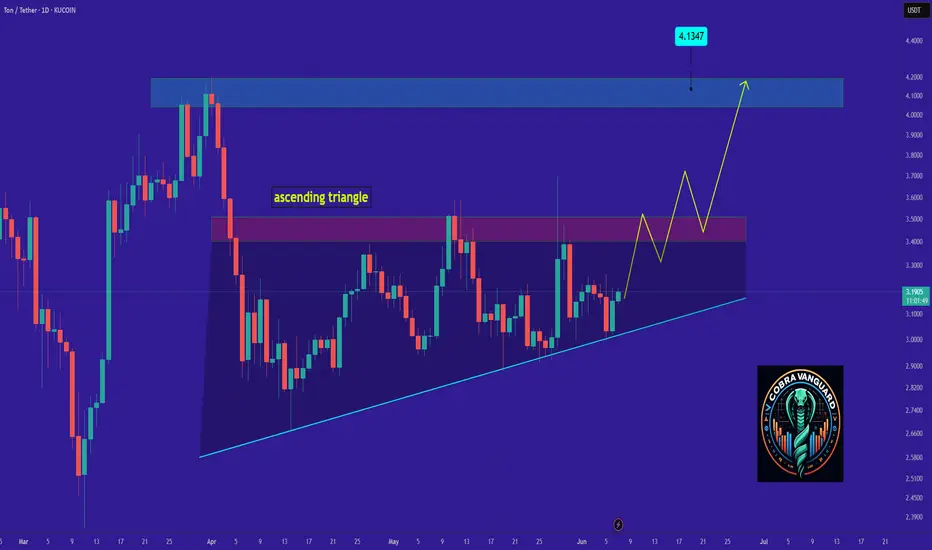
TON It will grow soon...Currently, TON is forming an ascending triangle, indicating a potential price increase. It is anticipated that the price could rise, aligning with the projected price movement (AB=CD).
However, it is crucial to wait for the triangle to break before taking any action.
Give me some energy !!
✨We spend hours finding potential opportunities and writing useful ideas, we would be happy if you support us.
Best regards CobraVanguard.💚
_ _ _ _ __ _ _ _ _ _ _ _ _ _ _ _ _ _ _ _ _ _ _ _ _ _ _ _ _ _ _ _
✅Thank you, and for more ideas, hit ❤️Like❤️ and 🌟Follow🌟!
⚠️Things can change...
The markets are always changing and even with all these signals, the market changes tend to be strong and fast!!
LIVE TRADEHello friends
Given the ascending channel that has formed, we can open positions with capital and risk management to move towards the specified goals.
*Trade safely with us*
TON It will grow soon...Currently, TON is forming an ascending triangle, indicating a potential price increase. It is anticipated that the price could rise, aligning with the projected price movement (AB=CD).
However, it is crucial to wait for the triangle to break before taking any action.
Give me some energy !!
✨We spend hours finding potential opportunities and writing useful ideas, we would be happy if you support us.
Best regards CobraVanguard.💚
_ _ _ _ __ _ _ _ _ _ _ _ _ _ _ _ _ _ _ _ _ _ _ _ _ _ _ _ _ _ _ _
✅Thank you, and for more ideas, hit ❤️Like❤️ and 🌟Follow🌟!
⚠️Things can change...
The markets are always changing and even with all these signals, the market changes tend to be strong and fast!!
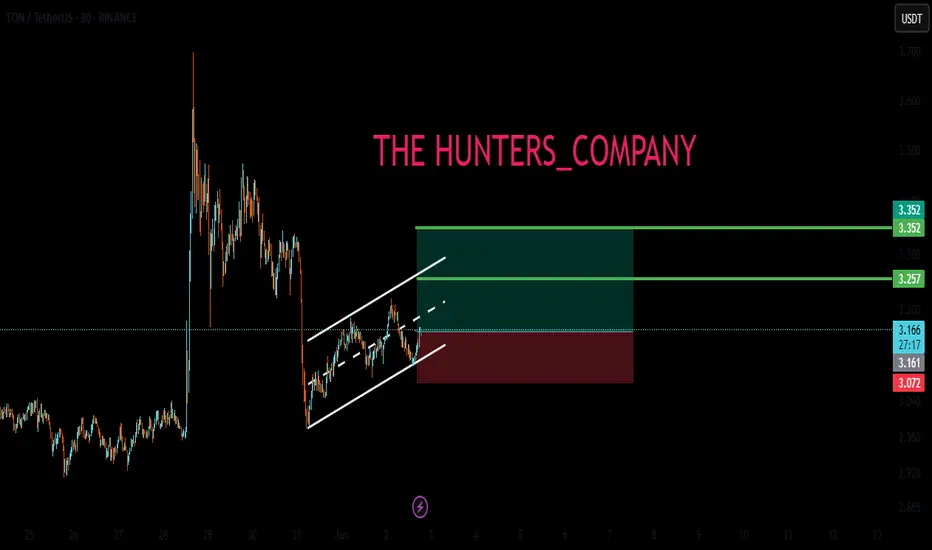
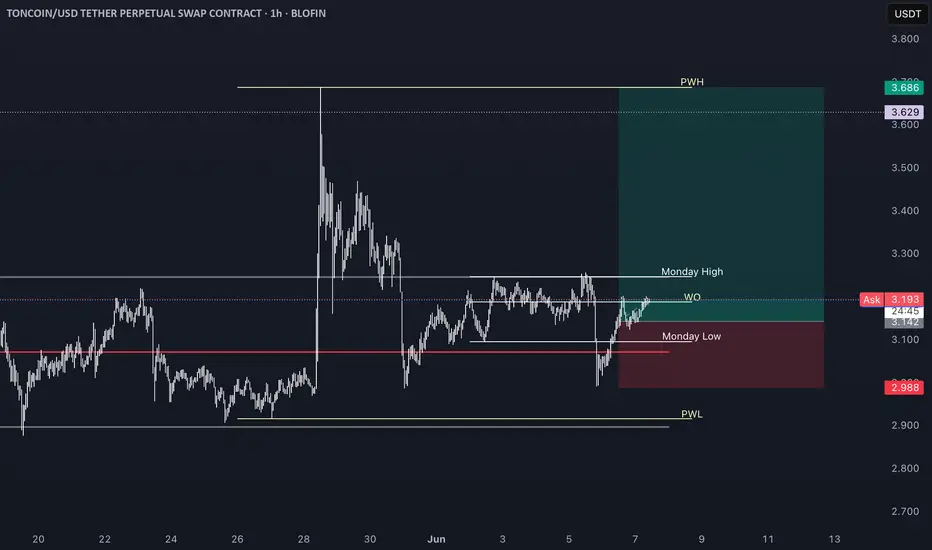
TON long shared as trade idea 6th June "TON in green chopping around weekly open, I think it will push to Monday highs than we see if higher"....
TON bouncing range mid, levels look good WO being reclaimed target range highs
Lingrid | TONUSDT Consolidating Within Defined Trading RangeOKX:TONUSDT is attempting a rebound from key support near 3.00$ after a sharp sell-off from the upper resistance area. The chart shows a higher low structure forming just above trendline support, hinting at a bullish reversal setup. If price holds this zone, a breakout through the descending trendline could trigger a run toward 3.320.
📈 Key Levels
Buy zone: 3.010–3.050
Buy trigger: breakout and close above 3.140
Target: 3.320
Sell trigger: drop below 3.000
💡 Risks
Failure to reclaim 3.140 keeps bearish pressure active
Breakdown of trendline may retest 2.824
Repeated rejections below 3.120 could delay breakout attempt
Traders, if you liked this idea or if you have your own opinion about it, write in the comments. I will be glad 👩💻
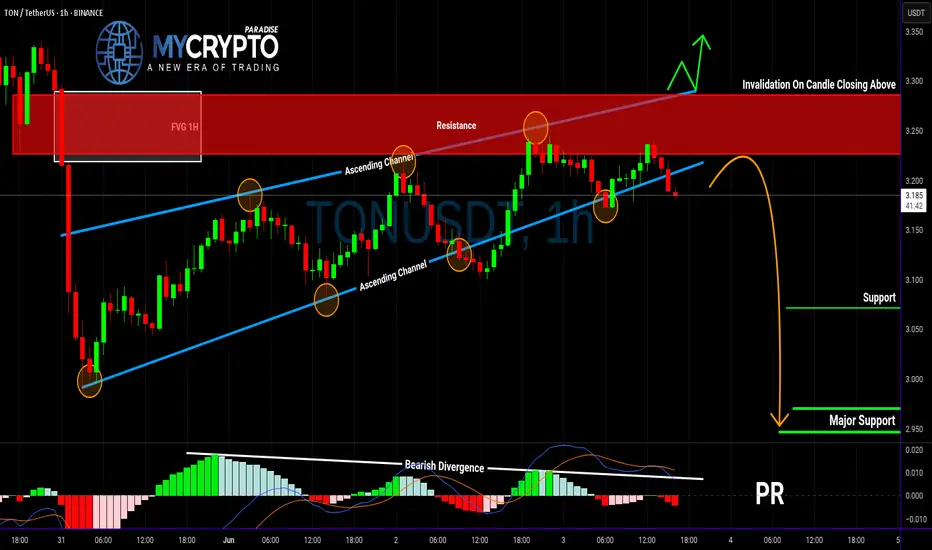
TON Looks Ready to Collapse — Is This the Start of a Bull Trap?Yello Paradisers! what if TON is about to reverse hard—are you positioned correctly, or will you be caught chasing the wrong move?
💎TONUSDT is showing clear bearish signs that can’t be ignored. The price has broken down from an ascending channel—a classic early signal of weakness. But that’s not all. This breakdown happened right at the resistance zone, and it’s backed by a clear bearish divergence on momentum indicators. Adding to the conviction, there’s a 1H Fair Value Gap (FVG) sitting right in that same region, which often acts as a magnet for price before continuation to the downside.
💎This confluence significantly increases the probability of a bearish move in the short term. So, what’s the plan?
💎For risk-averse (safe) traders, the optimal approach is to wait for a pullback and retest of the broken structure. This allows for a cleaner entry and a much better risk-to-reward (RR) ratio. For the aggressive players, there’s potential to enter with reduced size from the current level, understanding that it carries more risk without confirmation.
💎However, if the price manages to break out and closes candle above the resistance zone, this entire bearish setup becomes invalidated. In that case, the smart play is to stay patient and wait for a more favorable structure or price action to develop.
🎖If you want to be consistently profitable, you need to be extremely patient and always wait only for the best, highest probability trading opportunities.
MyCryptoParadise
iFeel the success🌴
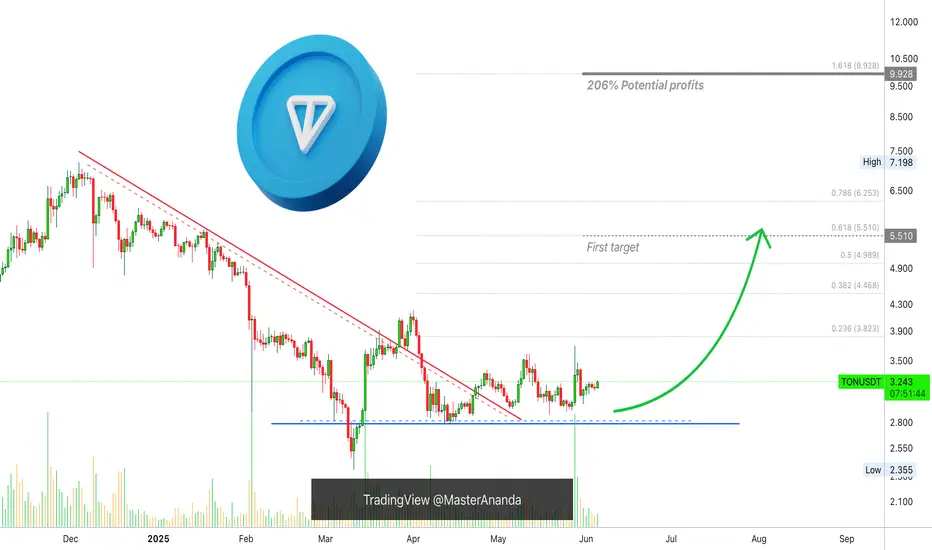
Toncoin Major Advance Now! New All-Time High Incoming (PP: 200%)Toncoin entered its current price range in February, four months ago. After some shaking, this project has been sideways and four months sideways is a very long time when it comes to Crypto, there is good news of course.
When the drop happened in March a bottom pattern was confirmed. A bottom means the bearish trend ends and the market prepares to change.
Just a few days ago, TONUSDT produced really high volume, signaling the start of a new uptrend, higher highs and higher lows.
This post is a friendly reminder just to let you know that Toncoin is about to go up and it will de so really strong.
The signals are in. Consolidation has been strong. The action is happening above support.
An advance now will be strong first, then fast, then slow followed by additional growth. I mean, the bullish action won't stop at $5.51 nor $10 ($9.92), it will continue growing, growth long-term. We are set to experience a new all-time high, the strongest bullish action in the history of Toncoin, it is starting now.
Thank you for reading.
Namaste.