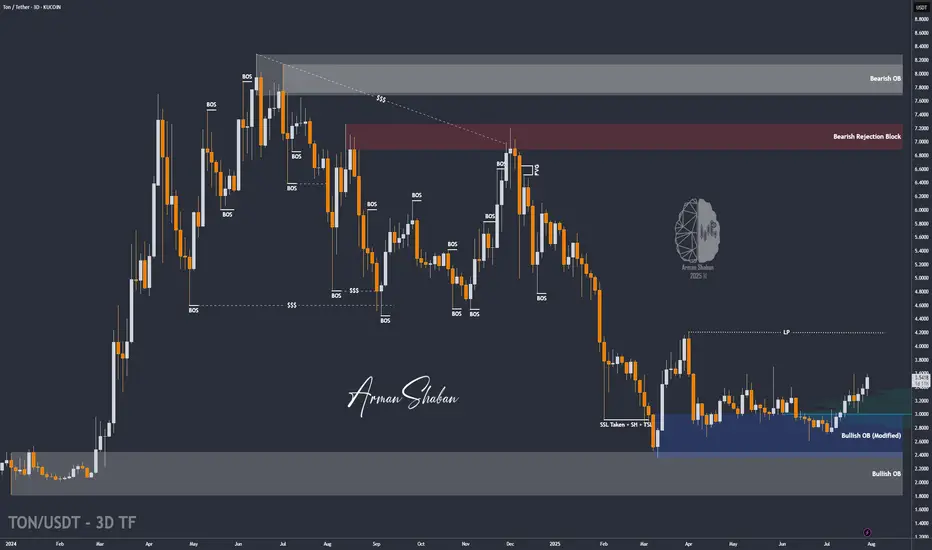
TON/USDT | Surges 18% – Eyes on $3.63, Then $4.20 and $4.68!By analyzing the Toncoin chart on the 3-day timeframe, we can see that after a pullback to the $3 area, strong demand kicked in, and within just one week, the price surged over 18%, reaching above $3.5. Toncoin is currently trading around $3.53, and I expect it to hit the $3.63 target soon. The next bullish targets after that are $4.20 and $4.68.
Please support me with your likes and comments to motivate me to share more analysis with you and share your opinion about the possible trend of this chart with me !
Best Regards , Arman Shaban
TONUST trade ideas
TON is bearish now and many Traders don't see it !The fact that most cryptocurrencies are bearish while Toncoin hasn't seen a significant drop yet is somewhat suspicious, and sooner or later, the price is likely to fall. I expect the price to be bearish by the start of the new week.

TONCOIN's Situation (4h) !!!The price is within an ascending triangle, which could be encouraging. However, since crypto doesn't always follow patterns, it might break down from below and correct to around $3.4
Best regards CobraVanguard.💚

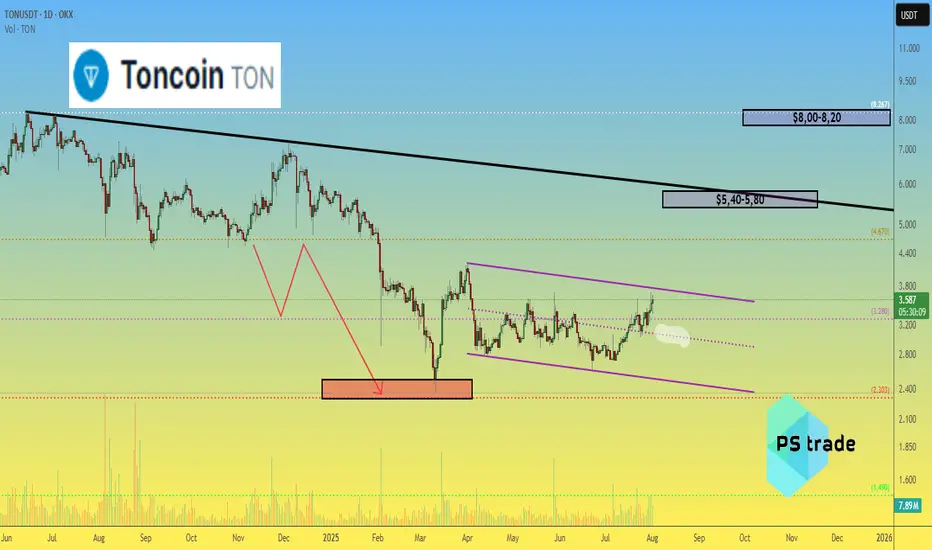
Toncoin TON price analysis💎 CRYPTOCAP:TON didn’t become a legend over the past 9 months — but at least our correction target of $2.30–2.50 played out with precision.
While most of the crypto market is currently going through a correction, #Toncoin keeps pushing upward. Still, we remain realistic:
🎯 First target: $5.40–5.80
🎯 Second target: $8.00–8.20
🚀 It’s not a “to the moon” scenario, but a potential 2x–3x from current levels is attractive.
The key support level OKX:TONUSDT remains at $3.00 — as long as it holds, the bullish trend remains valid.
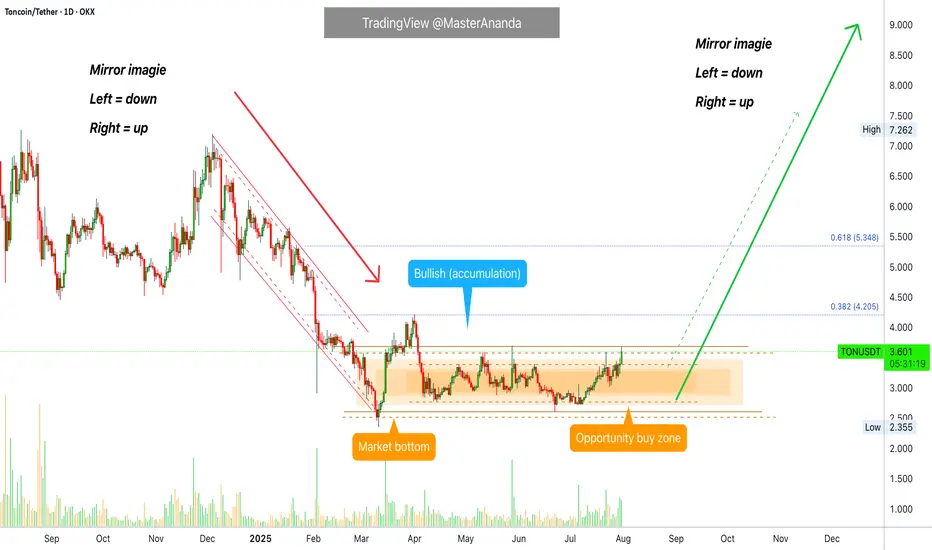
Toncoin Goes Bullish · 4X Leverage · Bottom Prices · OpportunityToncoin is breaking the sideways consolidation pattern. Today we have the highest price since late May, already two months ago, and rising volume. When you see how flat the action at the bottom is, you can tell how strong the bullish breakout that follows will me.
This is a friendly reminder because Toncoin will be huge in this altcoins market bullish cycle. I want you want you to be in, I want you to collect big projects, 1,000%+. That is why I am reminding you now. This trade setup can be approached both with leverage and spot, both options will do great.
After years of bearish action and months of consolidation, Toncoin is ready and the recovery is happening slowly but surely. Prices are rising slowly, no new lows. Prices are moving sideways but knowing the bottom is in the only logical conclusion is a break up. It is on the chart. It is inevitable, it is confirmed; profits and success.
Timing is really essential when trading. If you can get the right entry timing, a great price, trading becomes easy long-term. Once the bullish move shows up, you will be happy sitting in a strong position that only grows. That is because you bought the bottom. We are still looking at bottom prices, the last chance at the "opportunity buy zone."
We are doing 4X but we have positions with higher leverage from where prices were lower. You need to decide your own risk tolerance. If in doubt, zero leverage please. Only when you are 100% certain and you accept the full risk. The full risk is the liquidation of your position, all money gone. Are you ready to lose everything? If you are, better start trading spot. The chances of losing are very low. If prices drop, you get to pick a small paper loss and nothing more. Your number of altcoins stay the same. When the market starts to move, your money grows and the paper loss turns into a gain. You can't lose if you don't sell when prices are down. Buy when prices are low. Hold strong through the bullish wave. The time to buy is now. Buy and hold. You will be happy with the results.
Namaste.
Lingrid | TONUSDT Potential Long From the KEY ZoneThe price perfectly fulfilled my last idea . OKX:TONUSDT is pulling back from a fake breakout above 3.590 but holding within the boundaries of an upward channel. The price is approaching strong confluence support near 3.250, where both the trendline and horizontal zone align. A rebound from this level could launch a new bullish leg toward the resistance zone. Buyers will look for confirmation at the bounce area to aim for 3.590 and beyond.
📌 Key Levels
Buy zone: 3.250 – 3.300
Sell trigger: Break below 3.250
Target: 3.590 – 3.700
Buy trigger: Bullish engulfing or breakout from local consolidation near 3.300
💡 Risks
Loss of support at 3.250 trendline
Bearish pressure from broader market sentiment
Another fakeout or choppy move around 3.300–3.400 zone
If this idea resonates with you or you have your own opinion, traders, hit the comments. I’m excited to read your thoughts!

TONUSDT Forming Falling WedgeTONUSDT is forming a classic falling wedge pattern, which is widely recognized in technical analysis as a bullish reversal signal. After a period of consistent downward price compression, the narrowing structure on the chart signals that selling pressure may be weakening. This setup often precedes a significant bullish breakout, especially when accompanied by growing interest and steady volume—as is currently being seen in TON’s market behavior.
The fundamentals behind TON (The Open Network) are also strengthening, with increasing adoption across the Web3 ecosystem and a growing number of partnerships tied to Telegram's user base. The synergy between Telegram and the TON blockchain has created an environment where real-world utility is beginning to align with on-chain momentum. This alignment often catalyzes strong upward price moves, making TONUSDT one of the more promising altcoin setups in the current market landscape.
The expected gain of 140% to 150% from current levels is not just speculative—it aligns well with the technical breakout projection based on the wedge’s height and the last key swing high. If TON can maintain support above the lower boundary of the wedge while volume continues to increase, the likelihood of a breakout followed by a strong upward rally becomes much higher. Historical breakout moves from similar wedge patterns often show explosive growth in relatively short timeframes.
TONUSDT is a high-potential chart right now and should be closely monitored by traders and investors looking for large-cap altcoin opportunities with bullish technical setups. This could be the start of a major trend shift for TON, especially as broader crypto sentiment begins to tilt bullish again.
✅ Show your support by hitting the like button and
✅ Leaving a comment below! (What is You opinion about this Coin)
Your feedback and engagement keep me inspired to share more insightful market analysis with you!
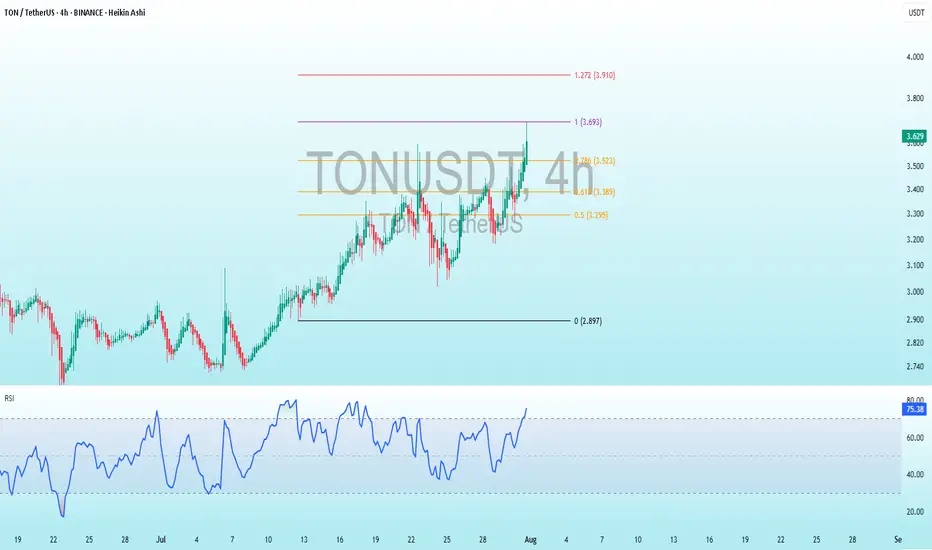
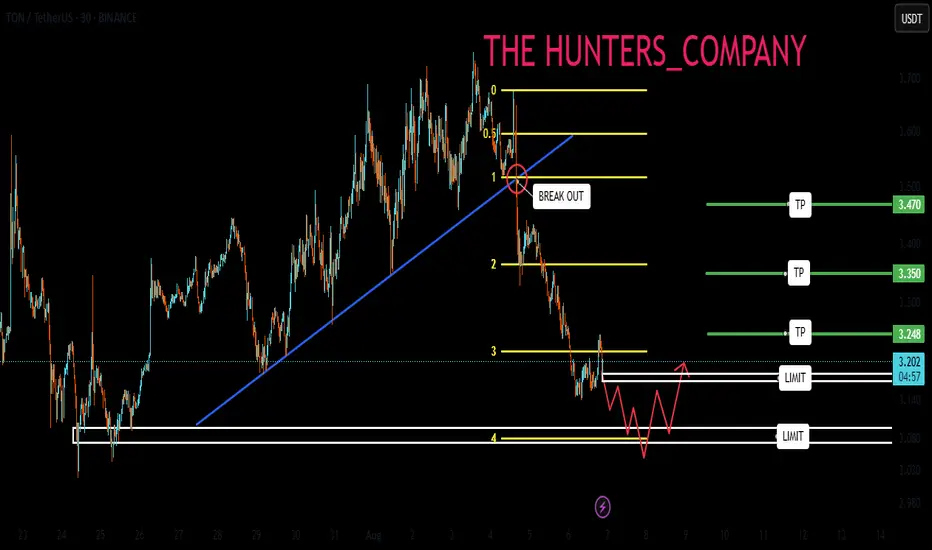
TON Bearish DivergenceBINANCE:TONUSDT
Trade Setup:
Target 1: 3.523 (0.786 Fibonnaci Golden Zone).
Target 2: 3.389 (0.618 Fibonnaci Golden Zone).
Target 3: 3.295 (0.786 Fibonnaci Golden Zone).
Target 4: 2.897 (0 Fibonnaci).
Stop Loss: 3.910 (1.272 Fibonnaci).
RSI Analysis: The RSI is showing a bullish divergence, suggesting potential bullish momentum. The current RSI is around 75.44, approaching overbuy territory, so caution is advised.
TON/USDT |Toncoin Pullback – Watching for Bounce Toward $4.20+By analyzing the Toncoin chart on the 3-day timeframe, we can see that after reaching $3.73, the price has entered a correction phase and is currently trading around $3.30. We should soon watch for a potential bullish reaction from the $3.03–$3.30 zone. If the next upward move begins, the bullish targets will be $3.74, $4.20, and $4.68.
Please support me with your likes and comments to motivate me to share more analysis with you and share your opinion about the possible trend of this chart with me !
Best Regards , Arman Shaban

TON/USDT - Bullish Channel in H4 (27.07.2025)The TON/USDT pair on the H4 timeframe presents a Potential Buying Opportunity due to a recent Formation of a Bullish Channel Pattern. This suggests a shift in momentum towards the upside and a higher likelihood of further advances in the coming Days.
Possible Long Trade:
Entry: Consider Entering A Long Position around Trendline Of The Pattern.
Target Levels:
1st Resistance – 3.770
2nd Resistance – 3.989
🎁 Please hit the like button and
🎁 Leave a comment to support for My Post !
Your likes and comments are incredibly motivating and will encourage me to share more analysis with you.
Best Regards, KABHI_TA_TRADING
Thank you.

Title: TON Eyes $5.50 After Breaking DowntrendAfter breaking its downtrend, TON Coin has set its sights on the $5.50 target. Potential resistance levels have been identified using volume analysis.

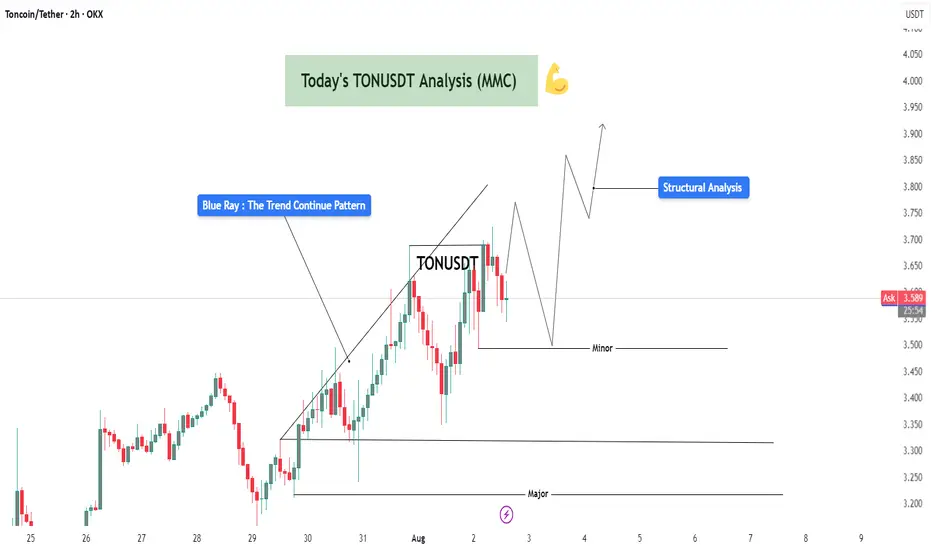
TONUSDT Bullish Structure Continuation – Minor Pullback Leg Up🧾 1. Overview of the Chart Setup:
The current TONUSDT (Toncoin/USDT) 2-hour chart exhibits a strong bullish market structure, characterized by a clear sequence of higher highs and higher lows. This confirms bullish momentum and suggests that the market is in a well-established uptrend.
The key highlight here is the "Blue Ray – Trend Continuation Pattern", which signals sustained bullish pressure following a clean breakout. This breakout was preceded by a consolidation phase, indicating accumulation by smart money before the expansion move.
🔍 2. Technical Structure and Pattern Breakdown:
🔵 Blue Ray – Trend Continuation Pattern:
This diagonal support trendline captured the initial breakout after the market bottomed near July 29–30.
Price respected this ascending line multiple times before accelerating, confirming bullish control.
Once the price broke above the previous swing high, it completed the pattern and triggered a momentum-driven rally.
🔲 Structural Zones – Major and Minor:
Minor Support Zone (~3.50 USDT):
Currently acting as short-term demand.
Price is showing early signs of rejection here, suggesting bulls may reload for a second impulsive move.
If this zone holds, we expect a new higher high to form, potentially targeting 3.80–4.00+ USDT.
Major Support Zone (~3.20–3.25 USDT):
Acts as long-term bullish defense.
In case of deeper retracement or shakeout, this is the key level to watch for possible trend continuation and re-entry.
📈 3. Structural Analysis and Price Projection:
The projected path on the chart shows a classic price action structure:
Impulse
Correction (toward minor support)
Next Impulse (break of recent high)
Higher low (continuation within trend channel)
Potential final push toward the 3.90–4.00 range
This type of Elliott Wave-inspired behavior suggests we're in wave 3 or 5 of a bullish sequence, with minor dips offering low-risk long setups.
📊 4. Candlestick & Market Behavior:
Recent candles show long lower wicks, suggesting buyers are stepping in during dips.
Bearish candles are relatively smaller and followed by immediate bullish response.
This indicates buy-the-dip sentiment, common in a trending market.
🔄 5. Trading Plan & Scenarios:
✅ Bullish Continuation (Base Case):
Wait for a clear bullish engulfing or price bounce at the minor support zone (~3.50 USDT).
Enter with confirmation: bullish candle close, volume spike, or trendline reaction.
Targets:
TP1: 3.80 USDT
TP2: 4.00–4.10 USDT
Stop Loss: Below 3.45 (or structure-based trailing stop)
⚠️ Bearish Case / Deeper Pullback:
If 3.50 fails, look for signs of accumulation around the major support (~3.20–3.25).
This zone can serve as the ultimate defense for trend continuation and provide a second long opportunity with better R:R.
🧠 6. Mindset for Traders:
Don’t chase: Let price come to your level, and focus on confirmation.
Trade with the trend: Structure supports bullish movement — trade in the direction of strength.
Use proper risk management: Define SL and TP before entering. Partial profits at key resistance zones are a smart strategy.
Avoid overtrading : Wait for structural retests or confirmation candles to stay on the right side of the market.
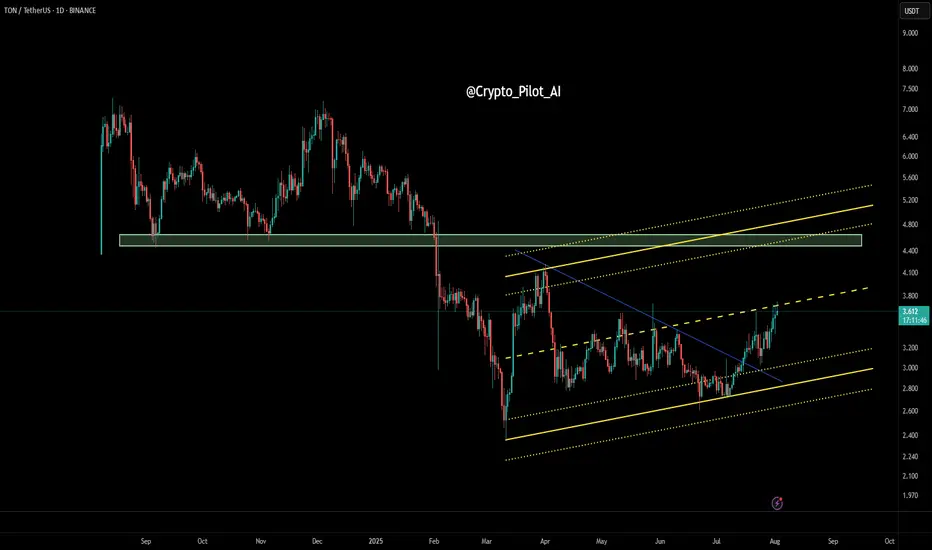
TON/USDT – Daily Price Action Analysis🔹 Price has broken a major descending trendline and entered an ascending channel.
🔹 Currently testing the mid-range resistance zone around $3.60 – $3.70.
🔹 If buyers hold above this area, the next targets could be $4.40 – $4.80.
🔹 If rejected, key supports are at $3.20 and $2.90.
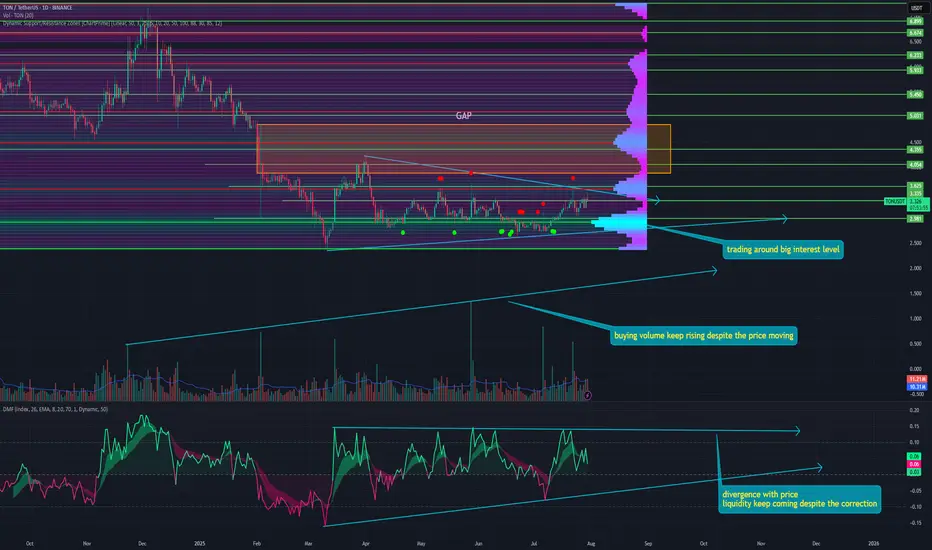
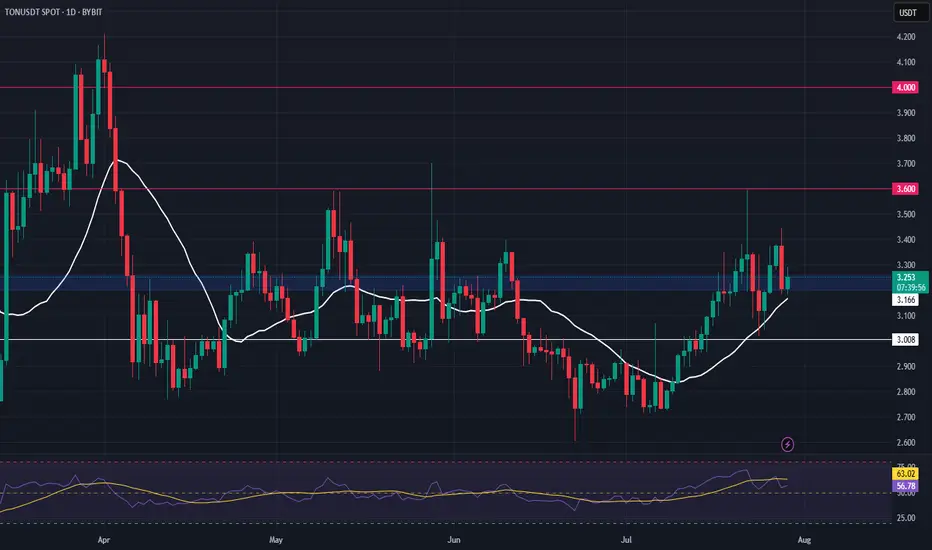
TON is coming back to lifeAfter its past hype on tap-to-earn games and Durov's arrest, many buried the project.
However, it has recently begun to show signs of life and actively develop its ecosystem. Looking at the chart in more detail, I noticed many interesting patterns:
➡️ First, regardless of whether the price of TON is moving up or down, purchase volumes have been growing for a year now. This indicates extremely high confidence in the token and the ecosystem.
➡️ Second, Money Flow also shows inflows of fresh liquidity starting in March 2025. This means that new holders have been entering the token for almost half a year.
There is also a partial divergence with the price, as a flag pattern has formed on the chart since then. At the same time, liquidity has remained virtually unchanged during this period, forming a flat pattern.
➡️ Thirdly, TON is currently trading around the largest support zone at $2.911. With each correction, it reaches this level again, triggering a huge number of limit orders to buy.
➡️ Fourth, during the correction, a GAP was formed at the top at $4.855 - $3.883. And as we know, 99% of GAPs close sooner or later.
📌 Conclusion:
Right now, the token is super undervalued, according to the market and me too. Plus, it's really far from its ATH and is still trading close to its all-time low.
All this makes it a promising asset to buy even right now, in the middle of alt season 🔥
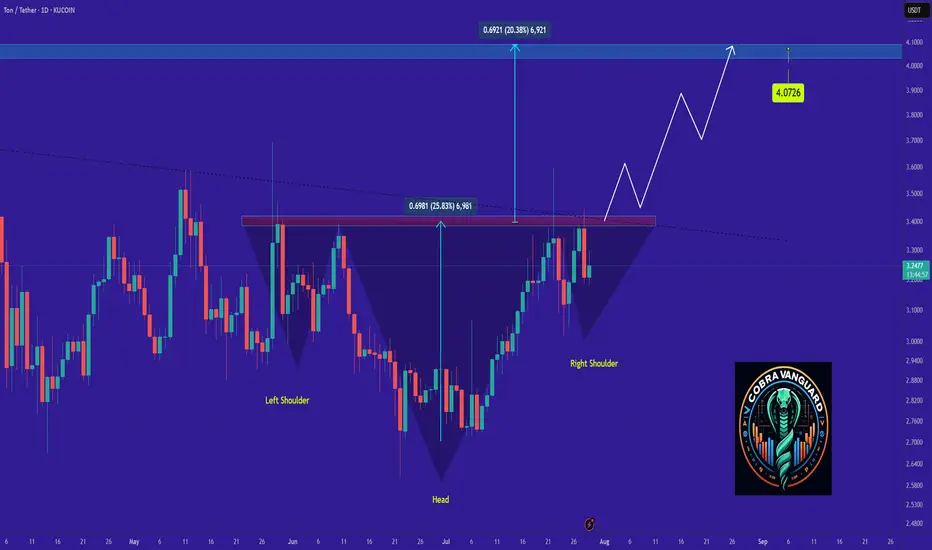
we shall see a good amount of increase in TON price !It seems the price is forming a head and shoulders pattern, which, if correct, suggests a good price increase in the coming days. However, we should wait for the pattern to fully complete.
Best regards CobraVanguard.💚
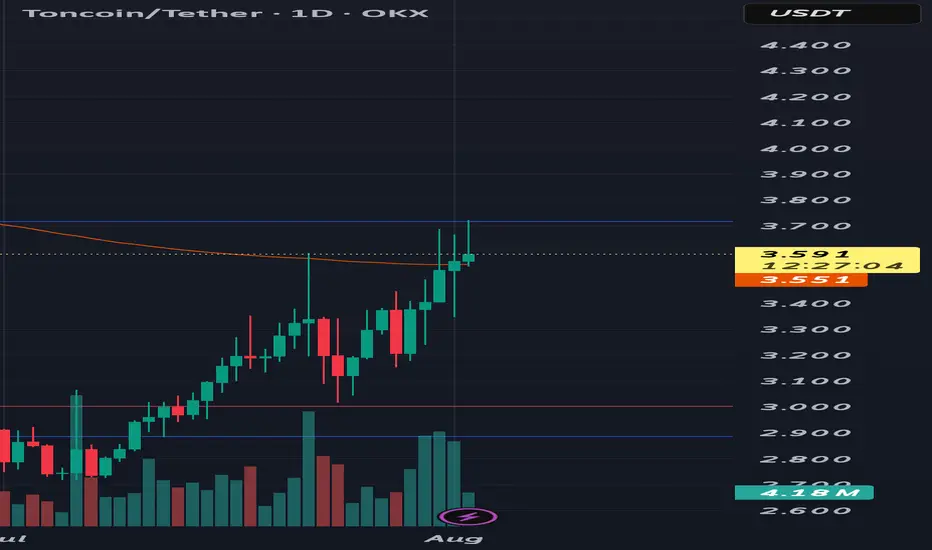
Up only desuTon has crashed a lot from its all time high and it seems to be rebounding now. Today will be the fifth daily green candles in a row and yesterday's daily closed above EMA 200
IN ADDITION TO THIS
Some bullish news for Ton i found from elfabot
The recent surge in CRYPTOCAP:TON price is primarily attributed to strong ecosystem activity, including significant NFT purchases by Pavel Durov (Telegram’s founder), such as buying a Plush Pepe NFT for 15,000 TON (about $53,000), which has boosted market confidence and demonstrated TON’s real-world utility. This has been widely discussed in the crypto community and cited as a bullish catalyst (source).
⦁ Additional bullish factors include Grayscale considering investment in TON, the launch of new Telegram NFT features, and US users being able to access TON Wallet directly inside Telegram without a VPN (source).
So, yea, i think we're breaking previous ATH and hitting $10 soon
cheers
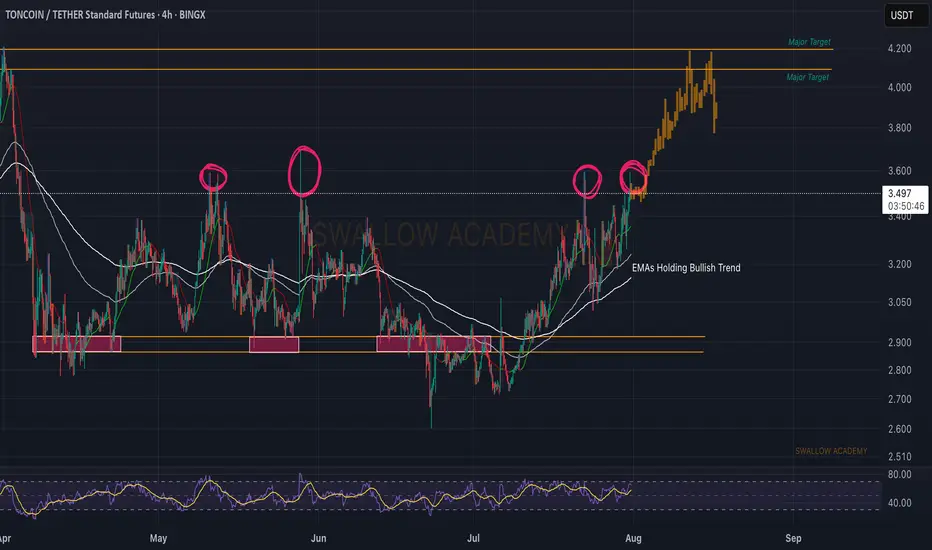
Toncoin (TON): Targeting $4.10TON coin looks still good; recently we filled one ofo ur targets and now price is near local liquidity area, which we intend to see to be broken and once we get that breakout, we are going to aim for the $4.10 area, so keep an eye on it for now
Swallow Academy
ton/usdt clear bullsih pattren dyor HERE u can get lot of help from here
TON/USDT a graphically bullish chart pattern and fundamentals are good
long term hodl good and futures 2-4x lev is enough for entire cucle here we can see a 70% potential in this
dis: im not finanicail advisor

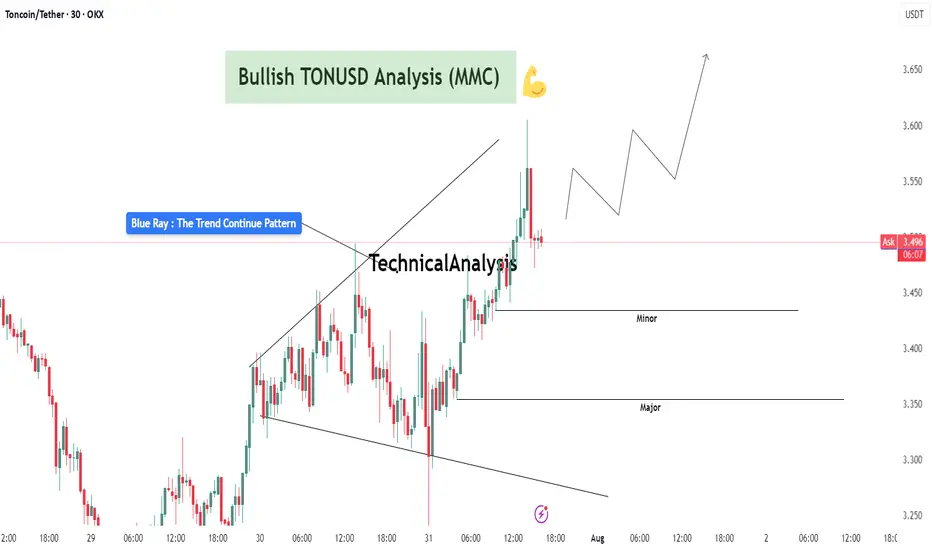
TONUSDT Analysis : Bullish Setup Breakout – Advanced MMC Analyze“Blue Ray Pattern Breakout Confirms Bullish Trend Continuation”
The 30-minute chart of TONUSDT highlights a clean and structured bullish setup based on the MMC (Mirror Market Concepts) methodology. The price action exhibits disciplined market behavior, respecting structural levels, breakout dynamics, and volume-based reactions.
🔷 1. Blue Ray Pattern – Trend Continuation Phase
This chart begins with the formation of the Blue Ray, a visual representation of trend consolidation and energy buildup. This pattern functions as a trend continuation flag or wedge. Prices compressed within a narrowing range, forming higher lows and lower highs, signaling accumulation under buyer control.
Once the pattern matured, we witnessed a decisive bullish breakout, where the price closed above resistance with conviction. This event marked a clear market intention shift and established a new impulsive leg.
🔍 2. Breakout Confirmation and Follow-Through
Post-breakout, TONUSDT experienced:
High-volume candles with elongated bodies, indicating increased buyer participation.
Immediate upside momentum that pushed the asset into a short-term overextended condition – often a healthy sign of strength when followed by a controlled pullback.
The breakout wasn’t just a false move – it was sustained, and the price held above the broken structure, proving that supply was absorbed and buyers were dominant.
🔑 3. Demand Zones (Minor and Major)
Two key MMC demand zones are highlighted:
🔹 Minor Demand Zone (~3.43–3.45):
This is the most immediate support and current price is hovering just above it. It's the first zone of interest for buyers and may serve as a re-entry or scaling point.
🔸 Major Demand Zone (~3.34–3.36):
In case of deeper retracement or volatility, this zone is expected to act as a strong bounce region based on past structure and MMC’s reversal logic. Price memory here suggests accumulation or reactive interest.
📐 4. Structure, Momentum, and Higher Timeframe Confluence
TONUSDT is in a confirmed uptrend, forming a clear sequence of higher highs and higher lows.
The structure supports a bullish flag breakout with minimal overhead resistance.
The projected path drawn on the chart illustrates a stair-stepping price pattern with continuation toward 3.60–3.70, if current levels hold.
📊 5. MMC Strategy Bias – Bullish
Using the MMC lens:
Blue Ray breakout confirms continuation
Volume absorption succeeded at the base of the flag
No signs of dominant supply entering post-breakout
Wave projection supports ongoing momentum
Structure favors buying dips, not shorting spikes
💡 Trader’s Takeaway:
TONUSDT is providing a textbook bullish opportunity under the MMC framework. As long as price stays above the Minor Demand Zone, continuation upward toward 3.60 and beyond remains in play. If price dips to the Major Zone, watch for strong buyer reactions for fresh entries.
Ideal for MMC traders and technical analysts looking to align with structured, logic-based entries and exits. This setup reflects market strength, technical clarity, and volume confirmation – a powerful trio for continuation plays.
TON : Does the TON ecosystem have growth potential?Hello friends🙌
✅Given the decline we had in the entire market, TON was no exception and had a decline that has plunged the market into fear as to whether the decline will continue or whether the price will finally grow.
✅Well, as you can see, there is still no sign of serious buyers on the chart, and we are planning based on observations, not assumptions...
✅In this chart, the price is likely to move to the support area specified by Fibonacci and buyers will show their support, but what is the best way?
✅The best way to buy safely and with capital and risk management is in steps, where we have specified the purchase steps for you and the goals are also specified.
🔥Follow us for more signals🔥
*Trade safely with us*
TON Swing Trade – Support Zone in FocusTON is holding a major support level, setting up for a potential bounce. With structure intact, this offers a favorable long entry for swing traders looking to capitalize on the next leg up.
📌 Trade Setup:
• Entry Zone: $3.20 – $3.35
• Take Profit Targets:
o 🥇 $3.60
o 🥈 $4.00
• Stop Loss: $3.088
Toncoin (TON): Good Opportunity For Long Position | Good R:RToncoin is still looking good for upward movement, despite it moving rather sideways since the last time we checked the coin.
More in-depth info is in the video—enjoy!
Swallow Academy

TONUSDT Bullish Reversal from Demand with QFL Base | MMC Setup📊 Technical Breakdown – 4H Chart
✅ Overview
TON/USDT is exhibiting early signs of a bullish reversal after a structured decline into a key smart money demand zone. The setup reflects multiple layers of confirmation—QFL base, multi-supply absorption, liquidity inefficiencies, and a positive reversal pattern—suggesting a high-probability opportunity for upside.
🔹 1. Impulsive Move & Liquidity Sweep
Price rallied aggressively on July 22–23, pushing toward $3.60, breaking short-term highs and triggering liquidity grabs above recent consolidation zones.
This surge absorbed significant buy-side liquidity, leaving a supply zone behind, now marked as the Next Reversal Zone.
After liquidity was collected and orders filled, the market reversed sharply, consistent with institutional profit-taking or engineered liquidation traps.
🧠 Smart Money Insight: Institutions often push price into illiquid zones (above highs) to trap retail and fill large orders. This marks the first phase of the trap.
🔻 2. QFL Base and Multi-Supply Absorption
The price structure created a Quick Flip Level (QFL) — a smart money concept where price forms a base, drops, then rallies, leaving behind an institutional demand zone.
The current pullback has revisited this exact QFL base, now reinforced by 3x supply absorption, enhancing the zone's strength.
This confluence increases the probability of a strong reaction to the upside from this level.
📌 Note: The “If Cross 3x Supply” label shows that this zone has absorbed multiple attempts to break down. It's now acting as a demand pocket.
🔄 3. Reversal Area – The Engine Room of Smart Money
The Reversal Area is carefully marked at $3.20–$3.28 — the ideal discounted price zone where large buyers tend to step in.
This zone is structurally important:
Past breakout level
Aligned with QFL base
Beneath stop levels of breakout traders
A Positive Pattern has now formed within this area—likely a bullish engulfing, morning star, or pin bar, depending on candle confirmation.
📌 Psychology: This zone acts as a trap. Retail traders often panic sell here, while smart money accumulates quietly before launching price upward again.
🧭 4. Dual Scenario Structure – Projected Paths
You’ve beautifully mapped two valid future price scenarios based on reaction to the Central Reversal Zone (~$3.35):
🔵 Scenario 1 – Healthy Pullback Before Continuation
Price climbs toward the central zone, then pulls back slightly to retest support near $3.28–$3.30 (label 1).
This allows further accumulation before price breaks higher.
This is a safer re-entry scenario for patient traders looking for a retest.
🟢 Scenario 2 – Direct Impulsive Rally to Next Reversal Zone
Price continues with bullish momentum, slicing through $3.35 and aiming for the Next Reversal Zone at $3.52–$3.60 (label 2).
This zone contains remaining liquidity, left uncollected from the previous impulse.
Price is likely to reverse or pause at this level again due to heavy supply.
📌 Key Tip: If price reaches that zone without significant resistance or exhaustion, it may signal continuation potential with minor corrections.
💼 Strategic Trade Plan (High-Probability Setup)
Entry Zone: $3.20 – $3.28 (Reversal Area)
Stop-Loss: Below $3.15 (beneath structure + QFL base invalidation)
Target 1: $3.35 (Central Reversal Zone)
Target 2: $3.52–$3.60 (Liquidity Completion & Next Reversal Zone)
🧮 Risk-Reward Estimate:
Conservative: 1:1.8
Aggressive: 1:2.5 or better if price reaches high liquidity zone.
🔄 MMC Flow Summary – What the Market Makers Are Doing:
Create a trap at the top (collect liquidity and fake the trend)
Force price down into demand (scare retail + grab stops)
Absorb sell orders in bulk at QFL/demand zone
Form bullish reversal pattern (positive structure)
Push price upward again, aiming for uncollected liquidity above
📌 This is a classic MMC cycle — engineered by large players, and now you’re aligned with their strategy.
🧠 Why This Matters
This chart isn’t just about entry and exit; it’s about understanding the underlying psychology and structure. By aligning with the smart money footprint — QFL, supply absorption, and liquidity targeting — you're maximizing edge and minimizing guesswork.
