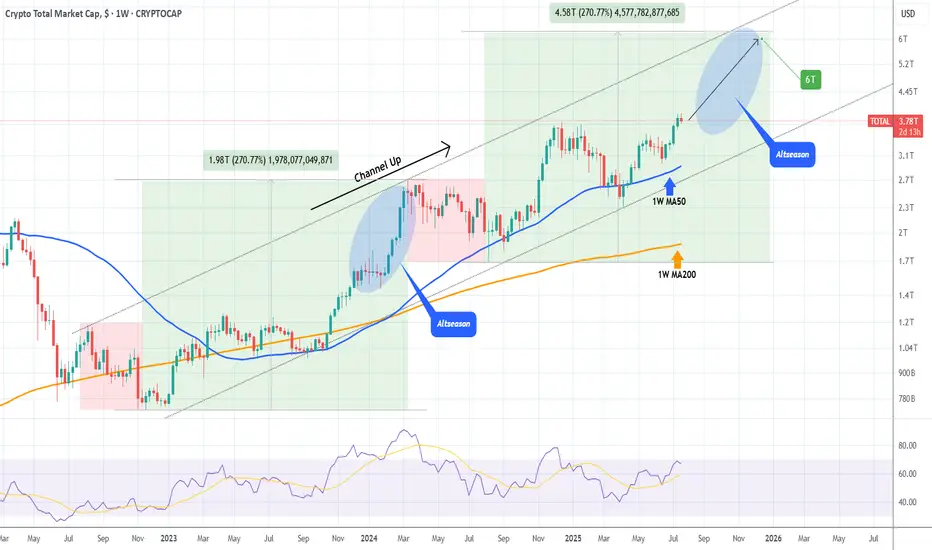
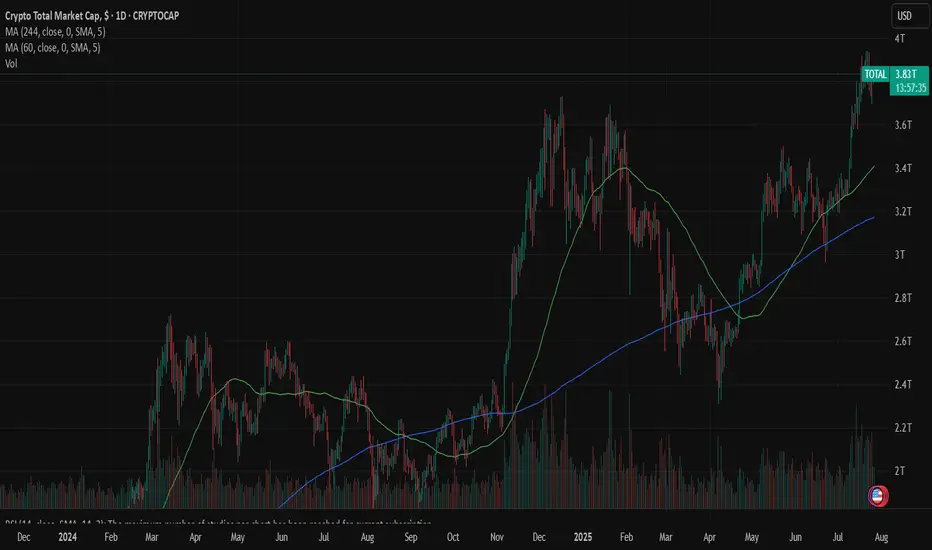
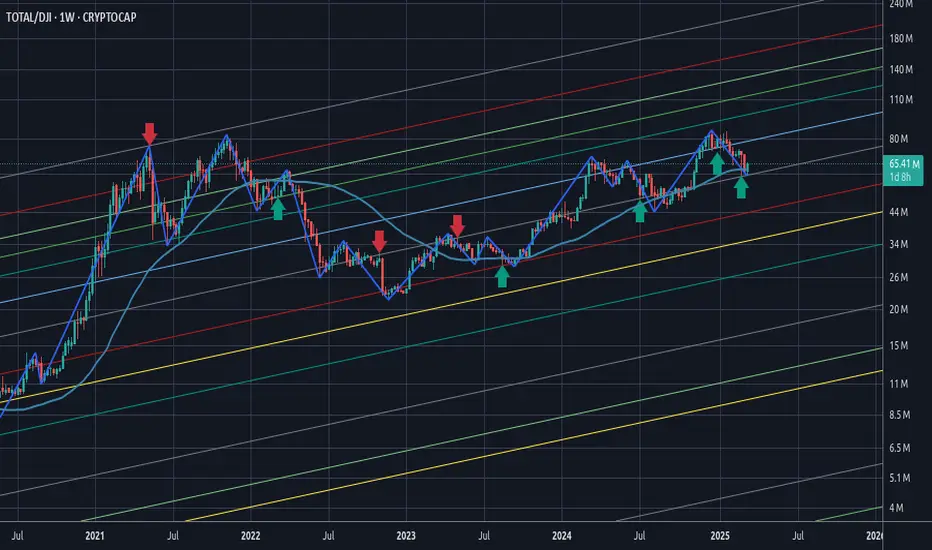
TOTAL CRYPTO MARKET CAP expected to hit $6 Trillion!The Crypto Total Market Cap (TOTAL) has been on a Channel Up since the 2022 market bottom and since the April 07 2025 Low (Higher Low for the pattern), it's initiated the new Bullish Leg, already turning the 1W MA50 (blue trend-line) into Support.
As long as this holds, we expect it to complete a +
Key data points
Previous close
—
Open
—
Day's range
—
About Crypto Total Market Cap, $
A prepared trader is defined by their ability to see a bigger picture of a market. It applies to crypto traders too — if you agree, we've prepared a chart that will let you see the whole crypto market from a bird's-eye view. It shows total crypto market cap, which is calculated by TradingView by adding up top 125 coins market caps, which, in their turn, are the number of coins times their current price. A growing market cap can indicate investors' interest and their positive evaluation of the current market state. For you it might be a good indicator of where the wind blows and whether digital coins are a good investment tool.
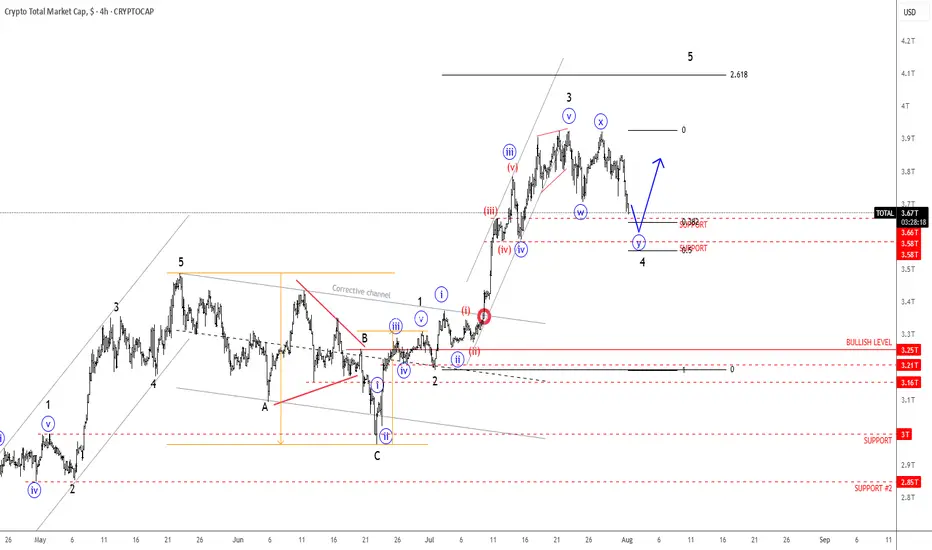
Crypto Market Slows Down For A Pullback Within A Bullish TrendGood morning Crypto traders! Cryptocurrencies are coming slightly lower on the intraday basis due to stock market decline yesterday, but we still see them approaching support, so still be aware of a bounce and recovery at the end of the week or maybe next week because of an upcoming weekend. Crypto
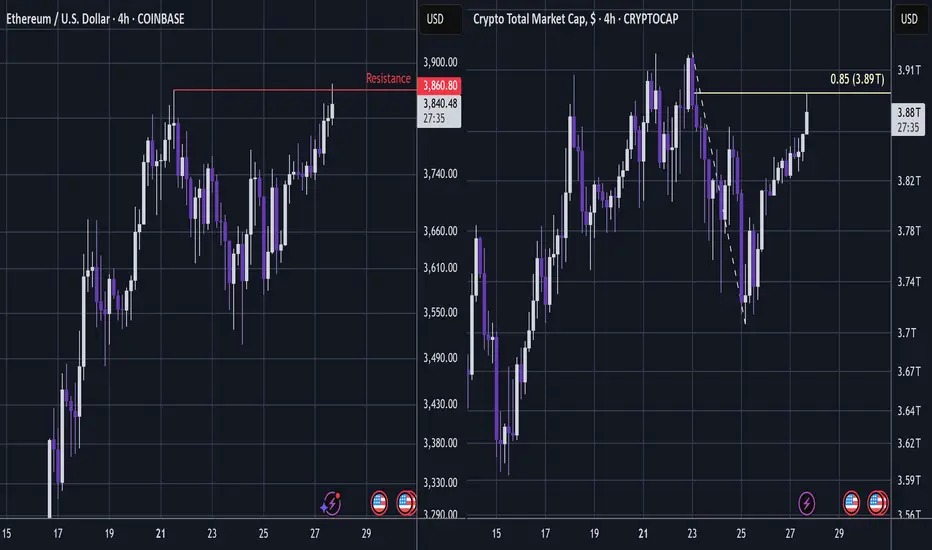
ETH and TOTAL Short Term Profit OpportunityETH TOTAL
ETH wicked into higher liquidity above the previous peak just as TOTAL hit the sweet spot just below 0.85 (for retracement completion).
So, if you're into the short term game, then this is a great moment to take some profit on ETH.
Even if it goes higher there are decent odds that it wi
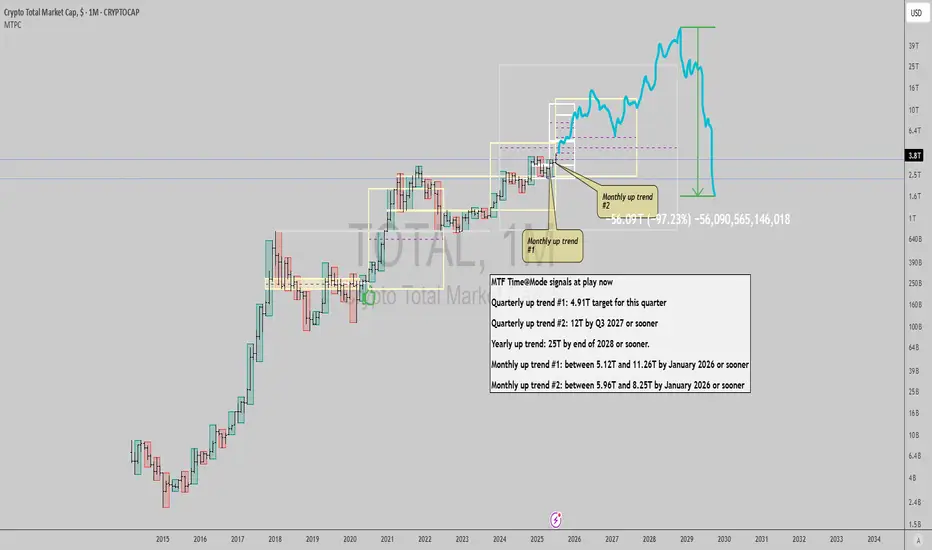
$TOTAL: Crypto market signals long term upside pendingGM gents, most people in crypto circles (Crypto Twitter sphere of influence and former Tradingview posters who evolved into influencers there) seem to have the consensus view that the market has little time to rise from here, and appear to signal a wall of worry sentiment.
This resonates with varia
MARKETS week ahead: July 27 – August 2Last week in the news
Trade tariff (un)certainties shaped market sentiment during the previous week. The US-Japan trade deal was settled which brought some relaxation among investors. The US equities continued with a positive trend, with the S & P 500 reaching fresh all time highest level, ending t
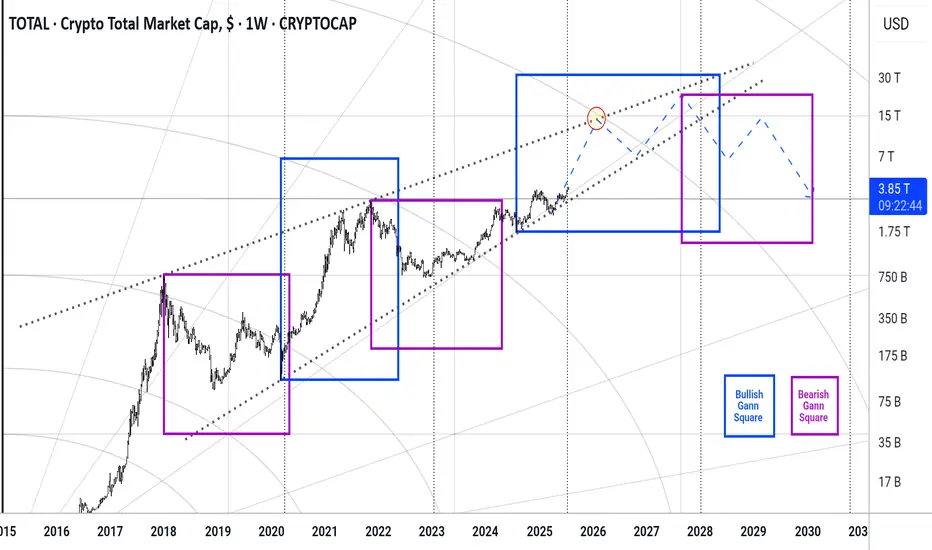
Total #002 ( Look at the Future !!! )Hello dear traders.
Good days.
First of all thanks for your comment and support.
---------------------------------------------------
In beautiful rising wedge of total market cap , the total market in this month broken 0.5 monthly Gann Square price level which means will be ready for test and ret
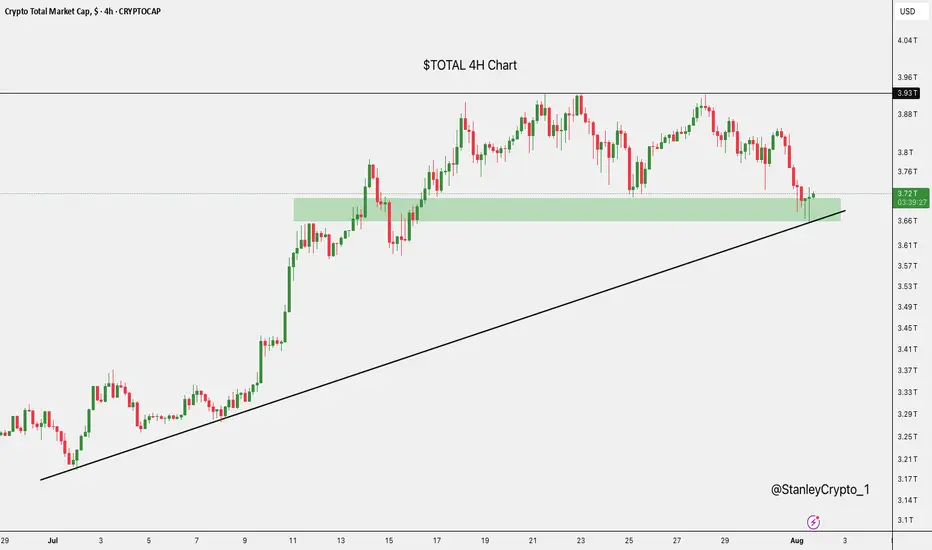
$TOTAL at Key SupportThe crypto market cap has just bounced off a strong support zone around $3.67T, right where it aligns with the rising trendline.
This area has held firm before, and it's doing the same now.
If it continues to hold, we could see a nice recovery.
But if it breaks down, there’s a risk of more downsi
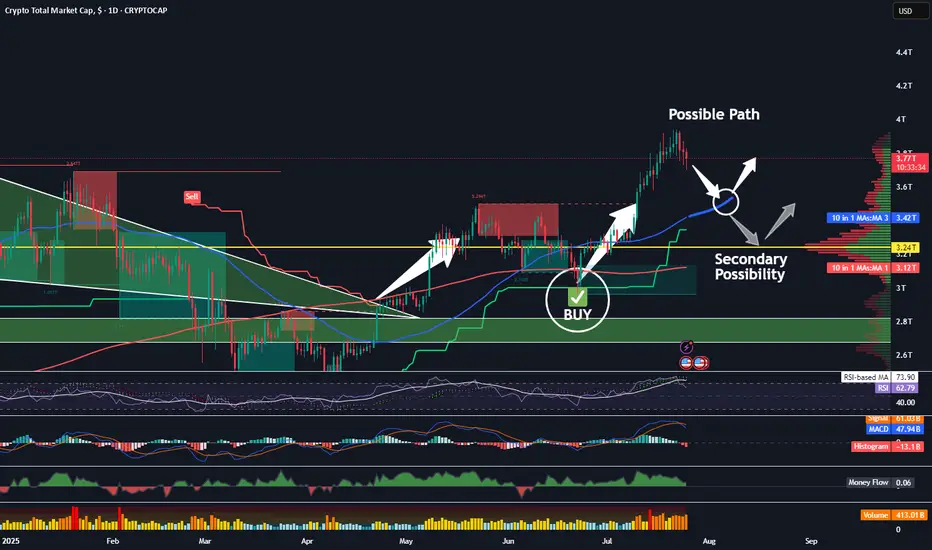
Now We WaitTrading Fam,
In my last video, I mentioned how I had been learning to trade more patiently, giving myself those high-quality, high-probability winning trades. This is a perfect time to illustrate that strategy.
With our altcoin market overheated, I am expecting more rest, accumulation, and pullba
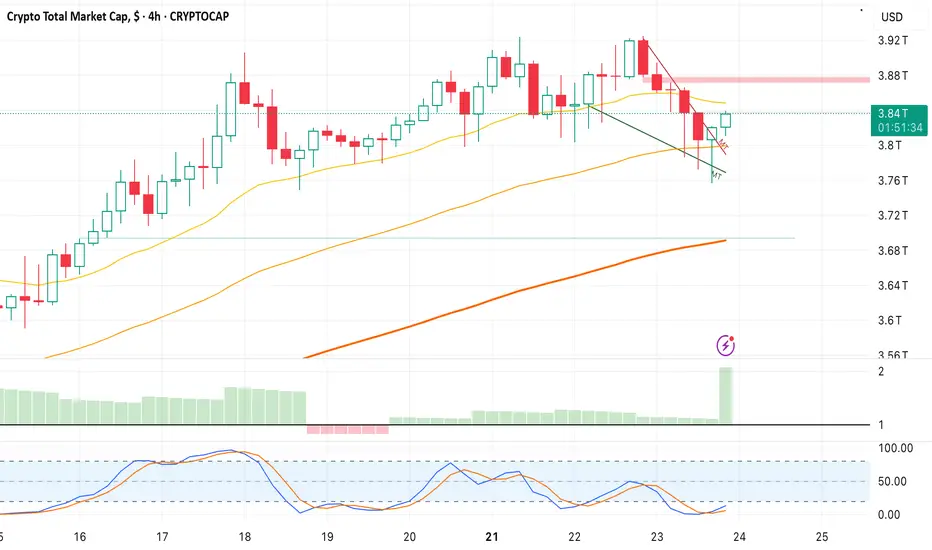
Bounce on Crypto Cap-Falling Wedge breakout at 3.836T, Target- 3.88 and 3.9.
-Looking for Bullish Crypto trading opportunities that align with this bias.
Money Flow - 2### Money Flow Spread from DJI to Cryptocurrency: A Fibonacci Perspective
The financial markets operate in an interconnected ecosystem where capital flows between asset classes based on macroeconomic trends, investor sentiment, and risk appetite. One such dynamic involves the movement of funds from
See all ideas
Summarizing what the indicators are suggesting.
Oscillators
Neutral
SellBuy
Strong sellStrong buy
Strong sellSellNeutralBuyStrong buy
Oscillators
Neutral
SellBuy
Strong sellStrong buy
Strong sellSellNeutralBuyStrong buy
Summary
Neutral
SellBuy
Strong sellStrong buy
Strong sellSellNeutralBuyStrong buy
Summary
Neutral
SellBuy
Strong sellStrong buy
Strong sellSellNeutralBuyStrong buy
Summary
Neutral
SellBuy
Strong sellStrong buy
Strong sellSellNeutralBuyStrong buy
Moving Averages
Neutral
SellBuy
Strong sellStrong buy
Strong sellSellNeutralBuyStrong buy
Moving Averages
Neutral
SellBuy
Strong sellStrong buy
Strong sellSellNeutralBuyStrong buy
Displays a symbol's price movements over previous years to identify recurring trends.