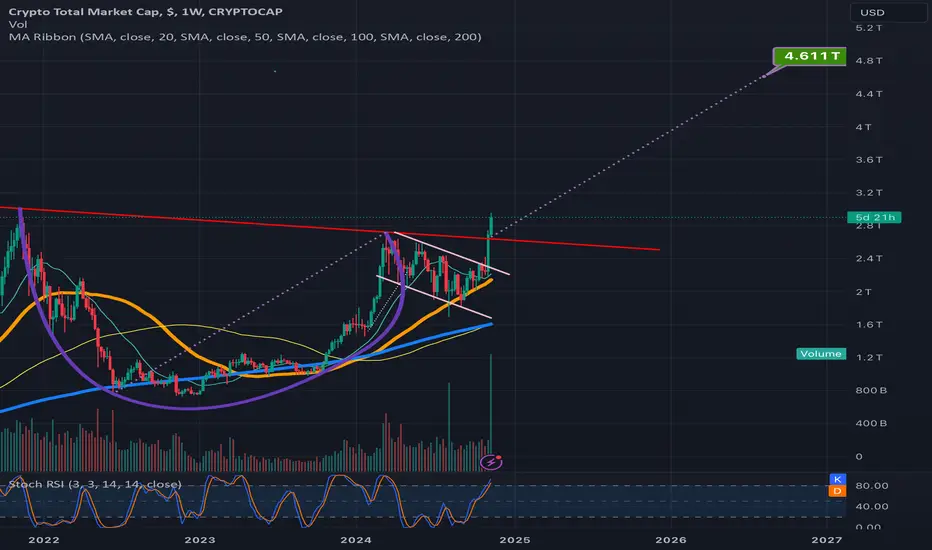
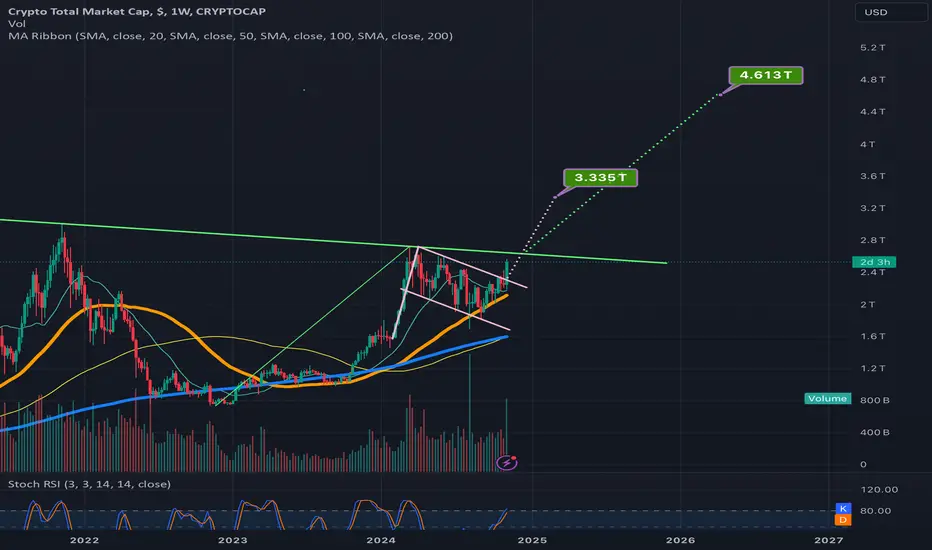
Price action on the TOTAL chart now comfortably above the c&h Price action is now knocking on the door of 3 trillion for the total crypto market cap. We can see also that now that price action is reasonably above the rimline of this massive cup and handle pattern, and has also closed a weekly candle above it now as well, that we are likely to soon validate the breakout of this pattern and star climbing towards its breakout target of 4.6 trillion. I think Brad Garlinghouse was anticipating the total market cap nearing 5 trillion by end of 2024 and that target is not that far off. I will link some previous total market cap charts below so you can see other macro patterns we are also heading towards with an even higher target than this cup and handle. *Not financial advice*
TOTAL trade ideas
Theres no new money.. its the same money sloshing aroundBearish divergences everywhere, like last time.
Trump led you fools to the slaughter. But you deserve it, so be it.

Clockwork OrangeThe Eudollar is more robust than any US or Fed forces.
Mycrostrategy to become Bitcoin World Bank.
The Fed is undershooting, and they know it.
There are so many gray swans ready to turn black.
The Repo and SOFR spread outliers are watched closely by Hawks like me.
Over 100 US regional banks are on the verge of collapsing.
China's stimulus is not working, smoke and mirrors.
Get ready while drip-buying the TLT and EDV.
Buy a basket of Call options on the TLT.
PEPE is Bitcoin's heartbeat.
DOGE, X and Telsa are now Nazi symbols.
Only a war can save the fiat standard from here.
Stay safe out there.
OMS

TOTAL CRYPTO TICKER - moving average linesAll the moving average lines are in order and underneath the price of cryptocurrency, bitcoin too. If so, the signal would mean the price will maintain and continue forth onward to the new year. The potential for the market cap of cryptocurrency to double may be in the cards, the loftiness of trillions of dollars swelling cryptocurrency is a much tougher sell than Bitcoin, ideally. For all those active investors and active social viewers this post is of the utmost simplicity based on the simple method of keeping ideas useful.

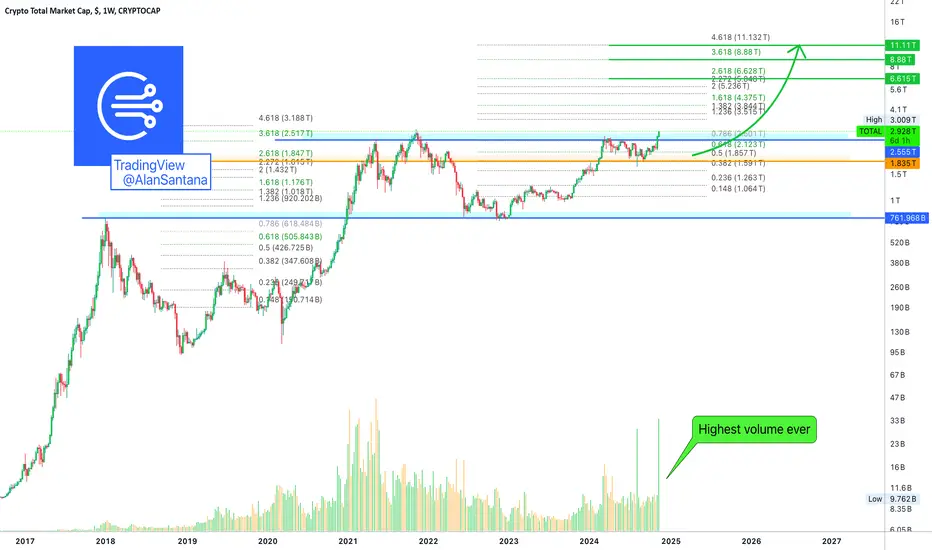
4 Years Or Eternal Growth? The Trump Bull-Market! (8.88-$11.11T)This week the TOTAL index chart saw the biggest volume session, ever, in its whole history, and it is only Monday. We are witnessing something extra-ordinary.
Think of instead of a 2025 bull-market, a bull-market that can last 2 years, 3 years or even 4 years or more; all the time that Trump is in the white-house. We will call this the "Trump Bull-Market."
Trump is not even president yet and the entire world is feeling the positive heat; Bitcoin is hitting new ATHs, the stock market, after being on the verge of the biggest crash in its history, reverse its course and started to grow. The Altcoins are set to boom... I don't know about the conventional markets, but Cryptocurrency is set to enter the most bullish situation in its history. The Cryptocurrency market is set to be worth more than 8.88 Trillion USD or even 11.11 Trillion USD in the coming years, this will be the Internet boom 2.0.
The total Cryptocurrency market capitalization's ATH stands at 3T, we are only some $70,000,000 away from this mark, soon, a new ATH will hit. The week is young and we have the highest volume ever, by the end of the week, we don't know how far up it can go.
Think of Bitcoin being cheap at $80K. Think of Bitcoin trading easily beyond $220,000 and growing continuously for years... If the Cryptocurrency market can grow when the entire world was against it, how good can it get with favorable legislations? With a friendly US government! We don't know, but we know about the Internet and how that ended; Cryptocurrency is the future of technology, of finance; it is the future of communication, the future of exchange.
Prepare for unlimited growth.
Namaste.
TOTAL - $3T soon...Very important to see how the market reacts at the $3T level. Once that is broken the expansion phase will begin.
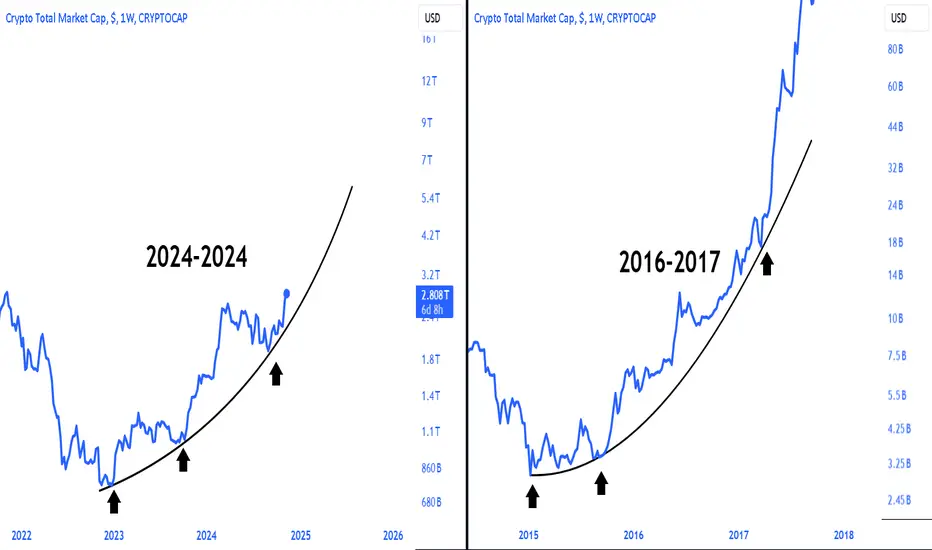
Total Market CapTotal market cap parbolic curve is also at the beginning of the epic rise phase!
Historical levels are being loaded for #Bitcoin #Ethereum and #Altcoins 🌊⏳
MARKETS week ahead: November 11 - 17Last week in the news
Regardless of the FOMC meeting and rate cut for another 25 bps, still the major event during the week was related to the US Presidential elections. It seems that investors were more than satisfied with the American votes, as almost all markets finished the week in green, few of them with fresh new all time highest levels. Equity markets were the first to react to election results, by pushing the S&P 500 to new ATH at the level of 6.010. Another market which significantly gained with the election was the crypto market. BTC passed the level of $80K, reaching another all-time highest level. On news that a new US President might influence peace negotiations in the Middle East, the price of gold slowed down and reverted back toward the $2,65K level. The US Treasury bonds were the only to stay resilient, and waited for the FOMC decision in order to return back toward the 4,30 level.
The FOMC members cut interest rates by another 25 bps at their meeting held on Thursday. Speaking about the state of the economy, Fed Chair Powell noted that “The Committee judges that the risks to achieving its employment and inflation goals are roughly in balance”. This sentence summarizes the current view of FOMC members on the state of the US economy. Although this was an expected move, still the after-the meeting speech of Fed Chair Jerome Powell was marked with a question whether he will resign if newly elected US President Trump requests from him such a move. He clearly stated that he will not resign and soon after closed the Q&A session.
Another topic that is emerging among Fed Governors is what will happen if the US imposes high tariffs on imported goods, as newly elected President Trump was mentioning in his presidential campaign? This question was commented by the Minneapolis Fed President Kashkari, who noted that such an action could worsen a long term inflation outlook. Economists are noting that such a course of action might impact the Fed to increase interest rates again, if inflation needs to be kept under control.
While the Western news are speaking about future potential import taxes for foreign goods, which might be implemented by the new US government, China continues to stay focused on its own economy. News have reported that the China government is planning a five-years package around $1,4 trillion in yuan equivalent. The aim with the latest measure is to tackle the Government debt, while there has been announcements that more of aid for the economy might come during the following year. The package should be released mainly through a debt-swap program, however, investors did not perceive such an approach to the current Government problems. The IShares China Large Cap exchange traded fund, was down by nearly 5% on the news.
Crypto market cap
After the US Presidential elections during the previous week, it seems like there is a new dawn for the crypto market. Namely, as newly elected President Trump was highly pro-crypto during the presidential election, so the markets are currently expecting that the crypto ecosystem will finally have full support from the US government for its further expansion. The market reacted in line with this sentiment, pushing the crypto market and BTC to the new historically highest levels. Total crypto market capitalization was increased by 18% during the whole week, adding more than $412B to the market value. Daily trading volumes were more than doubled from the week before, where it was traded around $278B on a daily basis. Total crypto market capitalization increase from the end of the previous year currently stands at $1.053B, which represents a 64% surge from the beginning of this year.
It was one of the best weeks on the crypto market, certainly not recently seen. All coins gained during the week, with BTC leading the market. Incredible gains were also part of this weekly story. BTC gained the most of all coins, adding more than $222B to its market cap, increasing it by 16.1%. During the week, BTC also recorded a new all time highest value above the $80K. ETH was in second place with an inflow of $82.6B to its market cap, increasing it by 27.5%. ETH managed to cross the $3K psychological level. DOGE was a surprise of the week, with an increase in the market cap of $17.1B or 73%. More than $ 8B in value managed to add ADA and BNB, where ADA increased its market value by 66.2% while BNB surge was 10.2%. A market favorite Solana should also be mentioned as the coin increased its market cap by $22.1B or 28.44%. The list of gaining coins could continue, as weekly gains were quite significant between 20% and 30%. Only rare coins managed to add below or up to 10% during the week.
Coming to coins in circulation, the situation was relatively stable with the exception of a few coins with higher gains and decrease of circulating coins. Maker gained the most new coins as they were increased by 0.7% on a weekly basis. Filecoin, Polkadot, Solana and Stellar added 0.2% of new coins, each. Tether increased the number of coins on the market by 2.2%, increasing by this percentage its total market cap. On the opposite side was standing Polygon, which decreased its number of circulating coins by 1.9%, while Algorand pulled 0.8% of coins in circulation.
Crypto futures market
The crypto futures market fully reflected developments on the spot market during the previous week. Both BTC and ETH futures significantly gained during the week. BTC futures gained more than 10% for all maturities, while ETH futures surged by around 17%. BTC futures maturing in December this year ended the week at $77.935, while those maturing in December 2025 closed the week at $85.020. March 2026 was closed even higher, at $86.835 which is the highest ever level reached for BTC.
Similar situation was with ETH futures, where almost all maturities crossed the psychological $3K line. In this sense, December 2025 closed the week at $2.993, still 17.19% higher from the week before, while December 2025 was last traded at $3.207.
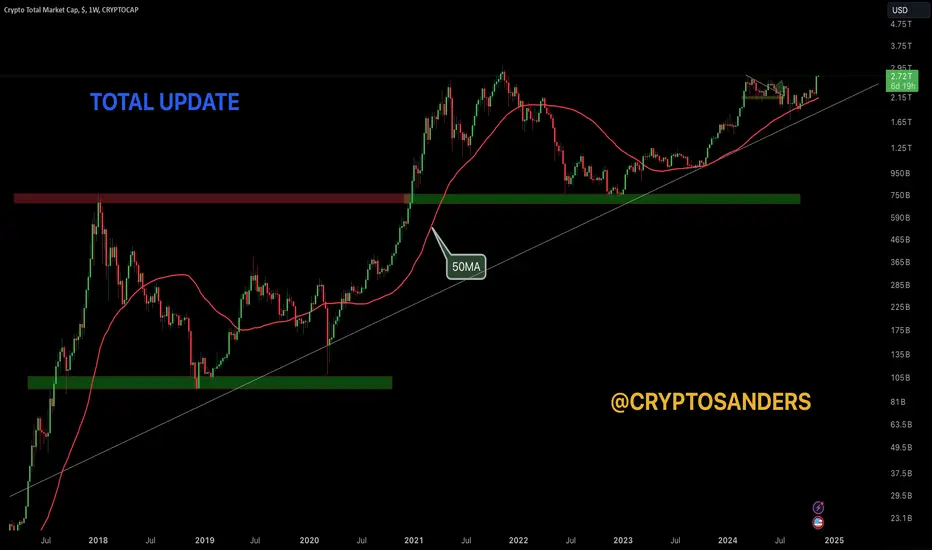
Provides analysis of cryptocurrency market cap (CRYPTOCAP)The red line shows the 50-week moving average, which appears to be a crucial support level for the overall trend. Historically, the market cap has respected this moving average, with upward momentum when trading above it.
This area acts as a strong support level, as it has historically provided a solid foundation for price recovery. The total market cap has rebounded from this level several times, indicating buyer interest.
This is a crucial resistance level, as the market has reversed from this area before. If the total market cap approaches this area, selling pressure may occur.
The white diagonal line shows a long-term ascending trendline, suggesting a steady upward trend since 2018. This line further strengthens the overall bullish trend, as long as the total market cap stays above it.
Currently, the total market capitalization is testing the 2.728T level, which is close to recent highs, with a possible bounce if it breaks above the red resistance zone.
The overall outlook appears to be bullish, but it is essential to keep an eye on any significant moves around the resistance zone and the 50MA, as these will influence the long-term trend.
Disclaimer: This analysis is for informational purposes and is not financial advice. Always stay updated with market movements and adjust your trading strategies as needed.
You can DM us for information on any other coin.
@Peter_CSAdmin
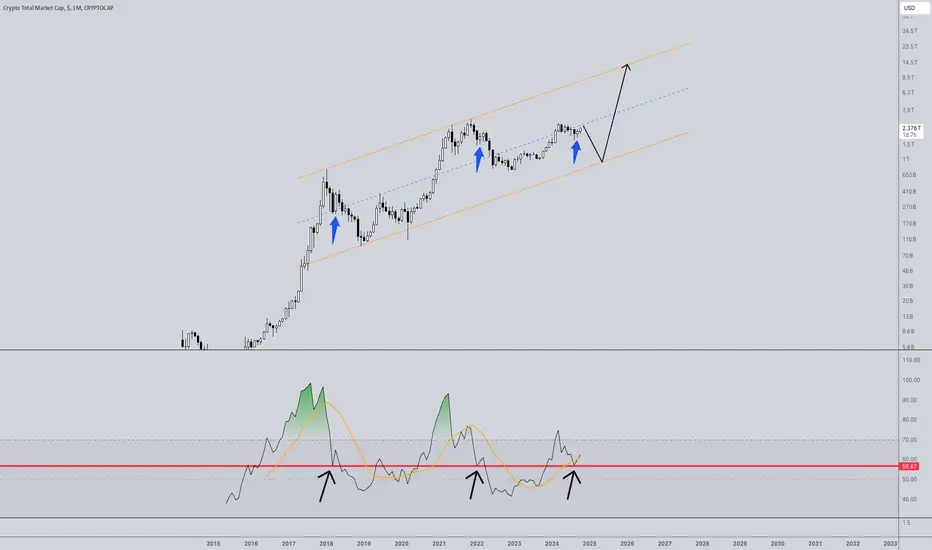
TOTAL market cap chart screaming buy signalIf you're not long crypto I don't even know what the heck you're doing, if you call yourself a financial speculator...
Last time a signal fired in this timeframe it was in October 2023, at 1.15T market cap.
Upside to 5 to 9 trillion by July 2025 is in the cards.
Get long crypto!
Best of luck!
Cheers,
Ivan Labrie.

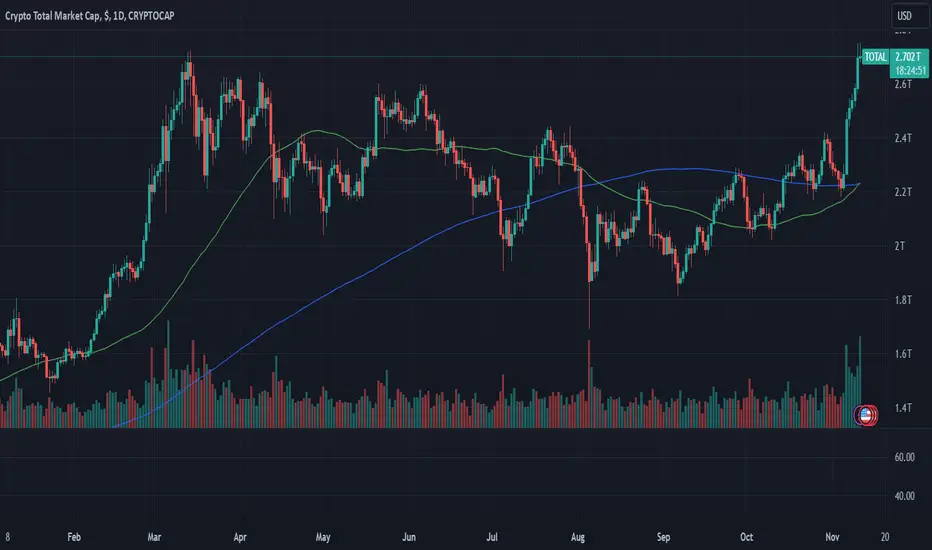
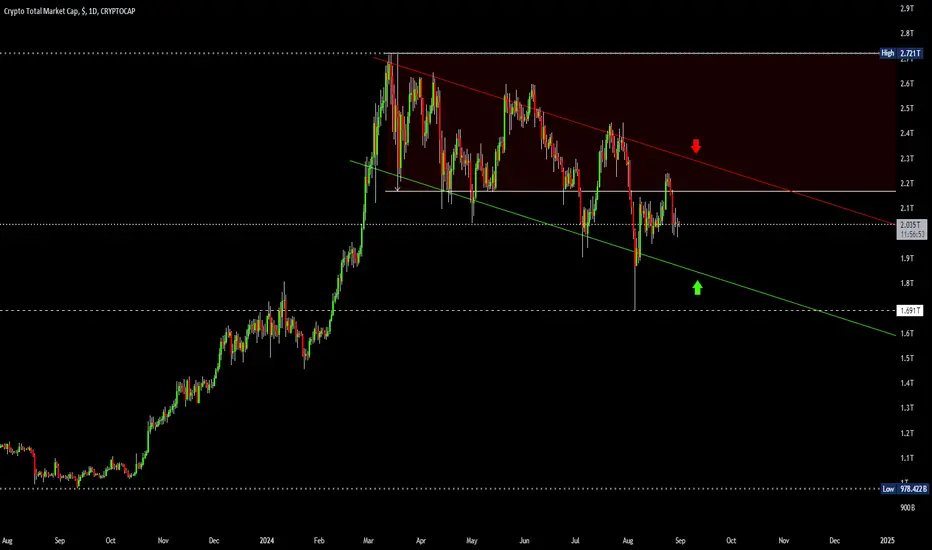
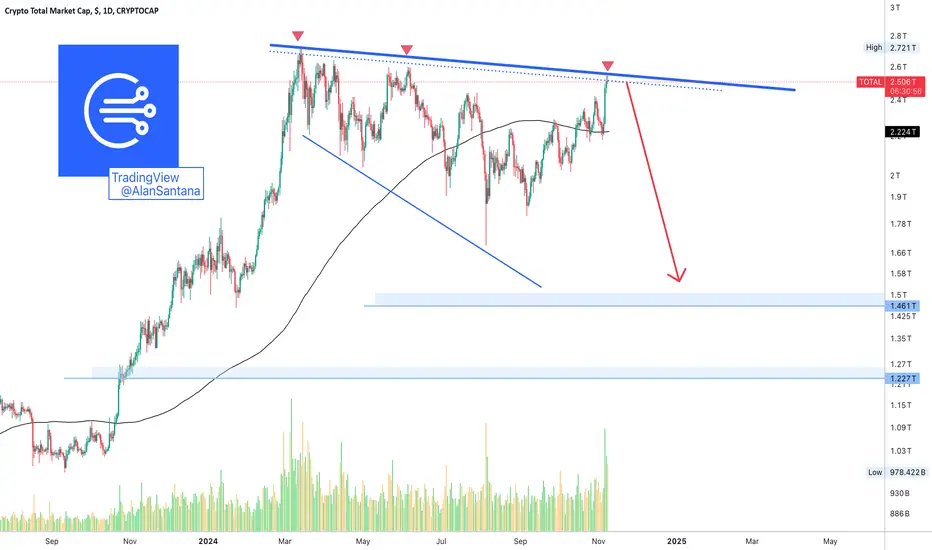
Crypto bear marketCrypto entered a bear market in July when it's total market cap dropped - 20%. TOTAL March high of 2.721T down to the August low of 1.691T was - 38%, but it bounced back up. So now, heading into September, we are only down - 25% at 2.036T. However, as a trader we can use some of the key levels that have printed on the chart to go long or short according to positioning. I see 5 main levels to pay attention to:
1) 2024 high = 2.721T
2) 2024 - 20% = 2.169T
3) August low = 1.691T
4) Down trend channel top = 2.314T
5) Down trend channel bottom = 1.868T
TOTAL has made lower lows and lower highs since March. The strongest trend to trade long or short off of since March is to go long crypto off TOTAL down trend channel bottom in green and go short off TOTAL down trend channel top in red. Anything in between is not high probability. But, also now that we have a confirmed crypto bear market printed on the chart, the 2024 - 20% = 2.169T level will act as serious resistance too.
A bear market is a downward trend in financial markets, indicating a weakening economy and a loss of investor confidence. Generally, a market is considered a bear market when prices have declined more than 20%. Bear markets can be as short as a few weeks or as long as a several years. Until there is confirmation of TOTAL breaking out of the crypto bear market, we have to accept the fact that we are in it for an unknow period of time.
TOTAL cryptocap chart about to complete the handle on its c&h We can see price action is breaking up fro a bullflag that has a target of 3.33 trillion. In doing so we should also validate the breakout of the cup and handle pattern which will give ita breakout target around 4.6 trillion or so. Price action is currently very close to retesting the green rimline of the cup and handle pattern and completing the handle. If we were to look at the daily, this pupcoincided precisely with the daily chart’s recent golden cross(not shown here) *not financial advice*
Whale Alert! Transactions Dynamics, 2025 Bull-Market, Patience &Before the US Presidential elections, all the whale transactions within the Cryptocurrency market had bearish connotations. I was seeing large amounts of Crypto, mainly Bitcoin and Ether, being transferred across exchanges. It is said that when large amounts of Crypto is transferred, it is in order to sell and thus have bearish connotations. This dynamic was on for a while.
After the elections, things changed. First, Tether Treasury minted 1Billion and then it did it again, today. Large amounts of USDT and USDC started to move across whale accounts and exchanges, this tend to be seen as bullish and has bullish connotations. Even now large amounts of stable coins is entering the exchanges and large amounts of Crypto (BTC, ETH and others) is leaving exchanges, the dynamics changed.
But, compared to past market cycles, the bearish transactions are also present in-between the bullish ones and we see more and more ancient (satoshi-era) Bitcoin wallets waking up.
So we are seeing a mix of bearish and bullish transactions being executed by the whales.
The general sense I am getting from these transactions is that something big is about to develop and it ain't a new ATH. A new All-Time High has been hit already on Bitcoin, let's see what we get next.
The war has been cancelled and this is awesome, but it seems that a major market flush has not been cancelled, let's consider the TOTAL chart next.
First, super high volume for the bulls 6-November. Then a third strong lower high in a row. The volume is super high but lower than 5-August and lower than 6-March. (Bearish.)
TOTAL Cryptocurrency continues to point down. The action we are seeing across Bitcoin is extraordinary and is not reflecting on the rest of the market, it seems it will soon end.
I was considering a different scenario, what if the Altcoins are just behind and will soon breakout? As some are doing and already did; but, I continue to look at hundreds of charts and they are pointing lower, the bounce (pull-back) is over and next, down we go!
Imagine/think/feel/listen, if we are about to experience the biggest bull-market ever in 2025, when will the correction take place?
1) Will the market rally straight up for 3 more months and end in March 2025?
2) Or will the market correct to set the stage to grow for more than 12 months straight?
I am going with #2.
Bull-market year tends to be bull-market year; growth, growth, growth. For sustained growth to be possible, it tends to start out of a market low. After three months of growth, a correction is due regardless of the short-term, mid-term or long-term, the market moves in waves.
We are due for a correction, and we will be 100% bullish at the next support focused on the long-term.
Now, there are different pairs and different charts; some are trading low already and these can be bought. Those trading high and at resistance, should be approached with caution because people are really smart.
Only beginners would buy at the top, and the majority of the players approaching the market now have some experience and this will do what is right to win in the long-term.
The beginners buying at the top, these are the ones that will have to go through the first lesson, they will have to wait just like we had to wait when we started trading back in those days.
We noticed the market because of the new All-Time High. We buy in expecting forever growth (March 2024, November 2021, December 2017, 2014), but instead of growth, the market enters a major correction and we learn the first and most basic lesson, you can never buy at the top.
Patience is key. The market is not going away.
If we are bullish for the whole of 2025, there is plenty of time to buy and trade.
This is not financial advice.
Your support is appreciated.
You are reading Alan Santana.
Namaste.
Crypto Total Market Cap, $Hello everyone,
Small daily chart.
Break of the trend line.
I indicated the next tp in yellow on the chart.
On the chart the 3 accumulation zones.
Make your opinion, before placing an order.
► Thank you for boosting, commenting, subscribing!

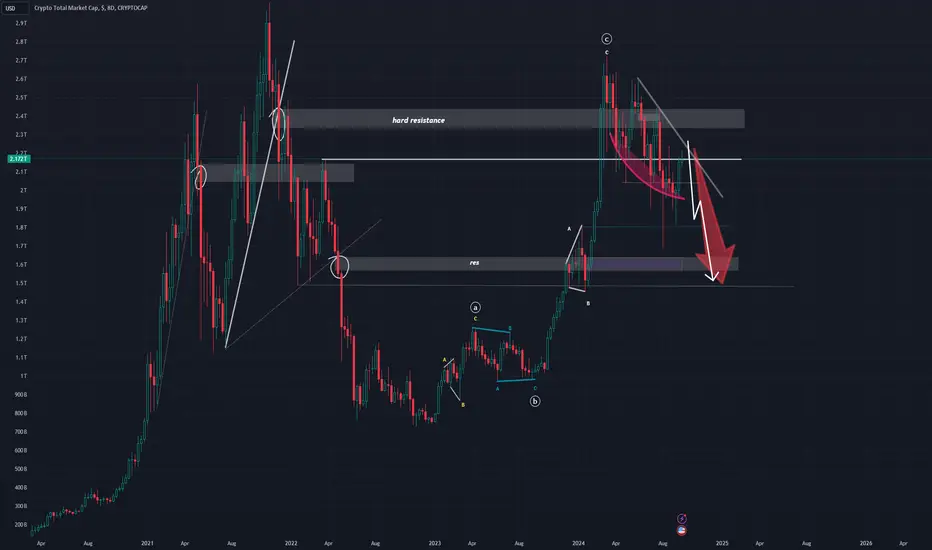
TOTAL -500 billion v2It is the result of price reading, bow volume(MD invetion), various indicator strategies and other crypto analysis.
I don't use any other factors to make the analysis, only technical analysis. No hype No fomo
Around -500 billion is my prediction based on technical analysis. I don't predict 2.5T higher.
I could be wrong
$TOTAL - Bears in troubleSo, you´re favorite crypto guru is calling the top , the CT is going crazy with influencers selling their altcoin bags and preparing for capitulation.
It is pretty clear to me that this is the point when most people will be caught with their pants down..as you can see at the chart i expect a bounce and trapped bears.
Could have a deviation below but we are going up.
NFA

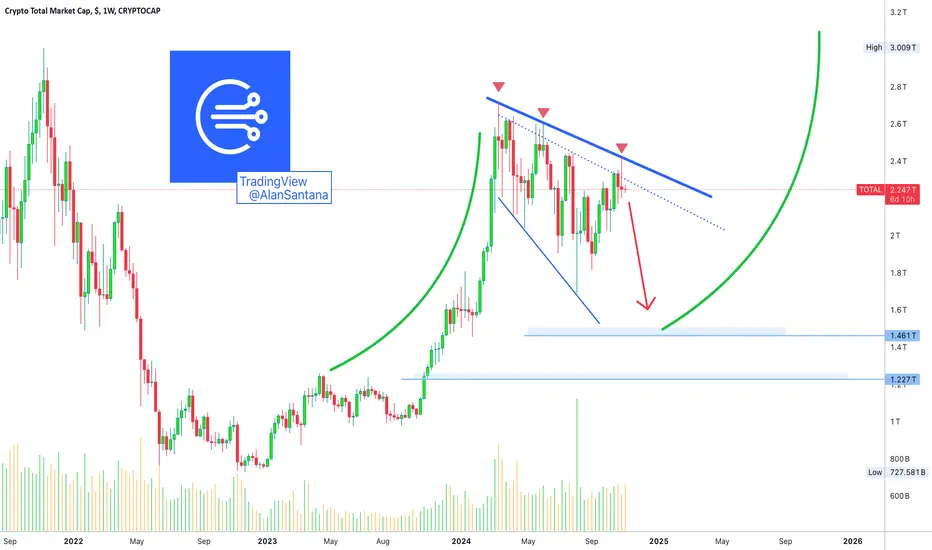
2024: The End Of A Cycle | 2025: A New BeginningThe reason why you are seeing mentions of "no more SHORTs," is not only because I am turning bullish but because we are reaching the end of a cycle.
The Cryptocurrency market has been bearish since March 2024, invariably. It has been going down. This chart is absolute proof of this statement, but it won't go down forever, in fact, the bearish cycle is coming to an end.
The TOTAL index closed red two consecutive weeks. The first red week produced a minor high and all was good; the second week, last week, produced a strong bearish candle and this candle closed below the previous week bearish close, producing a very strong bearish signal. This type of signal is the one that I am describing as "there is no going back."
The good news is that this is likely the end. Once the correction low is in, TOTAL (the entire Cryptocurrency market) will recover and it will recover really strong. The market moves in cycles and it fluctuates between going down and going up. There are many variations between the pairs but the general bias is always the same.
For example, Bitcoin was growing strongly together with the rest of the market until March 2024. Even though Bitcoin hit a double-top recently, there is no new highs. Earlier this year and last year, we would see and experience a clear price advance with higher highs being hit every single day or week. The same for this index, before March 2024, notice the green arrow, higher highs... Higher and higher with force. After March 2024, lower highs and lower lows.
The whole lower highs and lower lows sequence will lead to a final flush. This final flush will produce the corrective phase bottom and from this bottom we go bullish; this bullishness is what we translate as growth. We will see a clear and undeniable sequence of higher highs and higher lows. This will happen long-term until a new All-Time High is hit as part of the major 2025 bull-market bull-run.
Prepare for the crash. It will be over fast. Those unaware as to what is happening will have to undergo some pain.
If you know what is coming, you have the option to prepare and make the best of this situation. You can do nothing, protect your capital or even profit from this drop.
Whatever you do, I am rooting for you; you have my unconditional support.
Thank you for reading.
I'll you see on the other side.
The end of the bearish cycle will usher in the start of the bullish phase.
Namaste.
MARKETS week ahead: November 4 - 10Last week in the news
During the previous week a mixed US macro data and disappointing NFP data shaped the market sentiment. The US Dollar gained in strength as of the end of the week, pushing the price of gold toward the level of $2.735, after it reached the fresh new ATH supported by geopolitical tensions. The US Treasury yields continue to test higher grounds in a wake of the FOMC meeting in a week ahead, where 4,3% for 10Y US benchmark has been tested. The S&P 500 reverted a bit to the downside, closing the week at the level of 5.728. The weekly best performer was BTC, which was testing the level of $ 73K during the week.
The US Non-farm payrolls of 12K in October were the surprise of the week for the markets. Such a weak performance and a significant drop, analysts are contributing to the hurricane and syndicate strikes in the US during October. Still, the question is pending how this figure will affect the FOMC rate decision, scheduled for November 7th. At this moment, markets continue to expect a further 25 bps rate cut. The final FOMC perception of the macro developments will be known after the FOMC meeting on Thursday.
CNBC is reporting that the most famous investor, Warren Buffet continues to stockpile cash, which is currently estimated to be $325 billion. This was an increase in Q3, from $276 billion in Q2. The news is reporting that Berkshire Hathaway continues to sell stocks, first place Apple and Bank of America. There are also no buybacks of sold stocks, which might be repurchased when Buffet “believes that the repurchase price is below Berkshire's intrinsic value, conservatively determined.”.
News are reporting that the New York Stock Exchange announced plans to extend equities trading on Arca to 22 hours per day, five days a week. The NYSE came to this proposal considering a “growing demand for our listed securities around the world”. It is still under question whether this proposal will be adopted by NYSE.
NVIDIA will replace Intel stock in the Dow Jones Industrial Average index on November 8th. Nvidia shares surged by 170% during 2024, while the company surpassed $3,3 trillion in the market cap.
In its research, JPMorgan analysts noted that BTC daily mining revenue dropped in October for a fourth consecutive month. Analysts noted that BTC miners earned on average $41.800 per exahash per second of hashrate, which was 1% lower than in September. On a positive side is that transaction fees spiked to 60%.
Crypto market cap
Although BTC had its rally toward the higher grounds, overall the crypto market had a pretty mixed week. The forthcoming Presidential elections pushed the major coins to higher grounds, however, other altcoins did not perform in the expected manner. Total crypto market capitalization ended the week 2% higher from the week before, where a total $ 46B has been added to the crypto market cap. Daily trading volumes were increased to the level of $140B on a daily basis, from $99B traded a week before. Total crypto market capitalization increase from the end of the previous year currently stands at $641B, which represents a 39% surge from the beginning of this year.
BTC was the major coin which was driving the market to higher grounds. From a total market cap increase of $ 46B w/w, BTC added to its market cap a total $48B. This indicates that some other coins were driving the market cap to lower grounds. ETH was also traded with a positive weekly sentiment, adding to its cap almost $ 3B, increasing it by 1%. DOGE was another coin traded in a positive territory, increasing cap by $3.2B or 16.2%. From other altcoins Maker had solid performance, where the coin was traded higher by 11.7% w/w. Interestingly, Solana was traded with a negative sentiment, where $4.2B has been erased from its market cap, which decreased by 5.1%. BNB had a negative week, where its market cap dropped by $2.9B or 3.4%. Other altcoin lost somewhere between 1% and 5%.
There has been significantly increased activity with coins in circulation. BNB decreased the number of coins on the market by 1.3%. On the opposite side were Polygon, with an increase of circulating coins by 0.8% w/w, OMG Network increased the number of coins by 0.6%, while Filecoin and Maker added 0.4% new coins to the market.
Crypto futures market
The crypto futures market ended the week at a positive territory for both BTC and ETH. BTC short term futures were traded higher by 3.5%, while longer term ones were up by 3.6%. BTC futures maturing in December this year were last traded at $70.195, and those maturing a year later closed the week at $76.850. It should be noted that March 2026 was last traded at $78.490 which was its highest price in history.
ETH futures were traded around 1.6% higher for all maturities. Futures maturing in December closed the week at $2.554, and those maturing in December 2026 were last traded at $2.744. March 2026 closed the week at $2.794. This shows that investors are still not perceiving ETHs price above the $3K target.

Total to 2.5 trillion Possible deviation below trend line ?
Yes .
Probable ?
No.
I expect a bounce right now.

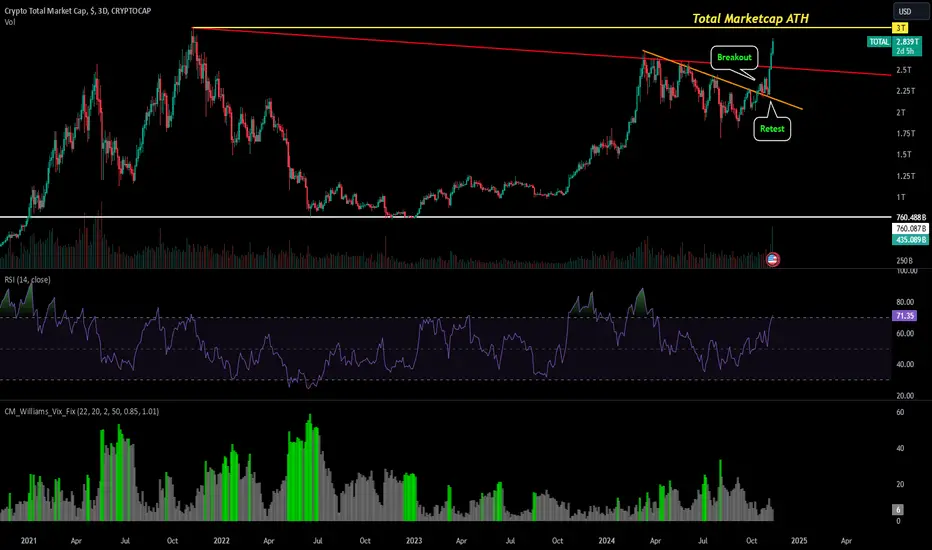
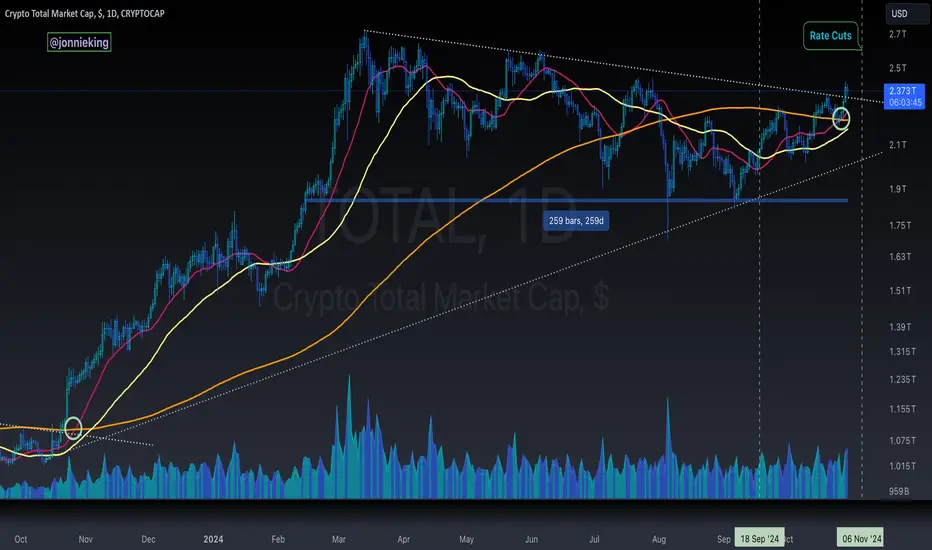
$TOTAL Market Cap 259 Day BREAKOUT!At last, the Crypto CRYPTOCAP:TOTAL Market Cap has a BREAKOUT from the 259 Day trend!
This was the lagging chart I was watching to confirm the next leg up in the bull market.
The 20DMA has also crossed the 200DMA for the first time in 12 months. This is a SUPER bullish signal, as you can see what occurred last time in October 2023.
With less than 1 week away until Donald Trump is declared President of the United States, and the FOMC announcing another round of rate cuts the following day, we can expect a lot of volatility in the market.
The 20DMA should act as a good support on the way up.
The final signal will be when the Fed announces they will stop selling securities from their balance sheet. This will signal a new round of quantitative easing, and complete risk-on.
Tick-tock MFers. Position accordingly!
what if?Interesting point on the 1 month RSI, every time we caught a bounce from this zone followed by a capitulation, what if this time too?
MARKETS week ahead: October 30 – November 3Last week in the news
Previous week was a relatively calmer one on financial markets. A strong sentiment for US inflation data was the one which pushed the US 10Y yields to the higher grounds, at 4,25%. The US Dollar continued to gain, while ongoing geopolitical issues impacted the price of gold to also end the week at historically highest levels, at $2.746. The US equity markets had a modestly mixed week, with the S&P 500 ending the week at the level of 5.808. The crypto market modestly pulled back, with BTC still holding around the $ 67K level.
A week after the ECB cut interest rates, as expected, the markets are reconciling what could be the next move of this Central bank. There has not been much information provided in an after the meeting speech of President Lagarde, except that “disinflation is on the track”. However, analysts are commenting that more has to be done in order to support the weakening EU economy. There has also been discussion that the decreased interest rates made an impact on modestly increased bank lending to corporates and the retail segment in September. Still, the increase of 0,7% for the year, analysts see as relatively low.
Tesla (TSLA) shares surged by a significant 22% during the single week, after the company posted better than expected Q3 results. This was the best weekly performance of the company for the last 16 years. TSLA posted a revenue of $25,18 billion, an increase of 8% on a yearly basis. Also, the company posted earnings per share of 78 cents, beating the analysts estimate of 58 cents.
News is reporting that the price of BTC was strongly impacted during the previous week by the story published by Wall Street Journal over a DOJ probe on Tether. As per report, the US officials are currently investigating the stablecoin issuer Tether, for its potential involvement in violation of anti money laundering laws and sanction rules. However, Tether Chief technology officer shortly commented on the news on platform X, noting that WSJ is “regurgitating old noise”.
In the wake of the US elections, market analysts were investigating the topic of potential impact of US tariffs on Chinese goods to China's economy. Analysts from the CITI Research commented that an introduction of tariffs of 60% might impact a severe drop in China's exports to the US, which now accounts for 14,8% of China's total exports, which would further impact a potential drop in the GDP of China by 2,4%. However, this was only a case study of researchers, while potential increases in tariffs are still only at the level of discussion among some US political figures.
Crypto market cap
The crypto market relaxed a bit during the previous week, after the week of significant move to the upside. Total crypto market capitalization decreased by 3% on a weekly basis, with a drop in market cap of $58B. Daily trading volumes were also modestly decreased to the level of $99B on a daily basis, from $112B traded a week before. Total crypto market capitalization increase from the end of the previous year currently stands at $595B which represents a 36% surge from the beginning of this year.
Majority of crypto coins were traded within a negative territory during the week, with only a few who finished the week in green. BTC slowed down during the week, ending it by 1.6% lower, decreasing its market cap by $22B. ETH followed the sentiment, with a decrease in value of 6.6% or $21B. BNB was also traded toward the downside, where the coin lost $2.2B in value, decreasing it by 2.5%. In relative terms, the few coins which lost the most were NEO, Theta and Maker, with a drop of more than 10%, Polygon was traded down by 14%. Interestingly, this week Solana was in the spotlight of the market, where the coin managed to end a week by 11.5% higher from the week before, adding $8.5B to its market cap. Tron was also among weekly gainers, with an increase in the market cap of 5.3%.
There have also been interesting developments with circulating coins. This week Polygon decreased the number of its coins in circulation by 2.2%. Maker also had a withdrawal of coins by 0.2% w/w. On the opposite side were Filecoin, Polkadot, Tether and XRP, which added 0.2% new coins to the market, each.
Crypto futures market
The crypto futures market reflected the developments from the spot market during the previous week. In this sense, BTC short term futures were traded lower by some 2% on average, while the longer term ones were holding below the 1%, almost flat on a weekly basis. BTC futures maturing in December this year were closed at $67.790, and those maturing in December 2025 were last traded at $74.135. March 2026 ended the week at $75.715. This was a positive signal from the futures market that investors still see the value in BTC in the long run.
ETH both short and long term futures were traded down by more than 5% for all maturities. December 2024 ended the week at the level of $2.517, while December 2025 was closed at $2.703. At the same time, futures maturing in March 2026 were last traded at $2.752, moving away from the $3K target.

CryptoMarket 📍 #CryptoMarket Quick Update
As previously mentioned, several factors could trigger a #BlackSwan event before the US elections, causing an average 35% drop across #altcoins💥. Large caps might decline 25-35%, while low caps could see drops of 40-60%. This could be a last shakeout before a real #Altseason begins. Stay ready and don't get scared!💪
