$TOTAL Crypto Market Cap Trying to Breakout - Retail IS ComingOnly thing we’re waiting for is the Crypto Total Market Cap to breakout.
Golden Cross on the horizon.
That’s why we’ve seen lack of volume in breakouts for CRYPTOCAP:BTC and Alts.
Means money is just switching from coin to coin, primarily from Tether in circulation, hence why CRYPTOCAP:USDT.D is going down.
CRYPTOCAP:TOTAL breakout will be fueled by retail, which should slowly come in the next couple weeks leading into another round of rate cuts on the 14th, followed by Donald J. Trump being declared the President of the United States the very next day 🇺🇸❤️
YOU'RE NOT BULLISH ENOUGH 🎯
TOTAL trade ideas

MARKETS week ahead: October 21 – 27Last week in the news
The US Retail Sales figures for September, as well as better than expected posted quarterly results of US companies were the major catalyst for the US equity markets during the previous week. The S&P 500 reached the newest all time highest level, ending the week at the level of 5.864. Although the US Dollar was gaining in strength, gold has also reached the fresh new highest level at $ 2.721, supported by the continuing tensions in the Middle East. The US 10Y Treasury yields were testing the 4,0% level. This week the crypto market was also in the spotlight of investors, where BTC was pushed up to the level of $68K.
The ECB cut interest rates by another 25 bps at their meeting held during the previous week. This was widely expected by market participants. Although ECB President Lagarde is still holding to the narrative that the ECB will be data dependent in the coming period, still what is evident is that the inflation in the Euro Zone is nearing targeted 2,0%. However, at this moment, inflation is a minor problem, considering that the EU economy is significantly slowing down. President Lagarde did not put too much emphasis on this issue, however, the markets continue to be of the opinion that the ECB would have to cut further in the coming months.
As September Retail Sales in the US were in line with the market expectation, and showed no threat to the inflation and FEDs forthcoming rate cuts, the market turned the view toward the increasing U.S. deficit. Economists are stressing that the US administration increased further deficit by 8% during this year, which recorded a $1,8 trillion. However, the economists are stressing a much higher problem for the US administration, which is the level of interest paid on that debt. As per reports, the interest payments reached $1,16 trillion, the highest amount ever in US history.
In line with the latest surge in BTC price, the inflows into BTC-linked ETFs also increased. As per news reports, around $2,1 billion flowed to these funds. BlackRocks chief investment strategist noted that 75% of all new investors in their BTC ETF IBIT have never before owned not a single iShare.
China posted its Q3 growth rate at 4,6% which was higher than expected, however, economists are noting that there are still significant challenges. The highest pressure on further China's growth is coming from the property market. New housing starts for the first three quarters were down by -12%y/y. However, hi-tech manufacturing continues to surge 10,1% y/y, as well as the auto industry, which is currently standing at 4,6%y.y. At the same time strategists from Wells Fargo are stressing that the value of Chinese equities are moving at overvalued territory. The MSCI China surged by 40% this year.
Crypto market cap
After a few challenging weeks, where crypto coins were traded in a mixed mode, a final breakthrough occurred during the previous week. A positive market sentiment was evident not only on the US equity market, but this time, investors sentiment was turned also toward the crypto market. Reasons are not quite evident at this moment. On one side are analysts who are noting increased odds of the US Presidential candidate and crypto-supporter (at least in the presidential campaign), Donald Trump to win the elections, while on the other side are analysts who are putting emphasis on increased government spending, which is more a realistic scenario. Whatever the reason, the crypto market capitalization increased by 6% on the weekly basis, adding total $139B to its market cap. Daily trading volumes remained relatively stable on a weekly level, moving around $112B on a daily basis. Total crypto market capitalization increase from the end of the previous year currently stands at $653B which represents a 40% surge from the beginning of this year.
Despite the significant increase in the market capitalization, still, there were coins which were traded in a negative territory during the week. The significant weekly gainer was BTC, which added $101.4B to its market cap, increasing it by more than 8% w/w. ETH followed the path, with a relatively smaller gain of $ 20B or 6.9%. BNB had another solid week, with a surge in market cap of almost $ 3B, increasing it by 3.5%. Market-favorite Solana was also in the winning club, with a surge in cap of $4.5B or 6.6%. Significant gainers in a relative terms, were Litecoin, with a surge in value of 13.7%, DOGE was traded higher by more than 26%, Bitcoin Cash was higher by almost 10%. There were a few coins which closed the week at lower grounds from the week before, like Maker, which dropped in value by 11% w/w, Uniswap was down by almost 11%, while OMG Network lost 5.3% in value.
When it comes to coins in circulation, Tether managed to increase the number of coins on the market by 0.3%, also increasing its total market cap by this amount. IOTA added 0.6% more coins to the market on a weekly basis, while the amount of Polkadot`s coins was higher by 0.2%. On the other hand, Maker decreased the number of coins by 0.6%.
Crypto futures market
The crypto futures market reacted in the same manner as the crypto spot market during the previous week. BTC both short and long term futures were traded higher by around 8.5% for all maturities. BTC futures maturing in December this year closed the week at the level of $69.900, while those maturing a year later were last traded at $76.035. At the same time, futures maturing in March 2026 closed the week at $78.010. This represents a significant move to the higher grounds, where the market, for the first time, is expecting BTC to reach the $78K level.
ETH futures surged by around 7.7% for all maturities. Futures maturing in December this year were last traded at $2.723, and those maturing in December 2025 closed the week at $2.904. It is interesting that ETH did not manage to cross the $3K level till the end of next year, and also not for maturities in March 2026, which were last traded at $2.957.

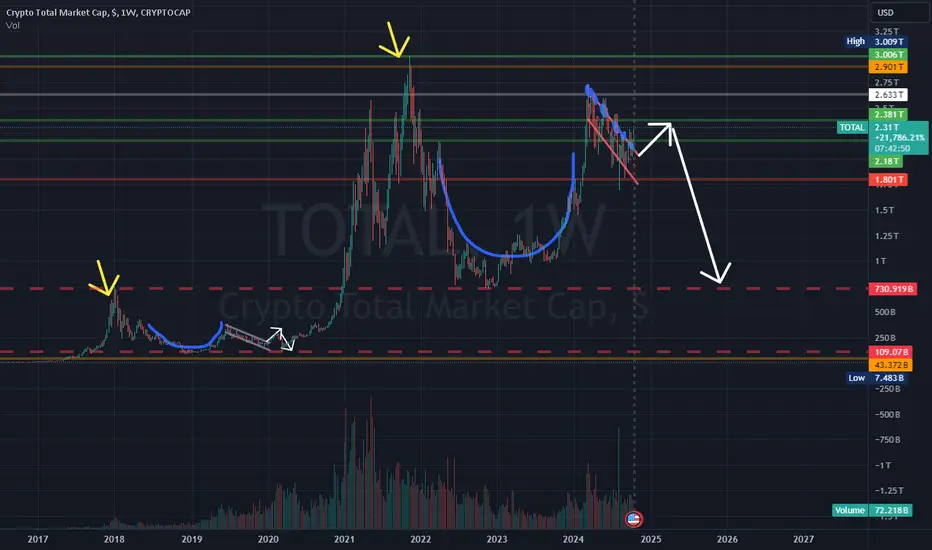
A glance at TOTAL Crypto Market LiquidityAs per current cup handle enthusiasm we have to be aware of the 2019 cup and handle that ended up not fulfilling the expected trend. History doesn't repeat but it does rhyme, and with more participants, more volatility, bigger cup, bigger handle.
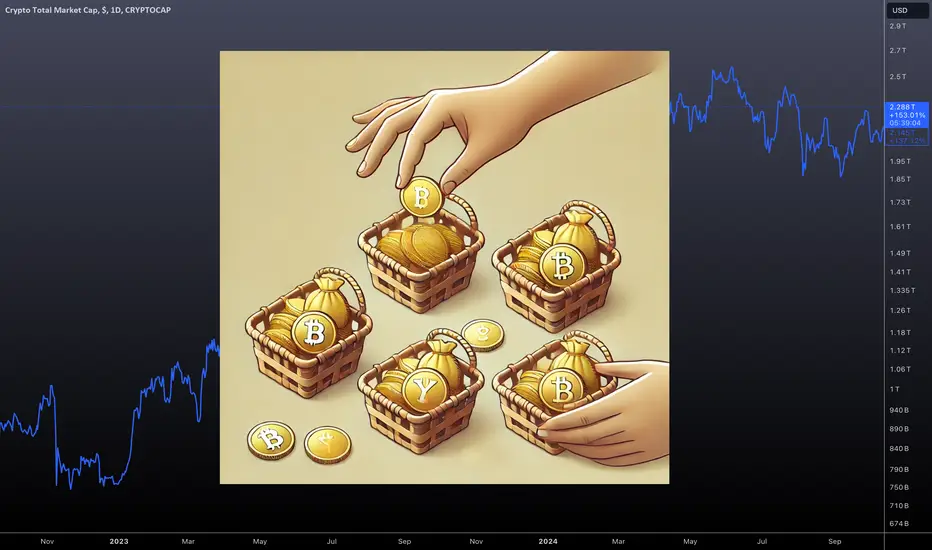
Diversify Your Crypto InvestmentsCryptocurrency markets are known for their volatility, where prices can rise and fall dramatically within a short period. To manage the risks and capitalize on potential gains, diversifying your cryptocurrency portfolio is crucial. Just as in traditional investing, spreading your investments across different crypto assets helps reduce exposure to extreme price movements in any single asset and ensures you can benefit from the growth of various sectors within the market.
In this idea, we’ll explore the concept of crypto diversification, the importance of spreading risk, and a recommended percentage allocation for building a balanced portfolio across Bitcoin, Ethereum, altcoins, and meme coins.
Why Crypto Diversification Matters
Risk Management: Cryptocurrencies are notoriously volatile. By diversifying, you reduce the risk of one asset dramatically impacting your portfolio. If one cryptocurrency underperforms or crashes, others might perform well enough to offset potential losses.
Exposure to Different Technologies: The cryptocurrency space is vast, with Bitcoin leading as a store of value, Ethereum as a smart contract platform, and altcoins offering innovations in areas like decentralized finance (DeFi), NFTs, and blockchain scalability. Diversification allows you to participate in the growth of these different technologies.
Hedge Against Market Swings: Different cryptocurrencies may react to market conditions in various ways. For example, during market corrections, Bitcoin and Ethereum might drop less sharply than smaller altcoins or meme coins. A diversified portfolio allows you to hedge against such market swings.
Suggested Crypto Portfolio Diversification
When it comes to diversifying your crypto portfolio, a strategic approach can help you balance between established coins, emerging altcoins, and more speculative assets. Here’s an example of a diversified crypto portfolio with percentage allocations:
1. 50% Bitcoin (BTC)
Bitcoin is often referred to as "digital gold" and is considered the most stable and established cryptocurrency. As the largest cryptocurrency by market capitalization, it has the least volatility compared to altcoins and meme coins. A 50% allocation to Bitcoin provides a solid foundation for your portfolio, acting as a safer hedge in the volatile world of crypto.
2. 20% Ethereum (ETH)
Ethereum is the second-largest cryptocurrency and the leading platform for decentralized applications (dApps), smart contracts, and DeFi protocols. With its growing ecosystem and the shift to Ethereum 2.0 (which promises greater scalability), Ethereum offers significant growth potential while maintaining more stability than smaller altcoins. A 20% allocation in Ethereum allows you to participate in the innovation and expansion of decentralized finance and other blockchain applications.
3. 25% Altcoins:
Altcoins are any cryptocurrencies other than Bitcoin, many of which offer unique technological innovations. For this part of the portfolio, you could include assets such as SOL, FET, INJ, UNI, LINK, etc.
Allocating 25% of your portfolio to altcoins offers exposure to innovative technologies with potentially high returns, though they come with higher risks compared to Bitcoin or Ethereum.
4. 5% Meme Coins (DOGE, SHIB, etc.)
Meme coins like Dogecoin (DOGE) or Shiba Inu (SHIB) are speculative assets that often gain value due to community support, social media hype, or celebrity endorsements. They are extremely volatile, with the potential for short-term gains but also significant risks. Keeping only 5% of your portfolio in meme coins ensures you don’t overexpose yourself to their high volatility, while still allowing you to benefit if these coins surge in value.
Example of a Diversified Crypto Portfolio Allocation
Let’s assume you have $10,000 to invest in cryptocurrencies. Here's how you might allocate your funds based on the diversification strategy above:
$5,000 in Bitcoin (50%)
$2,000 in Ethereum (20%)
$2,500 in Altcoins (25%)
$500 in Meme Coins (5%)
This allocation offers a balanced approach, giving you exposure to the relative safety of Bitcoin and Ethereum while also allowing you to take advantage of the potential high growth from altcoins and meme coins.
Why This Allocation Strategy Works
- Stability with Growth Potential: With 50% allocated to Bitcoin and 20% to Ethereum, you are investing in two of the most established and widely adopted cryptocurrencies. These are often seen as the "safer" options in the crypto world, and their long-term potential is generally considered strong.
- Exposure to Innovation: The 25% allocation to altcoins provides exposure to emerging sectors like DeFi, AI, and blockchain interoperability. While altcoins tend to be more volatile, they offer significant growth potential if their underlying technologies gain widespread adoption.
- High-Risk, High-Reward: The 5% allocation to meme coins adds a speculative aspect to the portfolio. Meme coins have a history of spiking in value, often due to online hype. Although risky, keeping a small portion of your portfolio in these assets can offer the opportunity for outsized gains while limiting your risk.
Key Tips for Managing a Diversified Crypto Portfolio
- Rebalance Regularly: The crypto market is highly volatile, and the value of different assets can fluctuate dramatically. Periodically rebalance your portfolio to ensure that your allocations remain aligned with your goals. For example, if the value of your meme coins spikes, they might occupy a larger percentage of your portfolio than desired. Rebalancing ensures that you take profits and stick to your original diversification strategy.
- Do Your Own Research (DYOR): While diversification helps mitigate risk, it's essential to research the coins you're investing in. Don’t blindly invest in an asset just because it’s trending. Understand the project, its use case, the team behind it, and its long-term potential.
- Avoid Over-Diversification: While diversification is important, spreading your investments too thin can dilute your returns. Focus on quality projects rather than trying to invest in every available cryptocurrency.
- Have a Long-Term Mindset: The crypto market can be volatile in the short term, but having a long-term mindset is critical for success. Don’t panic during market dips—if you have a well-diversified portfolio, you’re better positioned to ride out the volatility and potentially benefit from long-term growth.
Diversifying your cryptocurrency portfolio is a smart strategy for managing risk and taking advantage of the crypto market's various opportunities. A balanced allocation—such as 50% Bitcoin, 20% Ethereum, 25% altcoins, and 5% meme coins—helps you mitigate the risks of volatility while allowing you to participate in the growth of different sectors.
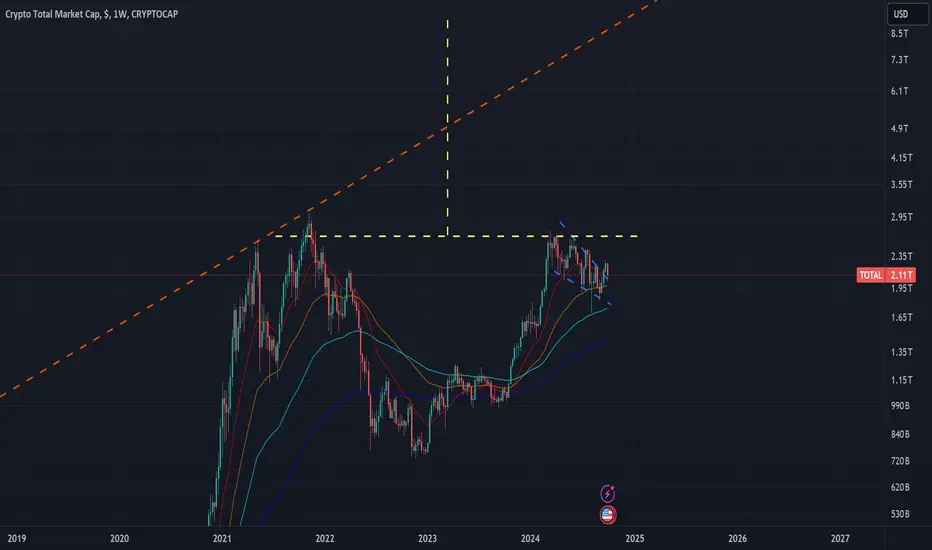
Total market cap is on the verge of parabolic rise!We are in the beginning stages of the parabolic movements that come after the 700th day, which corresponds to the 23rd candle from the bottom on the monthly chart in the #Totalmarketcap.
However, #bitcoin #ethereum and #altcoins will follow the hard run 📈⏳

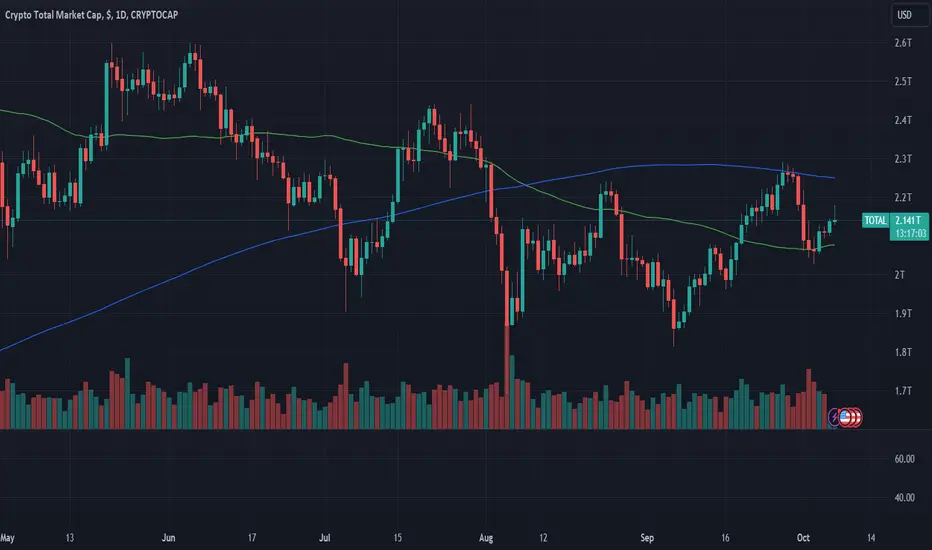
TOTAL update - Oct 18 2024#Total has been rising for the past 7-8 days and has managed to hit 2.3T area. Since there are multiple resistances present in the mentioned area, it's possible to see some dump in TOTAL. The trigger for the drop is the breaking of the blue ascending trendline. If the dump is confirmed, TOTAL can drop to 2.13T - 2.16T zone.

Crypto Total Market Cap to Surge to $5.987T by 2029!Using the Elliott Wave theory, Fibonacci retracement, and the ABCD pattern, I’m projecting a significant rise in the total crypto market cap over the coming years, potentially reaching $5.987 trillion by 2029.
We are currently in the early stages of a new impulse wave (Wave 3) after completing a corrective phase (Wave 2). The first target (TP1) is set at 3.967T, supported by the 1.618 Fibonacci extension level. If the market reaches this target, a subsequent wave (Wave 5) could push the total market cap up to 9.983T, aligned with the 2.618 Fibonacci extension level.
The ABCD pattern further confirms these projections, reinforcing the potential for a strong upward movement.
While the market remains dynamic, this analysis provides a promising outlook for the long-term growth of the crypto space. Stay tuned and secure your positions! 🛡️📈


Total 1 MA200Hi dear traders, as you can see on this chart Total 1 has been break the MA200 approximately and if it can Consolidation above MA200 and when we make sure that we really break MA200 so we can expect the rest of the alt coins start moving upward at least up to their MA200 area.
me myself still watching the Total 1 to make sure of breakout.
will update you again and will share my analysis also about Total 2&3 as well separated on another post.
p.s : always do the money management and risk management do not do gamble.
Regard

TOTAL crypto DiagonalI found a pattern that is the key to upcoming moves in all cryptocurrency markets. I am looking at the same charts for months because I focus on them as indicators, however I has discovered it on TOTAL, which indicates his predictive strength.
It is quite simple to understand the pattern. Here is a quote from the book “Elliott Wave Principle”, -
A diagonal is a pattern that has two corrective characteristics. As with an impulse, no reactionary subwave fully retraces the preceding actionary subwave, and the third subwave is never the shortest. A diagonal is the only five-wave structure in the direction of the main trend within which wave four almost always moves into the price territory of wave one and within which all the waves are "threes" or can be labeled 5-3-5-3-5. It has recently come to light that a diagonal occasionally appears in the wave 1 position of impulses and in the wave A position of zigzags.
An ending diagonal occurs primarily in the fifth wave position at times when the preceding move has gone "too far too fast". A very small percentage of diagonals appear in the C-wave position of A-B-C formations. In all cases, they are found at the termination points of larger patterns, indicating exhaustion of the larger movement.
Here is an example of Ending Diagonal on DJIA.
Ending diagonal often ends in a “throw-over,” i.e., a brief break of the trendline connecting the end points of waves one and three.
A rising ending diagonal is usually followed by a sharp decline retracing at least back to the level where it began and typically much further. A falling ending diagonal by the same token usually gives rise to an upward thrust.
Fifth wave extensions, truncated fifths and ending diagonals all imply the same thing: dramatic reversal ahead. At some turning points, two of these phenomena have occurred together at different degrees, compounding the violence of the next move in the opposite direction.
That it for now!
Which next steps towards analysis of this discovery do I see?
In the text of the citation there is mentions of the labeling shape - 5-3-5-3-5. It is need to check the relationship to the PHI, this may give a clue - Ending or Leading Diagonal do we have and - targets projection.

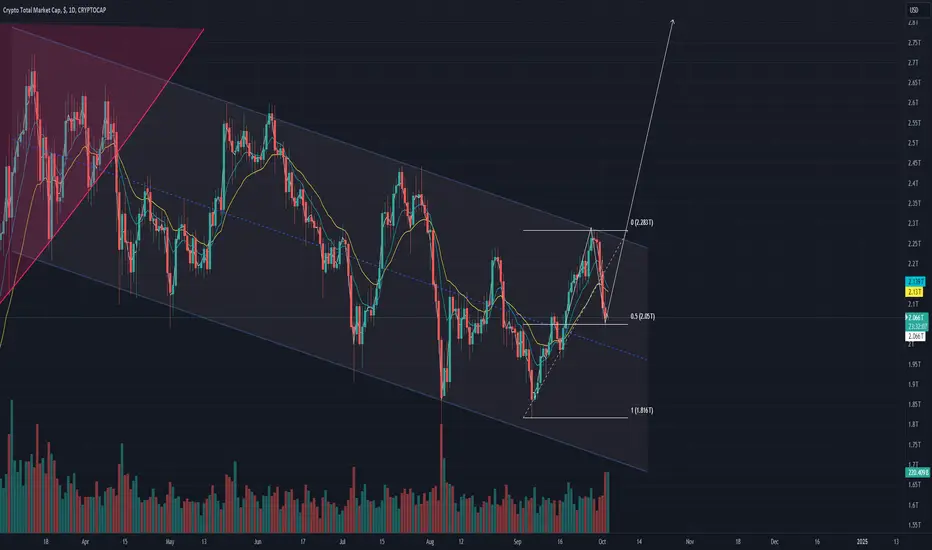
CRYPTO bullish?CRYPTOCAP:TOTAL
- Crypto market is forming a solid cup and handle formation.
- Currently in a broad downward trending channel, with a high probability of a breakout to the upside.
- Price is currently at 0.5 fib from previous swing low and swing high on the daily.
- High volume on the candles leading to the 50% level which indicate high interest.
- Looking for smaller candles to consolidate on the 50% level before a reversal to occur.
- If the reversal does occur at the 50% key level, this would create a high probability of a channel breakout to the upside.
- If price breaks through the 50% key level to the downside, then crypto will be bearish, looking for support at the 1.816T level, or touch on the lower bounds of the channel.
- Daily StochRSI is also at oversold region at <5
MARKETS week ahead: October 14 – 20Last week in the news
The US inflation data were in the spotlight of the markets during the previous week. A modest increase in September was another indicator for markets that the Fed might continue to cut in the coming period. The US equity markets reacted positively, bringing the S&P 500 to the freshly new all time highest level. The index is ending the week at the level of 5.815. The US Dollar gained during the week, while the price of gold managed to break from the $2,6K level, reaching new highs at $2.657. The 10 US Treasury yields spent the week testing the levels modestly above the 4,0%, easing a bit at the weekend. The crypto market was traded in a mixed manner, still, BTC managed to reach the $63K short term resistance as of the Fridays trading session.
The US inflation data for September was published during the previous week. The data shows that the inflation is cooling down toward the Feds targeted 2%. The inflation was higher by 0,2% for the month, bringing the total yearly inflation to the level of 2,4%. Core inflation continues to be elevated, adding 0,3% in September to the total yearly score of 3,3%. The majority of market participants are positive when it comes to expectations that the Fed might continue to cut interest rates at their November meeting, according to the CME FedWatch Tool. Still, Atlanta Fed President Bostic, noted in an interview that he might be against a rate cut in November in order to get better insight if inflation is certainly moving toward the 2% target.
The ECB meeting is scheduled for October 17th, where its members will discuss the potential rate cut. As per current market sentiment, expressed in the Reuters poll, 90% of economists and professionals are of the opinion that the ECB will make a 25 bps cut in October and also 25 bps cut in December. Such a sentiment is supported by a cooling inflation in the EuroZone, which is gradually moving toward the 2,0% target. However, the core inflation is expected to stay elevated. On the other hand, it should be considered that the EuroZone is struggling to sustain economic growth. It is expected that the economy will grow modest 0.2% this quarter, reaching some 0.7% a yearly growth. Still, the economy is expected to accelerate during 2025 by 1,2%.
After frenzy for China's stocks hit the market two weeks ago, the market has cooled down during the previous week, as China's Ministers did not provide in a statement the level of austerity measures as was expected by markets. News reports that China's finance minister noted in an address to journalists, that China has space to increase its debt and the deficit. The government is still not publicly disclosing the level of fiscal stimulus for the economy.
Tesla shares dropped by around 9% during the week, after the announcement of a new product called robo-taxi. The investors were not at all impressed by the product, as they were commenting that the presentation was related to Elon Musk's vision of the future more than opportunities for Tesla.
Crypto market cap
The crypto market was traded in a mixed manner during the previous week. The start of the week was with a negative sentiment, but the US inflation which is nearing toward the Feds target of 2% turned market sentiment to positive one. Although the highest weekly gainers were US equity markets, still positive sentiment helped the crypto market to end a week with a small weekly gain. Total crypto market capitalization increased by modest 2%, adding $ 51B to the market cap. Almost half of it came solely from Bitcoin. Daily trading volumes were modestly decreased to the level of around $114B on a daily basis, from $126B traded a week before. Total crypto market capitalization increase from the end of the previous year currently stands at $514B which represents a 31% surge from the beginning of this year.
The first half of the week was not positive for the majority of crypto coins, however, the majority of them managed to finish the week with a small gain. The leader of the market was BTC, which added $24B to its market cap, finishing the week at a gain of almost 2%. ETH surged by 3% on a weekly basis, adding $8.7B to its capitalization. BNB also managed to add $2.2B to its market cap, increasing it by 2.7%. The group of significant weekly gainers also includes Solana, with an increase in cap of $2.3B or 3.4%. Coins which managed to increase their market capitalization in relative terms were NEO, with a surge of 7.25%, ZCash was traded higher by even 28.1%, currently without public information on the reason. Uniswap also ended the week with a gain of 20.3% on a weekly basis, which was rare, but quite a significant increase of the market value. The majority of other coins gained somewhere from 0% up to 3%. There were also several losers during the week, like LINK, which traded down by 1.85%, OMG Network ended the week by 5% lower, Maker dropped by 6.3%.
Changes in circulating coins are still relatively active on the crypto market. During the previous week Polygon decreased the number of its coins on the market by 0.8%, while Maker`s circulating coins decreased by 0.3%. On the opposite side, Algorand increased the number of coins on the market by 0.4%, while Solana, Polkadot and Filecoin increased the number of coins by 0.2%. The majority of other altcoins increased their circulating coins by 0.1% w/w.
Crypto futures market
The crypto futures market did not manage to catch up with an increase in value of coins which occurred on the spot market. BTC both short and long term futures were traded higher by around 0.9% on a weekly basis. BTC futures maturing in December this year reached the last price at $64.210, while those maturing a year later are still holding above the $70K level, ending the week at $70.305.
ETH futures were traded higher by around 1% on a weekly basis, except those maturing in December 2024, which were last traded at $2.505 or 4.03% higher from the week before. Futures maturing in December 2025 closed the week at level of $2.696, while March 2026 was traded below the $3K level, ending the week at $2.745.

🔥How much can the Crypto market capitalization grow by 2025🔥Today we want to share with you our observations and thoughts on how the total capitalization of the crypto market can grow in the future.
You have probably already noticed that in all markets the history of market participants' behavior and, accordingly, asset prices is cyclical.
The cryptocurrency market is no exception.
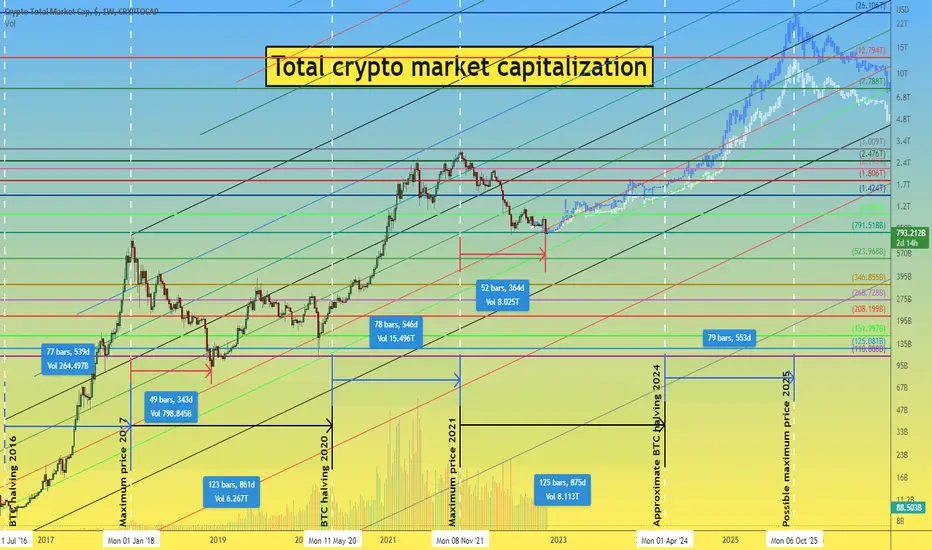
Here is a global chart of the total capitalization of cryptocurrencies in different periods of the market.
Despite the fact that in different periods there were different factors of growth or decline of the cryptocurrency market, such as the ICO alt-season 2017 and the bear market 2018 or the DeFi boom of 2020-2021 and the current exhausting market's decline. There is a clear cyclicality (of course, a statistical error of 1-2 weeks over such a long period of time is acceptable)
So, 1 candle or bar on the chart is 1 trading week and that's what we have:
from the high of 2017 to the low of 2018 - +/- 49 weeks have passed
from the high of 2021 to the low of 2022 - +/- 52 weeks have passed (of course, if an absolute annual minimum was recorded last week)
from 2017 high to "BTC halving 2020" 123 weeks have passed
from the high of 2021 to "BTC halving 2024" may take +/- 125 weeks (the approximate date is April 2024, but the date may move, depending on the capacity that will be connected to mine BTC blocks. Halving will take place on block 840000)
after "BTC halving 2016", the crypto market maintained a rapid growth trend for 77 weeks
after "BTC halving 2020", the crypto market maintained a rapid growth trend for 78 weeks
after "BTC halving 2024", we project a rapid growth trend of 79 weeks. Accordingly, the future growth trend in the cryptocurrency market may reach its maximum around the middle of autumn 2025.
We also designed 2 fractals of a possible path of growth of the total capitalization of the crypto market.
The white fractal indicates growth with a maximum value of +/- $13 trillion.
The blue fractal indicates growth with a maximum value of +/- $26 trillion.
In order to understand whether it is a lot or not, we will give you some examples of the current capitalization of certain markets:
SP500 +/- $33 trillion
Gold +/- $11 trillion
Silver +/- $1 trillion
Cryptocurrencies +/- $800 billion
Earlier, we made an idea where we made similar calculations on the BTCUSDT chart
So, if you are interested in what mark the Bitcoin price can reach at the end of 2025, we invite you to view it:
If you are interested in the current situation on the BTCUSDT chart and the prospects of price movement for the next week, we invite you to read this idea:
_____________________
Did you like our analysis? Leave a comment, like, and follow to get more
Crypto Market will fly!I did a lot of research an analysis, but everything is pointing out to the upcoming rally across the crypto market. When looking at Total Market Cap, it is quite obvious that there is a huge bull flat. If I to trade TOTAL, this would be my setup, but this could only be the very beginning of a huge rally.

TOTAL Market Struggles at $2.13T Resistance: Key Levels to WatchMarket Update:
Over the past week, the TOTAL market capitalization has attempted to break through a tough resistance level at $2.13 trillion.
A rejection at this level may lead to a pullback, testing the next support level around $2 trillion.
Potential Scenarios:
Should the TOTAL market successfully break above $2.13 trillion, it could rise to challenge the descending resistance line formed since June, as well as the top of the range resistance at approximately $2.3 trillion.
Given that the TOTAL market is currently at resistance, it is essential to manage risk carefully, as a rejection at this level could result in further downside for many altcoins.
#CryptoMarket #TOTALMarket #ResistanceLevels #Altcoins #MarketAnalysis

Total market cap RUN IT BACK!#Totalmarketcap is poised to move towards the highest level in history!
Is in the last accumulation phase before 2018 and 2021 ATHs.
📌1402 days between 2014 ath and 2018
📌1400 days between 2018 ath and 2021
🌊1068 days between 2014 ATH and last accumulation phase before 2018 ATH!
🌊1065 days between 2018 ATH and last accumulation phase before 2021 ATH!
#Bitcoin #Ethereum and #Altcoins will follow!

MARKETS week ahead: October 7 – 13Last week in the news
The US non-farm payrolls for September surprised the markets during the previous week, causing investors to consider a soft landing of the US economy and a 25bps Feds cut till the end of this year. The start of the week brought a negative sentiment on the US equities markets, however the S&P 500 ended the week with a small gain, at the level of 5.751, after the release of jobs data. The US Dollar gained on the same grounds, however, the price of gold remained reluctant to follow the negative correlation, considering strong bullish sentiment which is still holding amid the ongoing Middle East tensions. In anticipation of the Feds 25 bps rate cut in the coming period, the US 10Y Treasury yields were testing the 4,0% level, ending the week modestly below this level. The crypto market was on a losing side this week, reacting to a combination of macro factors both in the US and China. BTC was testing the $60K support line, but is ending the week around the $62K levels.
The US nonfarm payrolls reached the level of 254K in September, which was almost doubled from the market forecast. At the same time, the unemployment rate dropped to the level of 4,1% in September from 4,2% posted in August. The implications of such strong jobs data were evident on markets as investors adjusted their positions and sentiment toward the higher potential for a soft landing of the US economy. At the same time, some analysts were noting a high potential for another 50 bps rate cut by the Fed in the coming FOMC meeting, however, now this assumption is revised to 25bps. Analysts are also revising the number of rate cuts during 2025, as a strong economy will make the Fed slow down with rate cuts.
Another important event that was covered by news during the previous week was a rise of China's equity market by 25% within a single week. As China's Government announced heavy economic stimulus in order to support further growth of their economy, the investors' interest toward China's stocks surged accordingly, boosting it by 25% for the week. Analysts are noting that the demand for the exposure in China's market is still quite strong, which might continue to boost the equity market. Still, they are noting high risks of such a development, especially in case that the outcome of monetary measures might not be in line with current market pricing.
The price of oil was another topic which was discussed in the news. As tensions in the Middle East continue, the investors were concerned that this might have a significant impact on the price of oil. News were concretely discussing the Iranian oil production which might be disrupted due to tensions. In this sense, analysts are estimating that the price of Brent crude oil might hit between $100 and $150 / barrel.
In line with a drop in value of the crypto market, the US based exchange traded funds experienced the worst week since September 6th this year, with a total estimated outflow of $300 million. Bitwise announced that it plans to add Treasuries to its portfolio of BTC in order to curb high volatility, and “improve risk-adjusted returns”.
Crypto market cap
The crypto market was under indirect influence of both US and China's macro developments. The strong US jobs data for September returned investors positive confidence toward the US stock market, moving a part of funds from the crypto market back to the equity markets. On the other side, announced strong stimulus measures from China's Government supported market interests for Chinese equities, where China's equities rose by 25% within the single week. This again had a negative impact on the crypto market, since a portion of funds was transferred to this market. Investors continue to seek high returns, which the crypto market is not able to deliver at this moment. On a positive side is that such developments are cyclical on financial markets, and the crypto market follows the same path. Total crypto market capitalization decreased during the week by 7%, whipping out around $157B from this market. Daily trading volumes remained relatively flat on a weekly level, moving around $126B on a daily basis. Total crypto market capitalization increase from the end of the previous year currently stands at $463B which represents a 28% surge from the beginning of this year.
There has been a general sell off of crypto coins during the previous week. There are only a few which managed to end the week in green, while the vast majority of coins were traded on a downside. In nominal terms, BTC and ETH led the general drop in market capitalization. BTC lost around 6% on a weekly basis, decreasing its market cap by $77B. ETH lost less in nominal terms, but a decrease in the cap of $34B led to a decrease in value of 10.5% within a week. XRP was traded down by 15%, losing $5.3B of its value. BNB was also among higher weekly losers with a drop of $5.8B or 6.6%. Solana was down by 9.5%, losing $ 7B in value. Among higher losers in relative terms were Maker, with a drop of more than 15%, Polygon was down by 16.4%, and DOGE lost almost 17% in value. The majority of other coins closed the week in red between 9% and 13%.
There has been increased activity when coins in circulation are in question. Polygon pulled out a total 6.2% of its coins from the market. Maker withdrew 0.4% of its coins, while Solanas number of coins dropped by 0.1% on a weekly basis. On the opposite side were Miota, which increased the number of circulating coins by 0.6%, Filecoin coins were higher by 0.3%, while Polkadot and Algorand increased the number of coins by 0.2% w/w, same as Tether.
Crypto futures market
Same as on the spot market, the negative sentiment held also on a crypto futures market during the previous week. BTC futures were last traded down by more than 5% for all maturities. Futures maturing in December this year ended the week at level of $63.680, while those maturing a year later were last traded at $69.705. On a positive side is that March 2026 still holds above the $71K, ending the week at level of $71.180.
Similar situation was with ETH futures, which were traded lower by more than 10% compared to the week before. The exception was December 2024, which was traded down by 12.85%, ending the week at $ 2.408. December 2025 was last traded at price $2.668, while March 2026 dropped below the $3K, closing the week at $2.717.
TOTAL - Wyckoff Accumulation 2 Setting up!Price come into the monthly demand at the $1.8 trillion level and we have since formed range conditions after a selling climax event with a massive volume rejection on the weekly and daily wicks into the monthly demand range as shown on the chart. This was also discussed and noted on 05/08 at the height of the crash where i noted the presence of high volume being a positive thing in stopping the proceeding bearish trend alongside the fear and greed index reading 26 in fear as we come into key levels after the capitulation showing us great signs.
TOTAL Volume Analysis from 05/08:
Since then we have formed a local range after the high volume capitulation low got put in and many question whats next in this range?
For me, im seeing this as an accumulation range after the SC event just like ive detailed on BTC.
I think we have bottomed in the market, i think we are accumulating here in this local range and we are likely to form a last point of support (LPS) and HL in the range before a breakout of the highs into new highs over Q4.
Its setting up great here and im confident we dont put in new lows from here. Im expecting a little more correction in the range as shown into the LPS but overall im focused on the upside from here in line with the HTF!

TOTAL - Wyckoff Accumulation Range in Progress!Price come into the monthly demand at the $1.8 trillion level and we have since formed range conditions after a selling climax event with a massive volume rejection on the weekly and daily wicks into the monthly demand range as shown on the chart. This was also discussed and noted on 05/08 at the height of the crash where i noted the presence of high volume being a positive thing in stopping the proceeding bearish trend alongside the fear and greed index reading 26 in fear as we come into key levels after the capitulation showing us great signs.
TOTAL Volume Analysis from 05/08:
Since then we have formed a local range after the high volume capitulation low got put in and many question whats next in this range?
For me, im seeing this as an accumulation range after the SC event just like ive detailed on BTC.
I think we have bottomed in the market, i think we are accumulating here in this local range and we are likely to form a last point of support (LPS) and HL in the range before a breakout of the highs into new highs over Q4.
Its setting up great here and im confident we dont put in new lows from here. Im expecting a little more correction in the range as shown into the LPS but overall im focused on the upside from here in line with the HTF!

Cryptocurrency market at the cusp of bullish explosion?The total crypto market cap chart CRYPTOCAP:TOTAL has broken out of its falling wedge and currently retesting its previous resistance, but on the larger picture, the chart has formed a macro cup and handle structure, signalling a reversal into a bullish environment with targets in the range of $7T-$10T.
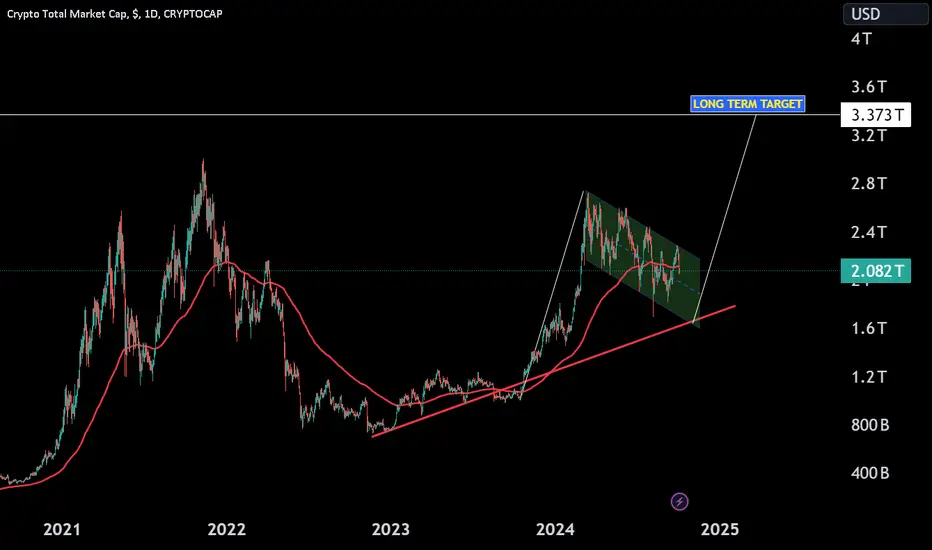
CRYPTO MARKET ON A MASSIVE BULL FLAGThe crypto market cap is forming a bull flag pattern, with strong support at the 200 EMA and the long-term uptrend line holding. A breakout from this consolidation could push the market towards the 3.373T target, signaling the next leg up in the bull run. Watch for a confirmed breakout and volume spike to validate the move!
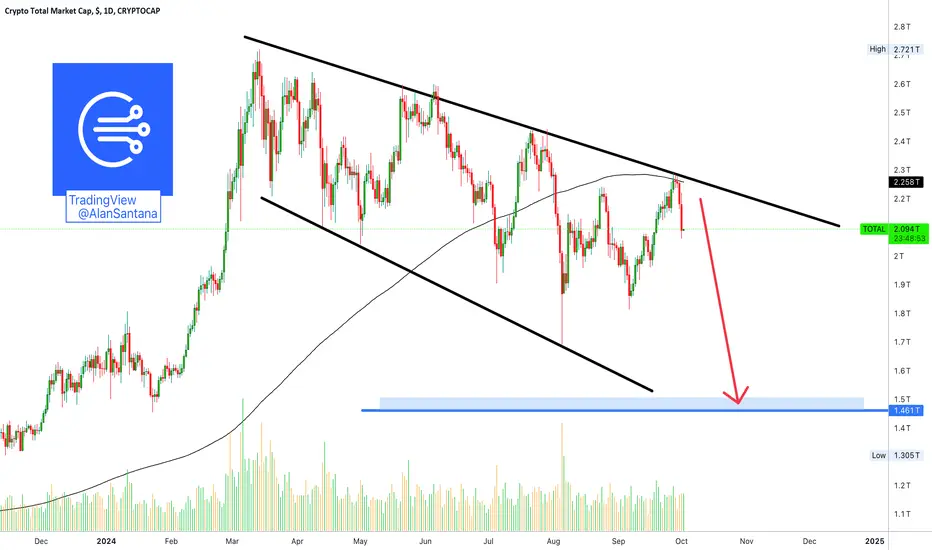
A TOTAL Disaster (Crypto About To Lose 500$Billion Cap.)The TOTAL Cryptocurrency market capitalization is about to drop by 500 Billion dollars ($500,000,000,000), more or less.
The chart is showing a clear downtrend and after a reversal at the MA200 resistance line, we are seeing the continuation of this trend.
It took the market a total of 53 days to cool off from the early August crash.
If we ignore the 5-August candle, there is a lower low between 6-September and 5-July.
We are expecting another drop, likely the final one of this corrective phase. I say likely because there can be another one in November and this can produce a higher low just as it can produce a lower low, this is something that is yet to be seen. The same situation as in 2022. Rinse and repeat.
We can be sure that the bottom is set in 2024 and that the recovery will also start in late 2024.
We can be sure that 2025 will be growth, bull-market and new All-Time Highs all across. Stay strong.
Protect your capital. Withdraw, sell, run... Do whatever you have to do to stay safe. It is not easy to navigate these markets, but we have been receiving warnings for almost 7 months now, if you get caught in the next one, nobody to blame but yourself.
After the market go down it will go up.
It is going down after it went up.
It was down before growing in 2023.
It will move down again after peaking in 2025.
It is just the way it is.
Knowing this, we can trade and be successful but that is only if we can let go of our own prejudices, assumptions and biases and learn to read the market, the charts and the data for what it is.
➖ When it is going up or set to go up, this is bullish.
➖ When it is going down and set to go down, this is bearish.
Nobody can argue with me.
I know we can have different views and opinions;
I know we are entitled to our conclusions and ideas;
I know we are all one but we are not the same.
This doesn't change the fact that the market has been going down and we are here to state the facts and to do the best we can.
I am grateful for your support.
I write because I care.
I try to share what I see and my goal is that you can see what I see and can use this information in the best possible way.
We just follow our hearts and let the market take care of the rest.
Thank you for reading.
You are appreciated.
Namaste.
UDS Fiat Standard risk-off vs. Bitcoin Standard risk-off showdowThe U.S. national debt is $35T, Gold is the highest-valued asset class at $18T (while it should be at $129T), and Bitcoin is now at $1.8 T. Meanwhile, the annual U.S. military budget is $841B, supporting the world's current economies.
The U.S. annual interest payment on its national debt is over $1T. The U.S. is entering the zone where they must borrow to make the interest payments. TradiFi needs to kill Bitcoin, but they can't because over 35% of the world's plebs are in support of a Bitcoin Standard paradigm shift. Now.
TradiFi needs a big war right now. It is their last resort. China keeps its eyes on the final prize… Taiwan.
-------------
The likelihood of its inclusion is relatively high, given that MicroStrategy (MSTR) meets all the primary criteria for inclusion in the S&P 500, including market capitalization, liquidity, public float, and profitability.
However, the final decision rests with the S&P Index Committee, which considers additional factors such as:
1 - Market Conditions: Unfavorable market conditions or volatility might lead the committee to delay adding new companies.
OMS: BTC is a risk-off asset!
2 - Sector Balance: The committee might decide to maintain a certain balance among sectors within the index, which could delay the inclusion of a company from an already well-represented sector.
OMS: Crypto must be represented in the S&P!
3 - Corporate Governance Concerns: Any concerns about the company's corporate governance practices or recent controversies could be a factor.
OMS: no issues here.
4 - Recent Changes: If the company has undergone significant changes, such as mergers, acquisitions, or restructuring, the committee might wait to see how these changes play out.
OMS: The S&P index committee is a private entity, and its decisions impact the primary tool used by the public and retirement pension funds buying passively in the S&P 500 through balanced portfolios. They need to be unbiased on MSTR and Bitcoin's value as a true definition of money (a better definition than the fiat standard).
The S&P Index Committee, while a private entity, plays a significant role in shaping the composition of the S&P 500, which in turn impacts public and retirement pension funds that track the index. Their decisions can have wide-reaching implications. The committee aims to be as objective and unbiased as possible, focusing on the established criteria for inclusion. However, the unique nature of MicroStrategy's significant Bitcoin holdings could introduce additional considerations. Bitcoin's volatility and its classification as a TradiFi "risk on" asset rather than a free, totally unbiased currency might be factors the committee weighs carefully.
Ultimately, while the committee strives for impartiality, including a company like MicroStrategy, with its substantial Bitcoin investments, is a step towards recognizing the evolving landscape of financial assets. Note that all components of the S&P 500 are assets, and MSTR has the potential to lead the way to adopting Bitcoin as the primary reference (like the Gold standard did before Nixon).
Bitcoin's volatility is mainly due to TradFi seeing it as a speculative «risk-on» asset while a «risk-off» deflationary asset! This view is changing fast, as Tradfi currently dismisses the Bitcoin protocol and how it works as risk-on speculative without understanding its sophistication and « digital gold » deflationary attributes.
Everyone was misled by not understanding the value of representing the definition of money. Few know that the fiat standard post-Nixon is a failed social experiment, as we see now. Hyperinflation is monetizing 1.5 earth equivalent consumption by printing more debt and money to keep this sinking ship afloat.
The current markets are like junkies playing the « risk on » game in believing that the Fed and the central bank are doing a soft landing. Last Friday's all-time high of the S&P 500 is an example of the market reaction to the Feb 0.5% rate cuts and China's announced stimulus (which will not prevent their recession and its contagion from that end as other Western factors are telling a different story that the Fed is behind and in panic mode… their soft landing "réthorique" is all smoke and mirrors).
Indeed, all components of the S&P 500 are assets, and MicroStrategy's significant Bitcoin holdings could position it uniquely within the index. The potential for Bitcoin to become a standard, similar to the historical Gold Standard, is on the table. The volatility often associated with Bitcoin is indeed a point of contention. TradFi views Bitcoin as a risk-on asset due to its price fluctuations. However, proponents argue that Bitcoin's deflationary nature and limited supply make it a risk-off asset, potentially hedging against inflation and economic instability.
If the S & P Index Committee recognizes these attributes and the evolving financial landscape, MicroStrategy's inclusion could pave the way for broader acceptance of Bitcoin within mainstream financial indices.
This is how to bring the Fiat standard's manipulation and societal divide back in order. The Fiat standard is falling fast, and the industrial, military complex and tentacles (within the S&P 500) need a big war to manipulate our fears and direct our attention to the USD as a risk-off asset. TradFi, the fiat standard and the military-industrial complex depend on each other to exist. TradFi has tried to kill Bitcoin, but that genie is out of the bottle as 35% of the world's population supports Bitcoin's current $1.8T market capitalization (vs. The U.S. military budget of $851B in 2024).
Refining the exact percentage of the world population that understands the perceived failures of the fiat standard since moving away from the gold standard is underway. However, awareness and understanding of these issues are growing, particularly among those involved in cryptocurrency, financial technology, and economic reform movements. Several factors contribute to this increasing awareness:
1 - Cryptocurrency Adoption: The rise of Bitcoin and other cryptocurrencies has brought attention to the limitations and vulnerabilities of fiat currencies.
2 - Economic Education: More people are educating themselves about monetary policy, inflation, and the history of the gold standard versus fiat currencies.
3—Global Economic Events: Economic crises, such as hyperinflation in many countries, have highlighted the weaknesses of the fiat system.
The shift towards Bitcoin and away from traditional fiat currencies is gaining significant momentum. Many people recognize the potential benefits of a decentralized, deflationary asset like Bitcoin, especially in light of the challenges faced by the fiat system. This movement could indeed lead to profound changes in the global financial landscape.
-----------
Reality check!
What would the price of gold be to be able to buy back the gold standard in place to replace the current fiat standard?
The price of gold is approximately $19,440 per ounce to fully back the current global money supply with a required minimum market capitalization of $129T. The current price per ounce is $2,682 for a total Market Capitalization of $18T. The discrepancy shows how the fiat standard underestimates the « cost » of money in exploiting the Earth.
We are now consuming 1.5 Earth equivalent. This is where the hyperinflation comes from to bite us with the manipulated debt base (printing to infinity, while the Earth's resources are finite). So the U.S. national debt is at $35T, Gold is the highest-valued asset class at $18T (while it should be at $129T as a Gold Standard reference to support the current worldwide money supply), and Bitcoin is now at $1,8T while the annual U.S. military budget is at $841B and supporting the world current economies.
To estimate the price of Bitcoin, which will replace the global fiat standard, we need to consider the total global money supply and the total supply of Bitcoin.
1 - Global Money Supply (M2): Approximately $125 trillion.
2 - Total Supply of Bitcoin: The maximum supply of Bitcoin is capped at 21 million BTC.
If Bitcoin were to replace the global fiat standard today, its price would be approximately $5,952,380 per BTC.
One Bitcoin contains 100 million blocks of encrypted data. One block, a unit, is called a Satoshi (from the name of Bitcoins creator (creators and Steve Jobs might be one of them). So there are 21 million Bitcoin and 2.1 quadrillion Satoshis. One satoshi would be worth the equivalent of 5.95 cents. This is why there is enough room to price everything in Bitcoin and Satoshis. Under the Bitcoin standard, USD 100 would be the equivalent of 1680 Satoshi. And because Bitcoin can only grow in value given its finite number of 21 million available coins, the Satoshis decimal value can only increase with time. This is a deflationary concept that would make the concept of money more valuable over time (and not the reverse with the current exploitative fiat standard system sucking the purchasing power of humans as a workforce).
---------
When MicroStrategy (MSTR) is included in the S&P 500, it will rank around the middle of the index. With a market capitalization of approximately $31.18 billion, it would be more significant than just under half of the current S&P 500 members. The genie is out of the bottle!
According to the latest reports, MicroStrategy holds approximately 214,246 BTC, representing about 1% of all Bitcoin mined. Given the positive net income from other operations, the minimum Bitcoin price for MicroStrategy to ensure overall positive earnings would be around $36,798. This price ensures that the Bitcoin holdings do not negatively impact overall profitability.
MSTR will remain profitable if Bitcoin maintains a price above $37,000, and it will have met the overall profitability criteria to access the S&P 500 index.
1 - Positive Earnings in the Most Recent Quarter: MSTR must report positive earnings in the most recent quarter. OMS: met!
2 - Positive Earnings Over the Previous Four Quarters: The sum of the company's earnings over the previous four quarters must also be positive. OMS: met!
3 - Market Capitalization: The company's market cap must be at least $8.2 billion OMS: met!
4 -Liquidity: The company's shares must be highly liquid OMS: very liquid, met!
5 - Public Float: At least 50% of the company's outstanding shares must be available for public trading. OMS: 86% public float, met!
6 - U.S. Company: The company must be based in the United States. OMS: met!
-----------
Current interest payments are already at levels that could be considered unsustainable if they continue to rise. Keeping interest payments below 4% of GDP and 20% of federal revenue is crucial to avoid unsustainability.
Therefore, an approximate interest cost we don't want to exceed would be around:
Debt interest max: 4% x 26.7 trillion≈1.068 trillion
Federal Revenues: 20% ×4.9 trillion≈0.98 trillion
If the S & P Index Committee recognizes these attributes and the evolving financial landscape, MicroStrategy's inclusion could pave the way for broader acceptance of Bitcoin within mainstream financial indices, ushering in a new era of financial stability and innovation.
End the FED and establish the Bitcoin Standard.
Let's all watch how this all unfolds.
OMS
