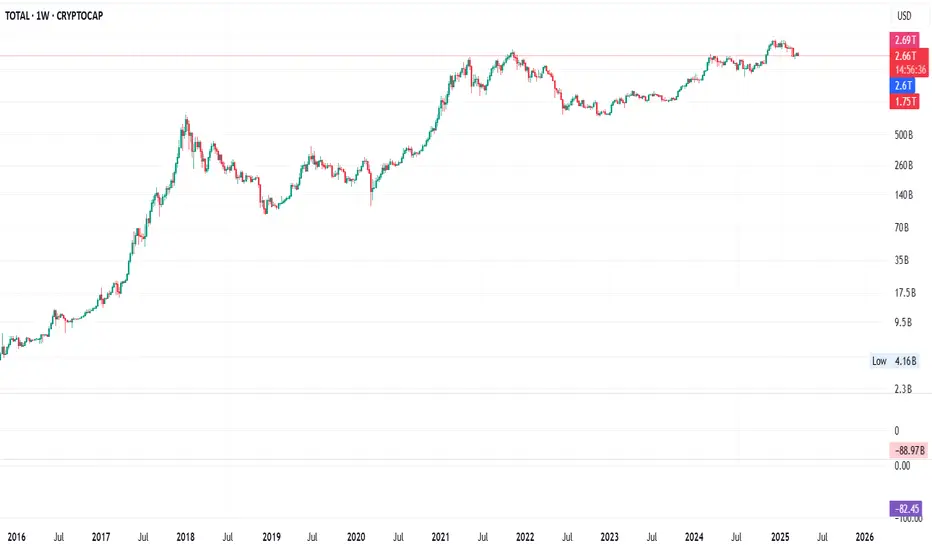
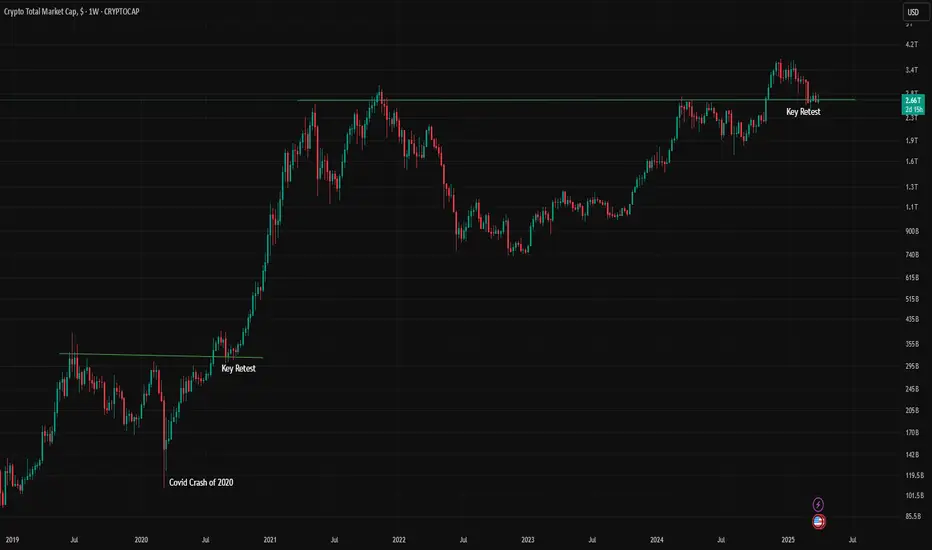
TotalTotal has broken out of short-term descending overhead, after almost making a perfect retrace on a prior peak. A key retrace. It just needs to break up from here, and it’s all good. BTC.D is consolidating under 64%, so keep watching that. I’m calling for 95% test.
TOTAL trade ideas
Starts Late, Ends Late: 2026 Bull Market?Market conditions are so different now. Everything is changing fast and radically, it has to do with the stars. The way the stars are aligned now has not happened in hundreds of years. The type changes we are seeing now have not happened in hundreds of years.
It is not only the financial markets but the whole world and the way we perceive reality is changing in so many ways. This is certain to have its effect on the Cryptocurrency market, the effect is already present and tangible, market conditions (reality) will never be the same.
The bull market is starting late. By this date in 2021, everything was up and up really strong. Some pairs had already peaked, literally, some altcoin trading pairs had already peaked by April 2021. The full cycle complete. Thousands of percentages of points of growth.
What about now? It is April 2025 and the bottom is in on many pairs. Only last week, 7-April, we had a marketwide bottom. The start of the 2025 bull market cycle and phase. A late start can translate into a late end.
Now, a full bullish cycle can be completed in 6 months. This is not necessary nor required. Also, the market is much bigger now, it wouldn't be feasible, there would be too much rush.
Think of the market as an entity that wants to survive, thrive, live and grow. Can it go through years of bearish action and only produce several months of growth? Balance is needed. The market needs a bullish cycle to keep the participants engaged or else everybody will quit forever if there is nothing to gain.
The fact that the Altcoins market hit bottom is the most bullish signal there is, but, looking at all these charts, hundreds of charts, something tells me that what is coming will be different to the past. Actually, it will be similar because the last bull market happened from March 2020 through late 2021. So we can have a bull market from April 2025 until some time in 2026. I just don't believe that everything will end too fast, within six months, because we are having a late start. It will be the other way around, the bull market will extend.
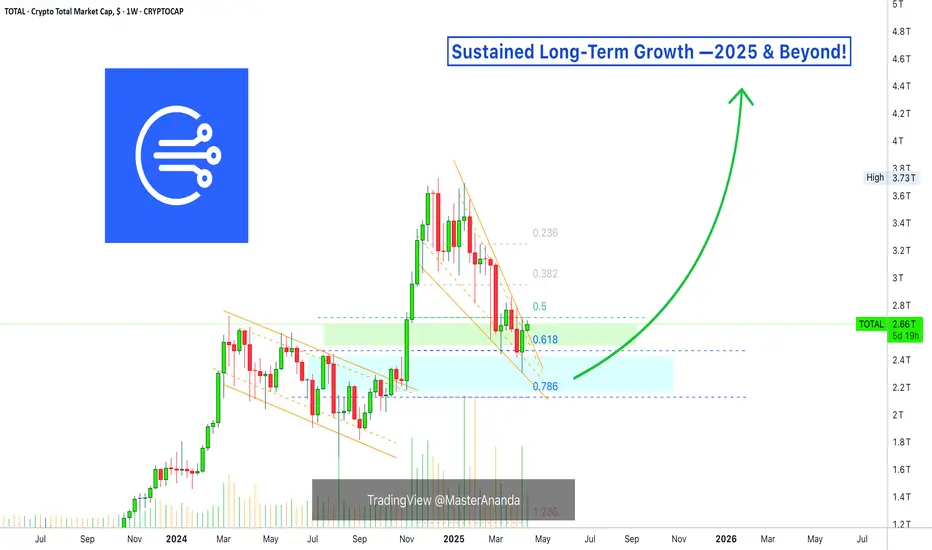
Instead of Cryptocurrency growing for 1 year, we might get continued growth for 2-3 years straight, maybe more for some pairs. Some pairs have been dropping for 4 years while others have been down for 6 years or more. When things change, these pairs will be experiencing sustained long-term growth.
Other pairs grew strong and never moved below support. These pair were supposed to drop according to classic past patterns and yet, they all remained strong and ready for more. This bull market will be out of the ordinary. Everything that is happening right now in finance and politics is not the same as always, it is a true generational change.
We are going through a phase of evolution and this is what will cause the bull market to extend. Late start, late end.
Namaste.
i smelll it part 2Something is on the horizon. Maybe are distracted by tariffs. Always ask what hey are distracting you from...
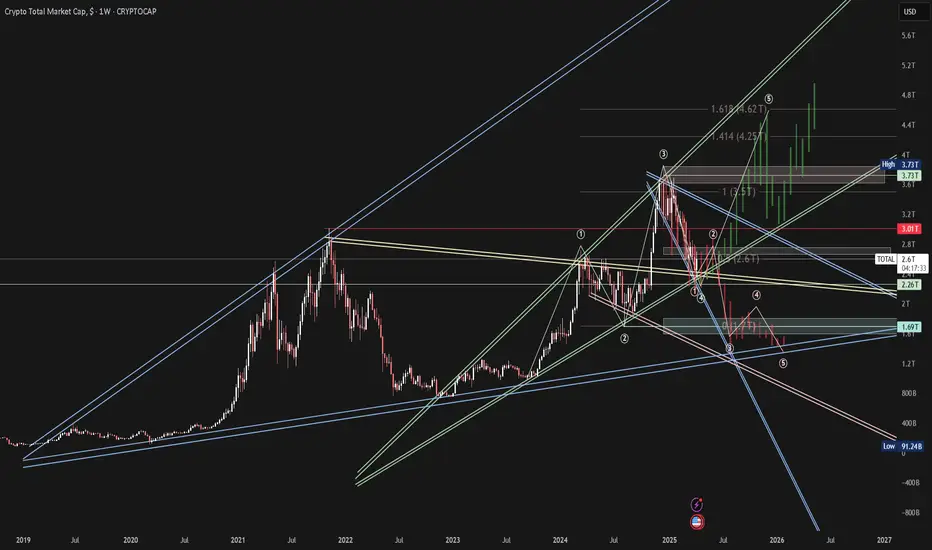
$4.6T Peak by Dec 2025 or $1.3T Bottom Is the crypto market cap poised for a final euphoric rally to $4.6T by December 2025, or are we backtesting resistance before a brutal drop to $1.3T by January 2026? My analysis, based on major trend lines, Elliott Wave patterns, and historical price action, suggests both scenarios are in play. Let’s break it down.
Bullish Scenario: $4.6T by Dec 2025
The total market cap is riding an ascending channel from the 2022 lows (~$800B). My trend lines show resistance at $3T-$3.5T, where we’re currently testing. Historical cycles (2017, 2021) often end with an extended 5th wave, driven by altcoin mania and institutional FOMO. If we break $3.5T, the next Fibonacci extension (1.618) targets ~$4.6T, aligning with Q4 seasonality (crypto’s strongest quarter). Key support at $2.5T must hold for this to play out. A Bitcoin breakout above $100K or Ethereum hitting $5K could fuel this rally, with DeFi and Layer-2 tokens adding juice. Risk: Overbought conditions could cap the move early—watch for RSI divergence at resistance.
Bearish Scenario: $1.3T by Jan 2026
Alternatively, my wave count suggests we’re in a corrective wave 2, backtesting $3T resistance after wave 1 peaked. If rejected here, wave 3 could drive a steep correction to $1.3T, a 0.618 Fibonacci retracement and prior support from mid-2023. Historical bear markets (2018: -88%, 2022: -73%) show crypto’s vulnerability post-peak. My trend lines mark $1.5T-$2T as interim support, but a macro shock—rising yields, regulation, or recession—could push us lower. Timing Risk: Jan 2026 is aggressive; a bottom might extend to Q2 2026 absent a clear catalyst.
Why These Levels?
Trend Lines: The ascending channel and $3T resistance are clear on the weekly chart. A break above confirms bullish momentum; rejection signals bearish reversal.
Historical Action: Past cycles show parabolic tops followed by 50-80% corrections. $4.6T fits euphoria; $1.3T fits pain.
Patterns: Elliott Waves align with my markings—wave 5 for bulls, wave 3 for bears. The $1.3T level matches the 200-week MA, a cycle bottom indicator.
What to Watch:
Bullish Confirmation: Break above $3.5T with volume; Bitcoin holding $80K+.
Bearish Confirmation: Rejection at $3T, break below $2.5T support.
Invalidation: Bullish case fails below $2T; bearish case fails above $4T.
This isn’t a prediction but a map of possibilities. My drawings highlight the levels and patterns guiding my view—check them on the chart. What do you think—bullish blow-off or bearish breakdown? Let’s discuss!
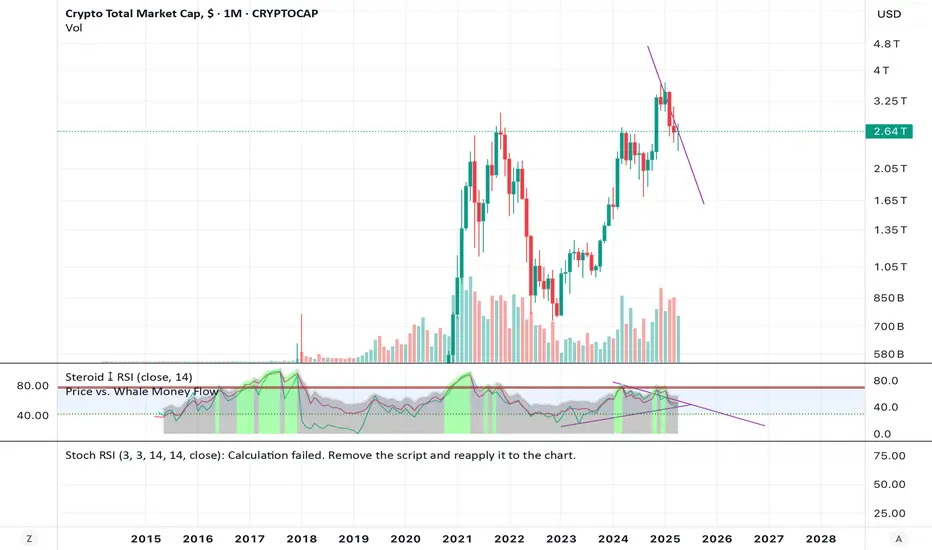
Total Crypto market capthe total crypto market cap look like it has completed a complete 5 wave macro cycle. considering the uncertainty of the coming trade war. it is possible the market has already topped and we should be seeing a deep correction in the coming months.
it also note worthy to consider that GOLD, nasdaq , SNP500 and dow jones are forming the same market structure. Will there be a recession coming? what will the current black swan catalyst be?
stay safe and trade with the trend. trade the chart stick to the plan and dont let emotions get the best of you.

MARKETS week ahead: April 13 – 18Last week in the news
Tariffs rollercoaster continued also during the previous week, with a glimpse of improved market sentiment. However, analysts are now questioning whether optimism is sustainable at this moment? The US Dollar significantly lost in value during the week, bringing the price of gold to its fresh, new all time highest level at $3.240. The US Treasuries had a strong reaction, where the 10Y benchmark yields continued to surge, ending the week at 4,49%. The US equities had another rollercoaster week. On Wednesday, the S&P 500 had an upside move of around 10%, which is extremely rarely seen on the equity markets. The index closed the week at the level of 5.363, after reaching its lowest weekly level at 4.845. The crypto market was also affected with the negative sentiment at the beginning of the week, but still, as of the week-end BTC managed to test the $85K resistance.
All macroeconomic news are put aside at this moment, as the market is looking only at word “tariffs”, which is currently the most popular word also among world leaders. The US Administration said that they will put tariffs on hold for the majority of countries for the next 90 days, except for China. Another news is related to decreased tariffs to 10% which will now be imposed on the majority of countries in the world. However a tariffs-war between the US and China continues. At this moment, the latest news is that the US is imposing tariffs of 145% to China, while China is imposing tariffs of 125% on goods imported from the US. Whether this is going to be the final tariff outcome, no one knows. As per comments from China officials, they are not ready to back up. The Chinese finance minister commented “Even if the U.S. continues to impose higher tariffs, it will no longer make economic sense and will become a joke in the history of the world economy”. Many analysts agree with the absurdity of such high tariffs, while there are few who still believe in the “Art of the deal”.
Negative effects of tariff war are already reflected on the US supply chain. Majority of goods imported from China cannot be distributed further to retail stores, as companies are not sure which tariffs to apply. On the other side are mortgage loans, which surged to the level of 7% for the period of 30 years. The University of Michigan Consumer Sentiment results were posted during the previous week, with surprisingly lower figures from expected one. Certainly, currently most important are inflation expectations of US consumers, which surged to the level of 6,7% from 5% expectations in March.
The recession fears are again among investors. The famous US investor and CEO of BlackRock, Larry Fink, noted during the previous week in an interview his opinion that the US is “very close, if not in, a recession now”. Regardless of the current sentiment, he thinks that “megatrends” in the US economy, like artificial intelligence, would persist.
Crypto market cap
CRYPTO MARKET
Two weeks ago the crypto market was left behind investors' view during the general sell off on traditional markets, however, the situation changed during the start of the previous week. Some optimism came at the week-end, bringing another highly volatile week on the crypto market. Total crypto market capitalization was increased by 2% on a weekly basis, mostly due to the surge of BTC at Saturdays trading session, bringing additional $ 44B to the market cap. Daily trading volumes remained relatively stable compared to the week before, moving around $130B on a daily basis. Total crypto market increase from the beginning of this year, currently stands at -18%, with $567B outflow of funds.
Previous week was generally the volatile one, with almost equal numbers of coins which ended the week in red, and those with a green weekly gain. BTC gained mostly at Saturday's trading session, where it managed to end the week with a 2,3% weekly gain in market capitalization, bringing almost $ 40B to its market cap. On the opposite side was ETH, which lost significantly during the week, decreasing its market cap by 8,1% or almost $18B. At the same time, XRP was traded flat during the week, same as BNB. Among significant gainers was Solana, with a surge in market cap of more than 10%, or $6,3B. Maker was up by 5,3%, while Algorand surged by 4,5%. Among weekly losers were Monero, with a drop of more than 3%, Theta was down by 2,6%, same as Stellar. This week Uniswap and Stellar also closed the week in red, with a drop of around 5%.
With respect to coins in circulation, this week, both XRP and Stellar increased their number of coins on the market by 0,2%. Solana also had an increase in the number of coins of 0,3%, while Filecoin, traditionally is increasing its circulating coins, this week by 0,4%.
Crypto futures market
The negative sentiment from the spot market was also reflected in the crypto futures. This week was different for BTC futures, as there has not been evident the same level, linear drop in the value of futures for all maturities. The short term futures had a modest weekly decrease of around 0,5%. At the same time December 2025 ended the week by 1,3% lower, at the level of $87.695. Longer maturities had a larger weekly drop in the value of futures of more than 4%. In this sense, December 2026 closed the week at $93.115, or 4,7% lower. On a positive side is that longer term maturities are still managing to hold above the $90K levels.
ETH futures had a linear decrease in the value of future contacts by more than 13% for all maturities. December 2025 ended the week at the level of $1.650, while December 2026 was last traded at $1.778.

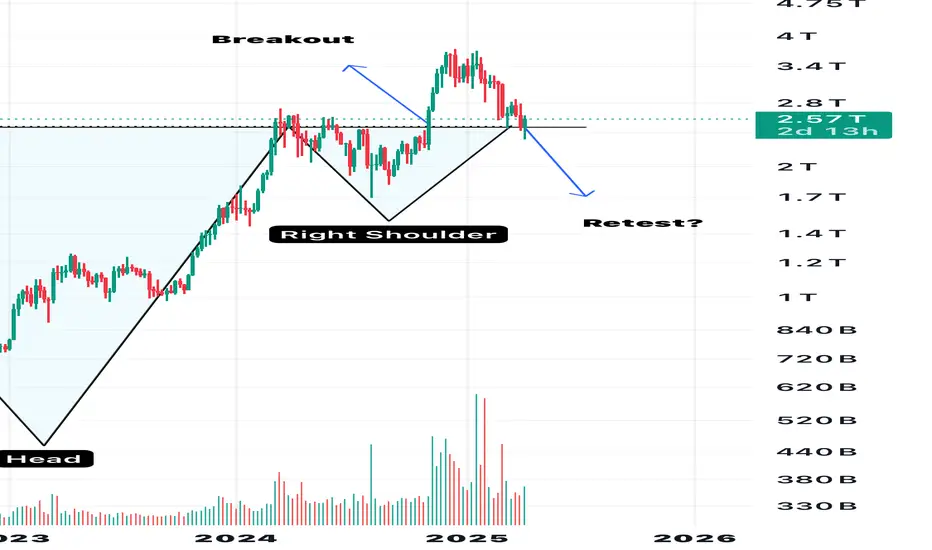
Successful Retest Not Confirmed YetAccording to this weekly chart, an inverse H&S can be spotted. Price easily broke through previous ATH resistance and currently is being challenged to form a support replacing the ATH as resistance. Daily RSI is also pointing to a potential midiun term market reversal. In conclusion, clueless and optimisitc.
crypto TOTAL and BITCOINBitcoin is a decentralized cryptocurrency originally described in a 2008 whitepaper by a person, or group of people, using the alias Satoshi Nakamoto. It was launched soon after, in January 2009.

HOW IS CRYPTO SHAPING UP?Trump and tariffs have a firm grip on the economic world as of late, so where does that leave the crypto market?
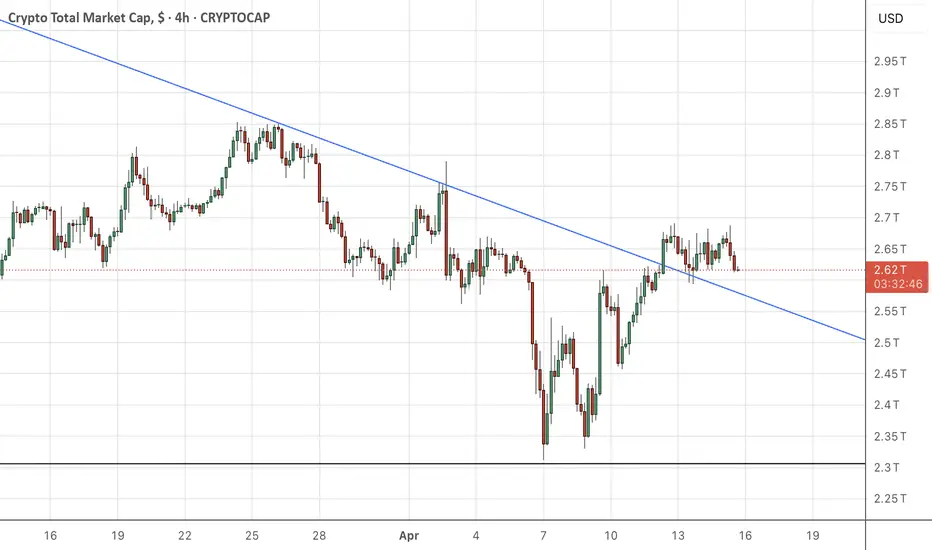
TOTAL has a clear structure since the beginning of the bull market in 2023, in the last 3 days TOTAL has wicked into the bullish trendline support but sits within a bearish trend channel. This level also coincides with the bullish orderblock that started the leg up post US election so a very strong level of support here.
Do I think this is the end and the bottom is in? The chart would make a very good case for it however I believe that the Geo-politics outweigh Technical Analysis currently, at least in the short term. Everyone is watching for the latest news release/Trump announcement and all the time that is going on the market is very reactionary with less passive orders and more reactionary news based market orders. That taken into account in the short term this is a game of musical chairs with massive volatility swings and liquidations left right and center, a traders dream.
I'm very interested in how the FED will react to this, once we start getting emergency or early interest rate cuts that for me is when BTC will take the next step up and will flip to an investor/buy and hold environment, whether that's from here, lower or higher I'm not sure but but BTC needs a risk-on environment to thrive and Trump is doing his best to force J Powells hand.

Total retraceCan we be looking at a key retrace in the total crypto marketcap? Methinks yes. Confirmed if it pumps higher from here. Keep an eye on BTC.D, as I’m calling for 95% test.
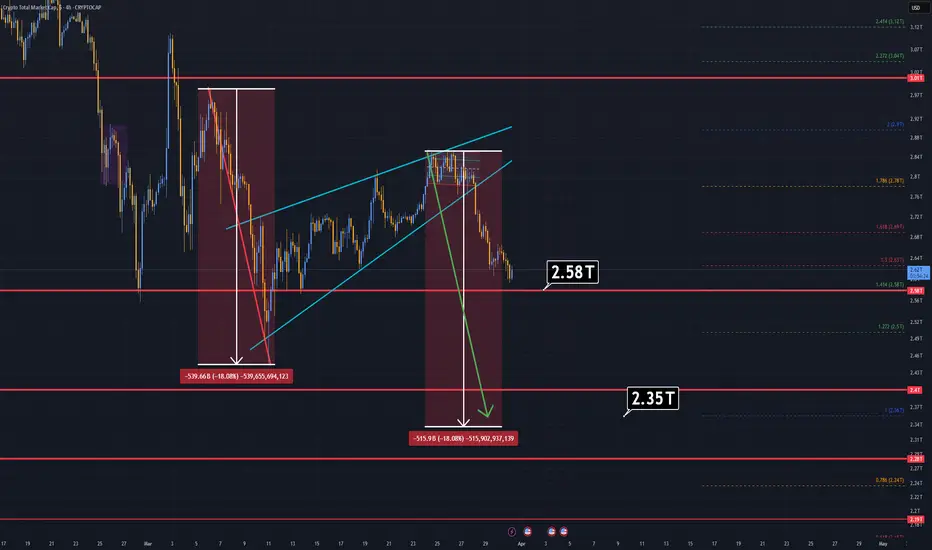
TOTAL Bearish PennantThe Parameter known as TOTAL has a currently working bearish pennant formation.
Market is bearish and every green candle on Total means another Short opportuinty.
If Total breaks 2.58T (which is a montly pivot value), we can expect more dumps. 2.36 would be the main target.
When Total reachs 2.36, look for a long wick. If the daily candle close isn't happening, it's a Long opportuinty.
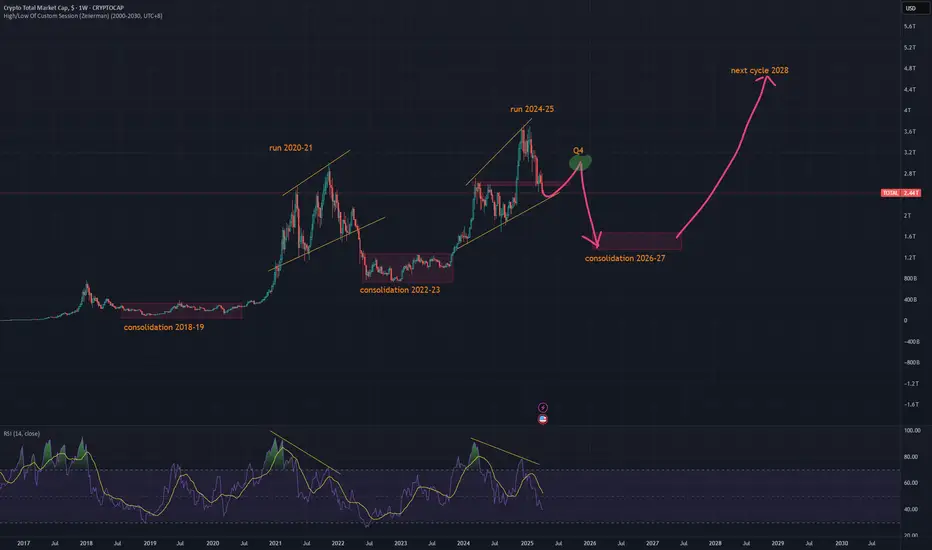
UNTO THE 2028 CYCLEThis 'MIGHT' be the market how will go.
Keypoints:
- 2 Year consolidation after runs
- The last run for alts seems poured out on SOL and meme coins and OG coins
- Bearish divergences, looming recession, tariff, impending war threats and so on
TOTAL drops to 1,900 billion USD, and BTC will fall to 62k?TOTAL will soon decrease to the range of 1,670 billion USD to 1,900 billion USD?
Note: The response version of the AI Agent
To estimate the price of Bitcoin (BTC) when TOTAL drops to 1,900 billion USD and BTC.D (Bitcoin Dominance) is at 65%, follow these steps:
Step 1: Calculate Bitcoin's Market Cap
TOTAL (total crypto market cap) = 1,900 billion USD.
BTC.D = 65%, meaning Bitcoin accounts for 65% of the total market cap.
Bitcoin’s market cap = TOTAL × BTC.D = 1,900 billion USD × 0.65 = 1,235 billion USD.
Step 2: Determine BTC Circulating Supply
As of April 7, 2025, Bitcoin’s circulating supply is approximately 19.85 million BTC (based on recent data, with roughly 900 BTC added daily from mining, but this remains stable enough for our estimate).
Let’s assume a circulating supply of 19,850,000 BTC for simplicity.
Step 3: Calculate BTC Price
BTC price = Bitcoin’s market cap / Circulating supply.
BTC price = 1,235,000,000,000 USD / 19,850,000 BTC ≈ 62,216.62 USD.
Conclusion
When TOTAL falls to 1,900 billion USD and BTC.D is at 65%, the price of 1 BTC would be around 62,216 USD.
For the lower range of 1,670 billion USD (as mentioned):
Bitcoin’s market cap = 1,670 billion USD × 0.65 = 1,085.5 billion USD.
BTC price = 1,085,500,000,000 USD / 19,850,000 BTC ≈ 54,684.13 USD.
So, in this scenario, BTC’s price could range from approximately 54,684 USD to 62,216 USD, depending on whether TOTAL hits 1,670 billion USD or 1,900 billion USD.

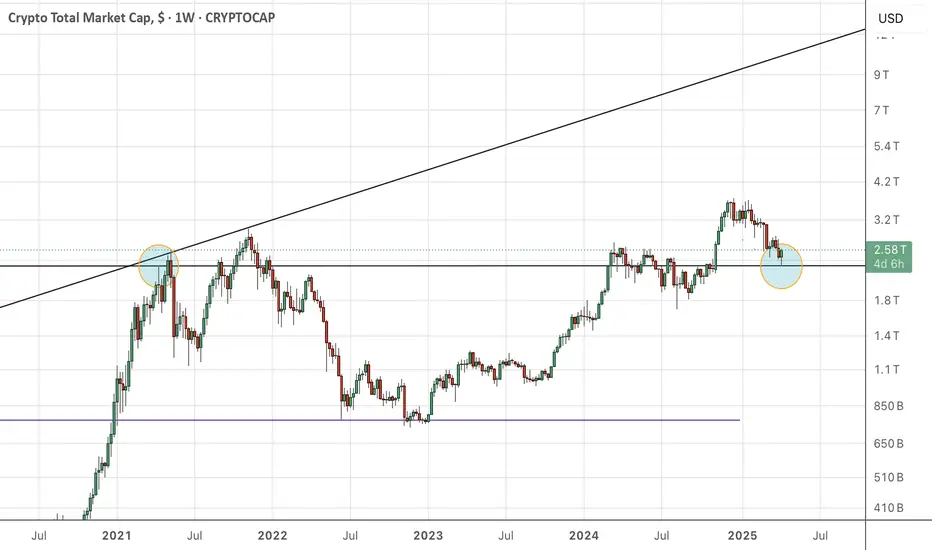
Looks like $ investors switch possible - Crypto rules??Hello fellow traders,
Just looking at the chart of total market cap and based on trend line weekly focus- this is it- a point at which crypto market might start to recover and go for 2 x what it has in total, heading for 5t?? Let me know in your comments what do you think? Also, many investors might start diversifying their portfolio since Fridays 'crash' hence I wouldn't be really surprised if next week brings some $ into crypto !
It's just my idea don't copy think and do your own stuff

MARKETS week ahead: April 6 – 12Last week in the news
A completely new dance is currently on the world stage, called the Tariff-economics. The US Administration shocked the world and financial markets with implementation of trade tariffs for almost all countries in the world. China was the first to respond, dragging down all financial markets globally. This was one of the worst trading weeks for US equities since the pandemic lockdown in 2020. Only on Friday, the S&P 500 lost almost 6%, and about 10% for the week. The price of gold dropped in a response to the margin calls from other markets, ending the week at the level of $3.037. In a fear of recession in the US, the 10Y US benchmark yields responded with a strong move toward the 3,87%, but ended the week at 3,99%. The price of BTC was relatively steady compared with other financial markets, but the question that is currently pending the answer was if this was actually good or maybe the bad news?
The US Administration decided to start trade-war with the rest of the world. This was an action which shocked both markets and almost all governments in the world. The global sell-off in equities was triggered in a fear of recession and the impact which trade tariffs might have on global growth during this year. The situation was much worse when China announced implementation of 34% tariffs on all goods imported from the US. Other governments worldwide are expected to announce countermeasures in the weeks to come. Investors worldwide are currently very unhappy with actions from the US side, calling it the “biggest policy mistake in 95 years”.
The US President Trump is not giving up from persuading Fed Chair Powell to cut interest rates. Last week President Trump said that the Fed Chair should “stop playing politics” and that now is the perfect time for an interest rate cut. Fed Chair Powell clearly noted at the last FOMC meeting that he will not publicly comment on any topic from the US Administration. When asked to comment on the impact of trade tariffs during the previous week, Powell shortly noted that they are “significantly larger than expected”. With respect to potential rate cuts during this year, the market is currently projecting four 25 bps cuts till the end of this year, regardless of the latest FOMC projections of only two rate cuts.
Banking professionals are also cutting their initial projections of the equity markets developments for this year. The RBC analysts are now projecting the S&P 500 level of 4.200 for this year in case of the stagflation macroeconomic scenario. In the case of full recession, their revised projections for the index currently stand between 4.500 and 4.200.
Crypto market cap
Traditional markets had a very turbulent week and the worst one since the pandemic lockdown in 2020, however, the crypto market was moderately left behind the market attention. Considering developments with other financial assets, it could be noted that the crypto market had a relatively solid week. There had been both weekly losers but also gainers. Total crypto market capitalization dropped by 1% on a weekly basis, losing a minor $19B in cap. Daily trading volumes remained relatively stable on a weekly level, without a significant change of previous $132B. Total crypto market increase from the beginning of this year, currently stands at -19%, with $611B outflow of funds.
Generally BTC had a relatively stable week, with a minor weekly gain of 0,2% and with an inflow of $4B. ETH was standing on an opposite side, with a weekly loss of 3,5% in the market cap, or $8B. BNB was traded with a modest negative sentiment, with a weekly loss in market cap of $ 2B, or 2,4%. Market favorite Solana dropped by 5,2%, erasing $3,3B from the market cap. EOS was one of rare coins with an extreme market gain of 40% on a weekly basis. XRP was also traded a bit higher, gaining 0,3% for the week. Tron and ZCash also ended the week in positive territory, around 1,5% higher from the week before. Other altcoins were traded in a mixed manner, with a losing side prevailing. The majority of altcoins lost somewhere between 2% and 9%.
One of the highest weekly increases of coins in circulation during the previous week had Solana and IOTA of 0,5% w/w. Algorand and Filecoin increased their circulating coins by 0,2%. Thai week, Tether had a drop in total number of coins on the market by 0,1%.
Crypto futures market
The crypto futures market had a relatively calm week, in line with developments on the spot market. BTC futures were traded higher from 0,1% to 0,4% for various maturities. BTC futures maturing in December this year closed the week by 0,4% higher, at the level of $88.850. Those maturing in December 2026 closed the trading day at $97.705, almost flat from the week before.
ETH futures were traded lowr above the 3% for all maturities. ETH futures maturing in December 2025 ended the week at $1.914, and those maturing a year later were last traded at $2.060.
Crypto Market at Critical Crossroads: Is History Repeating?Maybe an altcoin season seems too luxurious for us investors right now.
The TOTAL market cap is currently at a critical point, showing price action similar to past cycles.
Previously, we had COVID as our black swan event - could today's equivalent be a trade war?
We're probably approaching the final wave before the market truly enters a downtrend. It's crucial now to stay alert and prepare carefully.
Everything the US is currently doing—including tariffs—serves one goal: shrinking their huge federal debt load, absorbing wealth from other global economies, and keeping gold prices in check. This gives the FED more room to reduce interest rates and reignite growth.
Eventually, global markets always rebalance. Governments typically respond by printing more money to ease the pain, and historically, that's positive news for BINANCE:BTCUSD
Cheap money policies always return; it's just a matter of when.
Your job now is straightforward:
- Be patient
- Stay flexible
- Maintain solid cash reserves
Remain calm, stay sharp, and be ready for opportunities.
#BTC #FED #TotalMarketCap #CryptoTrading #TechnicalAnalysis #CryptoVeteran #TheCryptoFire
Massive storm hiting the crypto market soon!The Correlation Between SPX500 (Wall Street) & Crypto 📉📈
The relationship between SPX500 and crypto is not always stable. Sometimes they move in sync, like the Earth and Moon, and other times, they are completely decoupled. But rarely, we get an eclipse—a moment of total disconnection.
And guess what? That’s about to happen.
🔎 What’s Happening?
Looking at the charts, SPX500 had a massive rally last year, but while Wall Street boomed, crypto was bleeding. Most altcoins were slaughtered, and the TOTAL crypto market cap suffered.
But now, SPX500 is overbought, while crypto is oversold.
👉 This time, the decoupling will work in crypto’s favor!
💰 $2 Trillion in Sidelined Cash Ready to Flow In
Right now, about $2 trillion USD is sitting on the sidelines—money that institutional investors are hesitant to deploy due to market uncertainty. Many are keeping their funds in USD or foreign bonds instead of taking risks.
However, if you check my April/May forecast, we can see that:
✅ Crypto will be deeply oversold (confirmed by RSI & weekly MACD crossover).
✅ The US Dollar is weakening, forcing investors to move their money into other assets.
✅ SPX500 turning bearish = capital rotating into crypto.
🚀 The Perfect Storm for Crypto
📉 SPX500 bearish
💵 USD weakening
📈 Crypto bullish
This creates the perfect setup for rich investors to flood the crypto market with fresh liquidity.
💡 What does this mean for prices?
- CRYPTOCAP:BTC could double (100% gain).
- Altcoins could skyrocket (x10 to x100).
- This would finally trigger the altseason we’ve been waiting for—the parabolic move that happens once every four years.
📆 Timeline: April – June 2025
This move will be so explosive that it will eventually trigger a correction—possibly leading to a bear market. However, since crypto now moves in 6-month cycles, this correction should end by December 2025, setting up another leg up.
🏁 Final Thoughts
This kind of SPX500 & crypto decoupling is extremely rare, so positioning before the rotation starts is crucial.
⏳ Exact timing? Hard to say. But April/May looks like the moment when everything aligns.
🚨 DYOR as always—anything can happen to invalidate this idea.
I think we will see 1.7T in 2026.The most probable scenario in my head.
* What i share here is not an investment advice. Please do your own research before investing in any digital asset.
* Never take my personal opinions as investment advice, you may lose all your money.

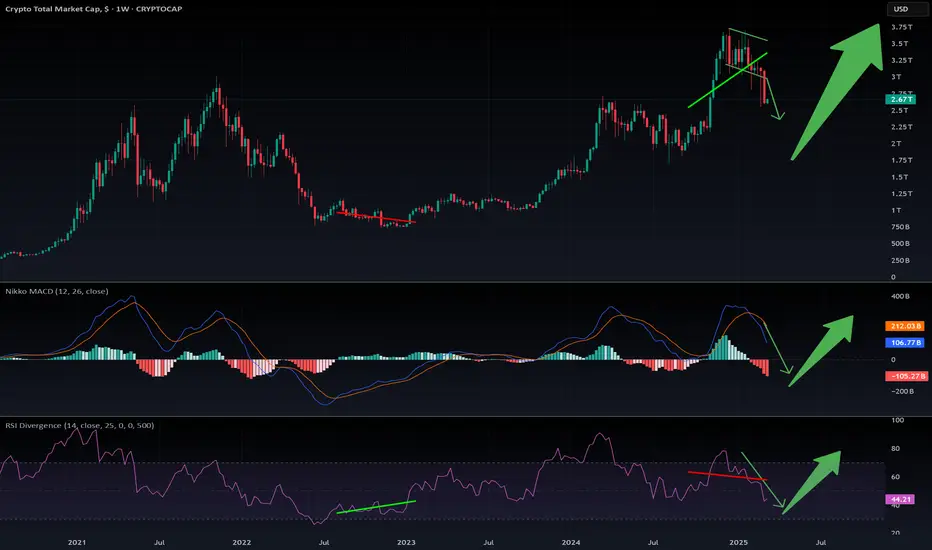
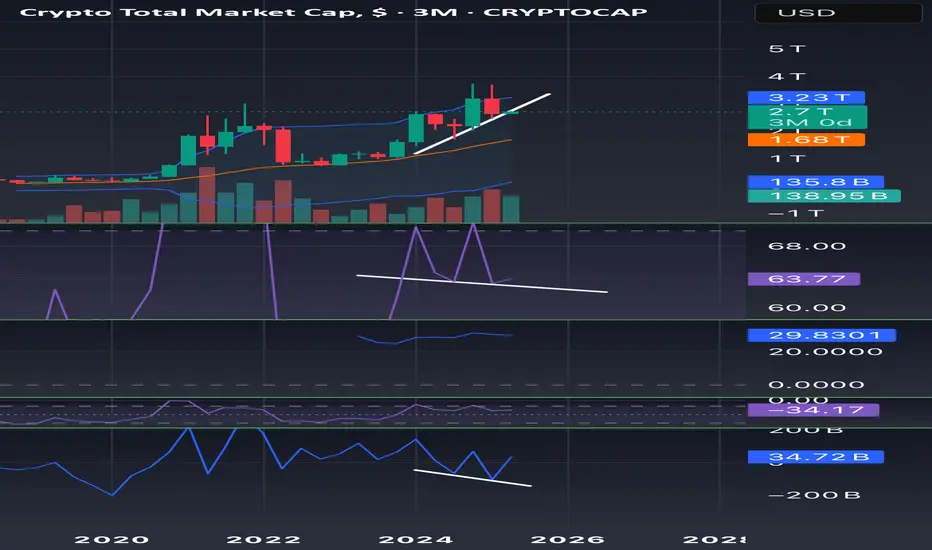
New ALL TIME HIGHS Bullish divergence on the 3M chart forming on RSI and OBV indicator. Very very high probability of seeing new highs. Dont be fooled by the news. Numbers are more important than words.
Stay blessed.
DYTRDR.
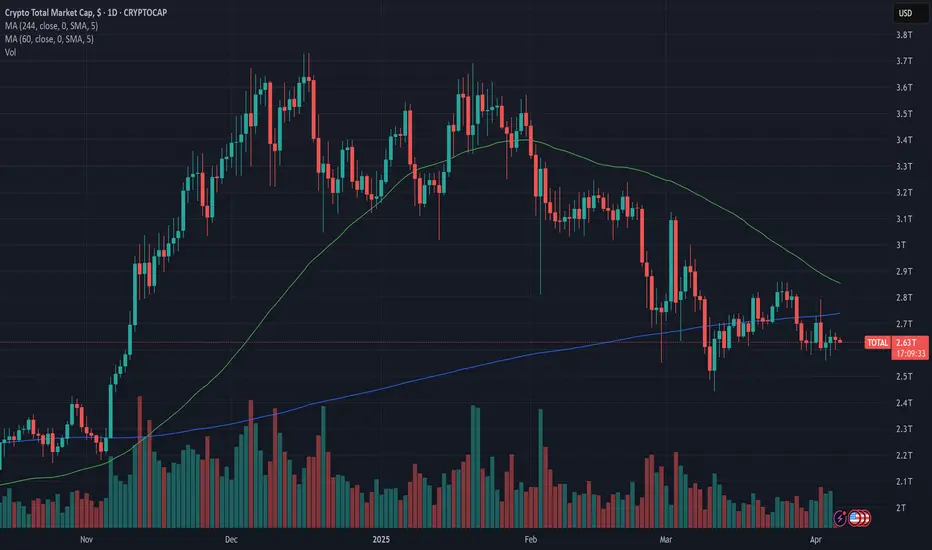
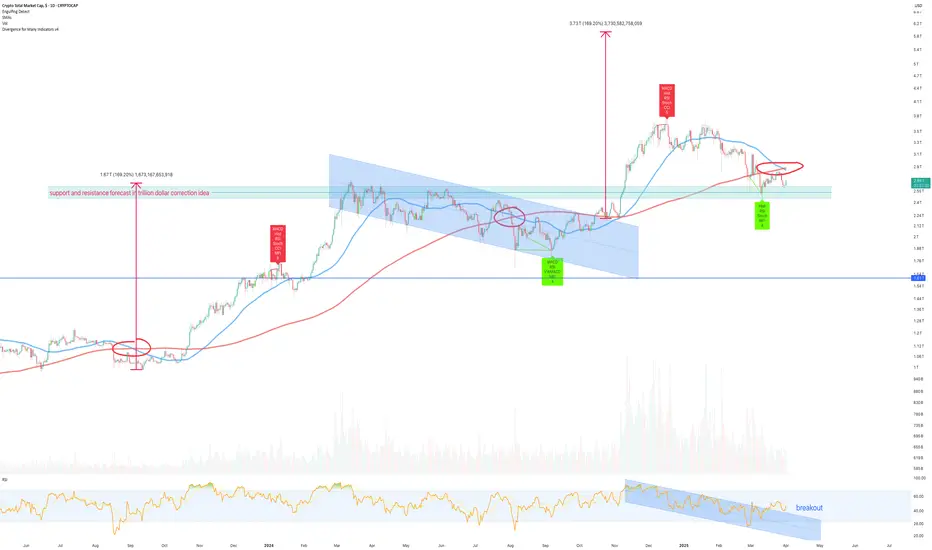
Incoming $3 trillion dollar market explosion for crypto...** Forecast to occur inside the next 5 months **
Is the market bottom in? More correction to come?
The next move in the market is going to fill many recent sellers with regret and for the few that don't use emotions..
According to social media, Youtube influencers etc.. the bear market is just beginning. In addition there is no shortage of messages with topics from tariffs to political instability informing me why the bull market is now over. Fair enough, understandable.
Investors and traders are capitulating at the worst possible moment. Sell it all before it goes to zero.
Well what if I told you market makers are about about to rug-pull all?
In December Without Worries published:
“Incoming $1trillion dollar correction for crypto people…” (see below.. )
The reason for publishing that idea are now mirrored by the reasons for publishing this idea.
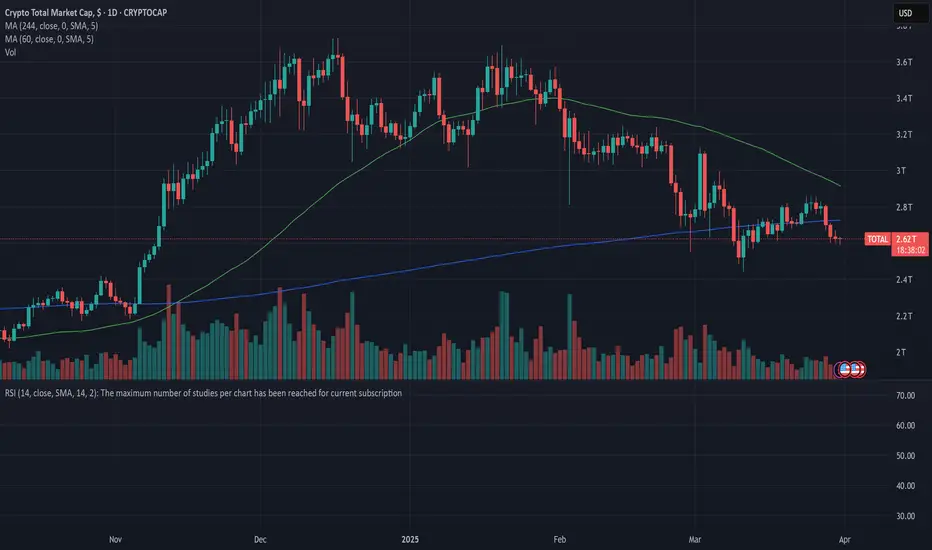
On the above daily chart price action has corrected $1.1 trillion dollars or 30% since the bearish divergence. A number of reasons now exist for a bullish outlook:
1) Price action and RSI resistance breakouts. Use linear chart to see price action breakout.
2) Support on past resistance.
3) Higher low follows regular bullish divergence.
4) ** Death cross ** !!! That is when the 50 day SMA crosses down the 200 day SMA with price action under the 200 day SMA. Every rookie trader knows moving averages don’t lie. Unfortunately almost all of them can’t look left. A death cross is very bullish for this market.
5) Why $3 trillion move to $6 trillion market capital? See the bull flag below. There’s more reasons on this forecast area and especially on the timing, which is discussed on my website.
Is it possible speculators keep selling? Sure.
Is it probable price action keeps correcting? No.
Ww
$6 trillion flag forecast
Incoming $1trillion dollar correction for crypto people…
Long idea on total market for cryptoIts on support zone and making bullish pattern. Possibly price can go up.

MARKETS week ahead: March 31 – April 6Last week in the news
Trade tariffs and inflation were the most watched words during the previous week, which shaped the market sentiment. Although US equities tried to express some shy positivity, the University of Michigan consumer Sentiment on inflation expectations put a shadow on a positive sentiment. The US equity market was traded sharply to downside on Friday, where the S&P 500 lost 1,97% in value, ending the week at the level of 5.580. On the opposite side was the price of gold, which reached the fresh, new all time highest level at $3.080. The 10Y US Treasury benchmark yields also reacted strongly to increased inflation expectations, dropping on Friday to the level of 4,25%. The crypto market followed the general negative sentiment, where BTC ended the week modestly above the $82K.
The US macro data published during the previous week, strongly impacted market sentiment. The PCE for February showed further modest increase in inflation, as the index reached 0,3% for the month and 2,5% on a yearly basis. Core PCE continues to be elevated, with an increase of 0,4% in February and +2,8% compared to the previous year. However, the highest surprise came from the University of Michigan Consumer Sentiment, final for March, where inflation expectations for this year were elevated to the level of 5,0%, a jump from previous 4,3%. At the same time, there has been an increase in inflation expectations for the next five years, which reached the level of 4,1% from previous 3,5%. The increased inflation expectations in line with news regarding trade tariffs put the negative sentiment among investors, where the US equity markets dropped sharply during Friday's trading session, as well as US Treasury yields.
Another tech company above the $ 1B valuation is free for trading on the NASDAQ from the previous week. The company in question is CoreWawe, under ticker CRWV. The company is a seller of artificial intelligence in the cloud, and is a supplier of OpenAI. CoreWave is better known as one of the companies with the highest initial public offering of $1,5B. The achieved price at the first trading day on Friday was $40 per share.
Analysts from Bank of America noted on Friday that, in their opinion, the equities in the US are still very expensive. The exact wording that was used is that the market “remains statistically expensive on almost every measure we track”. However, they acknowledged the recent correction, but remain cautious on the policy uncertainty.
As news is reporting, Grayscale, the US based investment fund, filed with SEC for the approval for their first spot Avalanche exchange traded fund to be listed on NASDAQ. Grayscale for some time is managing the Avalanche Trust, which carries 2,5% yearly fee. If approved, the ETF will provide for a wider range of investors exposure toward AVAX token.
Crypto market cap
CRYPTO MARKET
Markets were not happy with increased inflation expectations, while further rhetoric regarding new trade tariffs from the US Administration and other world governments are not providing any sort of confidence to investors. Market reacted in a negative manner during the previous week, dragging the crypto market toward the downside. Total crypto market capitalization was decreased by additional 3% or total $72B on a weekly basis. Daily trading volumes were modestly increased to the level of $132B on a daily basis, from $92B traded a week before. Total crypto market increase from the beginning of this year, currently stands at -18%, with $592B outflow of funds.
General negative market sentiment pulled the crypto market toward the downside, but not all altcoins ended the week in red. BTC had the highest decrease in market cap of $28B, decreased its value by 1,7% w/w. ETH lost $16B in value or 6,8%. Other major coins ended the week in a negative territory. XRP had a weekly drop in value of 10,7%, with a loss of FWB:15B in market cap. BNB was down by 3,1%, market favourite Solana decreased its value by 2,5%, while ADA dropped by 4,5%. Few coins finished the week with a positive weekly result. ZCash managed to add to its value almost 18%, Maker ended the week higher by 8,5%.
With respect to coins in circulation, some of the highest weekly gains were marked with stablecoin Tether, with an increase in the number of coins by 0,5%. Solana`s coins in circulation were higher by 0,3%, while Polkadot increased the number of coins on the market by 0,6% w/w.
Crypto futures market
The crypto futures market was also in a negative mood during the previous week. Although BTC lost around 1,7% in value on a weekly basis, its futures decreased much less, around 0,5% for all maturities. Still, for the last three weeks, BTC long term futures fell below the $100K level but are still holding above the $90K. Futures maturing in December this year closed the week at $88.500, which was a drop of around 1% w/w, while futures maturing in December 2026 were last traded at $97.570 or 0,44% lower w/w.
ETH futures had a higher drop on a weekly basis, of more than 5%. In this sense, futures maturing in December 2025 achieved the last price at $1.983, and those maturing in December 2026 ended the week at $2.133.
Chaos to Clarity: Mastering the Discipline Mindset5min read
Looking back on my journey as an investor, I can see how much my mindset shaped my path. When I first started, I was a mess—chasing every hot tip, jumping into trades without a plan, and letting my emotions call the shots. I’d feel a surge of excitement when price spiked, but the moment it dipped, I’d panic and sell, locking in losses. It was a chaotic rollercoaster, and I was losing more than I was gaining. I knew something had to change, but I wasn’t sure where to begin.
One day, I took a step back and really looked at myself. I realized the market wasn’t my biggest problem—I was. I was reacting to every little fluctuation, letting fear and greed drive my decisions. I started paying close attention to how I felt when I made trades. Was I anxious? Overconfident? I began noticing patterns. When I was stressed, I’d make impulsive moves that almost never worked out. But when I was calm and focused, my choices were better, and I’d often come out ahead. That was my first big revelation: my state of mind was the key to everything.
I decided to get serious about controlling my emotions. I started small, setting strict rules for myself. I’d only trade when I was in a good headspace—calm, clear, and ready to stick to my plan. If I felt off, I’d step away from the screen, no exceptions. It was tough at first. I’d catch myself itching to jump into a trade just because everyone else was talking about it. But I learned to pause, take a deep breath, and check in with myself. Over time, I got better at staying steady, even when the market was a whirlwind.
I also realized how much my beliefs were holding me back. I used to think I had to be in the market constantly to make money. If I wasn’t trading, I felt like I was missing out. But that mindset just led to burnout and bad calls. I started to change my thinking—I told myself it was okay to sit on the sidelines if the conditions weren’t right. I began to see that success wasn’t about being the busiest; it was about being the smartest. I focused on quality over quantity, and that shift made a huge difference. My wins started to outnumber my losses, and I felt more in control than I ever had.
One of the toughest lessons came when I stopped blaming external factors for my failures. If a trade went south, I’d point the finger at the market, the news, or even the system I was using. But deep down, I knew that wasn’t the whole truth. I had to take responsibility for my own actions. I started treating every loss as a chance to learn. What was I feeling when I made that trade? Was I following my rules, or did I let my emotions take over? By owning my mistakes, I began to grow. I became more disciplined, more aware of my own patterns, and better at sticking to what worked.
I’m not going to pretend I’m perfect now—I still make mistakes, plenty of them. At the beginning of this week, I came into trading loaded with personal problems from real life. I didn’t even pause to clear my head; I just dove straight into the charts and started opening long positions without much thought. By Friday, I realized what I’d done—I’d let my distracted, emotional state drive my decisions. So, I closed all my positions except one, cutting my losses quickly and stepping back to reassess. That’s what’s changed: I recognize those mistakes almost immediately now. I don’t hang on to them or let them spiral. I catch myself, fix the problem fast, and move on without beating myself up. That ability to pivot quickly has been a game-changer. I’m not stuck in the past anymore—I’m focused on getting better with every step.
Over time, I learned to tune out the noise and focus on what I could control. I stopped worrying about what other people were doing and started trusting my own process. I’d remind myself that investing isn’t just about the numbers—it’s about the person behind the trades. The more I worked on my mindset, the more consistent my results became. I learned to stay present, keep my emotions in check, and approach every decision with a clear head. That’s what turned me into the investor I am today—someone who’s not just chasing profits, but building a sustainable, successful approach to the markets, mistakes and all.