Overlay of 2018 Altcoin bearmarket and now (monthly - weekly)I overlayed the bear market accumulation pattern of 2018 - 2020 for the Altcoin market cap on the accumulation pattern we're in now (Jun - Nov 2022).
(The accumulation pattern of 2018 in monthly candles look even more similar to the weekly candles of the accumulation pattern of today.)
Moving very similarly, the RSI supports the idea of continued correlation. This would mean an end to the bear market and a new bull market ahead.
TOTAL2 trade ideas

altcoin marketcap 1 day total2altcoin marketcap 1 day total2
exclude btc
bitcoin
binance dollar tether usdt

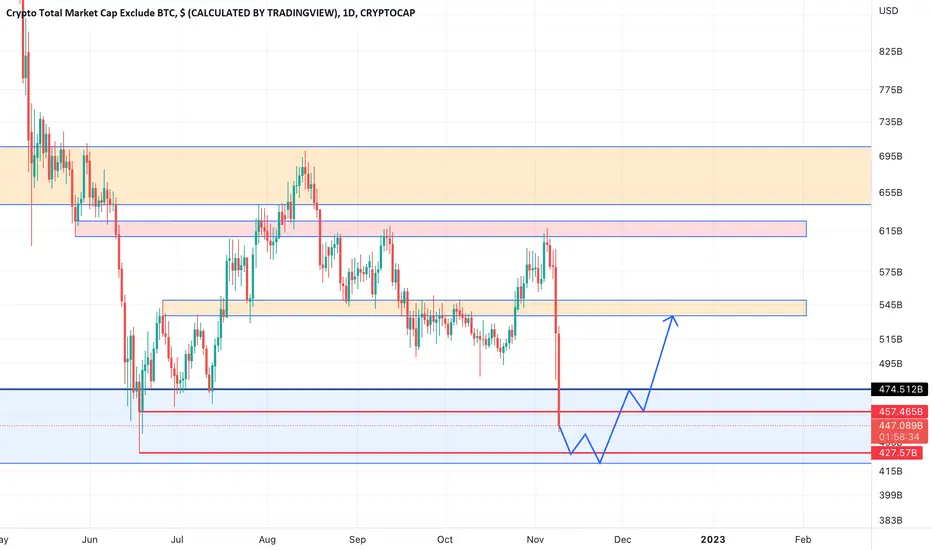
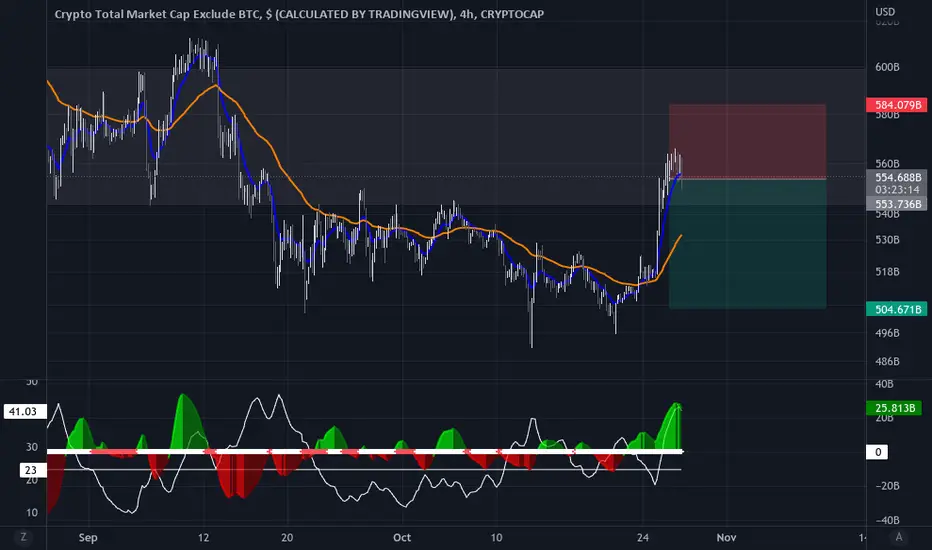
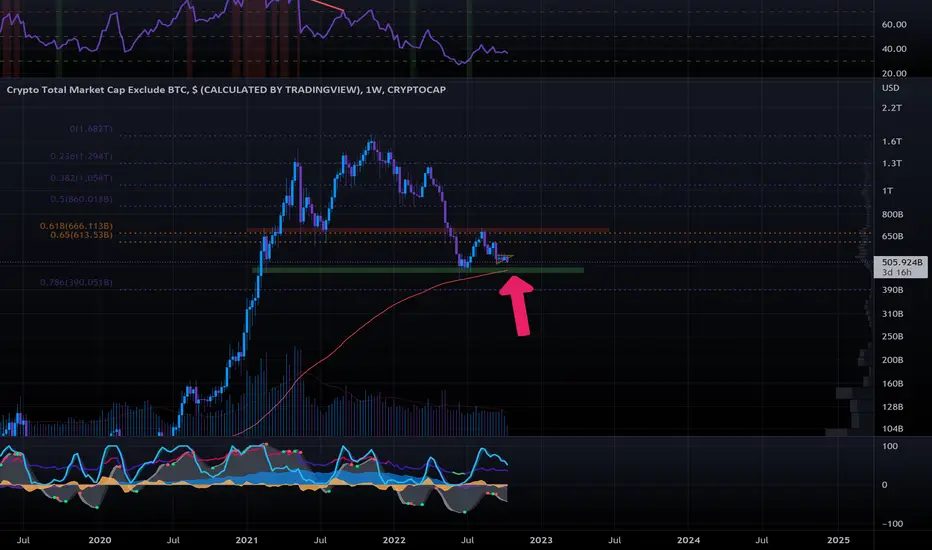
Very important levelI personally believe this level is going to hold and we’ll experience some squeeze from here in upcoming weeks if any other exchange bankruptcy news wouldn’t make more FUD.No one can predict the news but in my opinion this is the level we gonna bounce probably.not a financial advise.
Lets see how its gonna be…always a student.
PRESSURE IS BUILDING FOR BITCOINIf the green triangle doesnt hold and the first red line gets breached its lights out for BTC

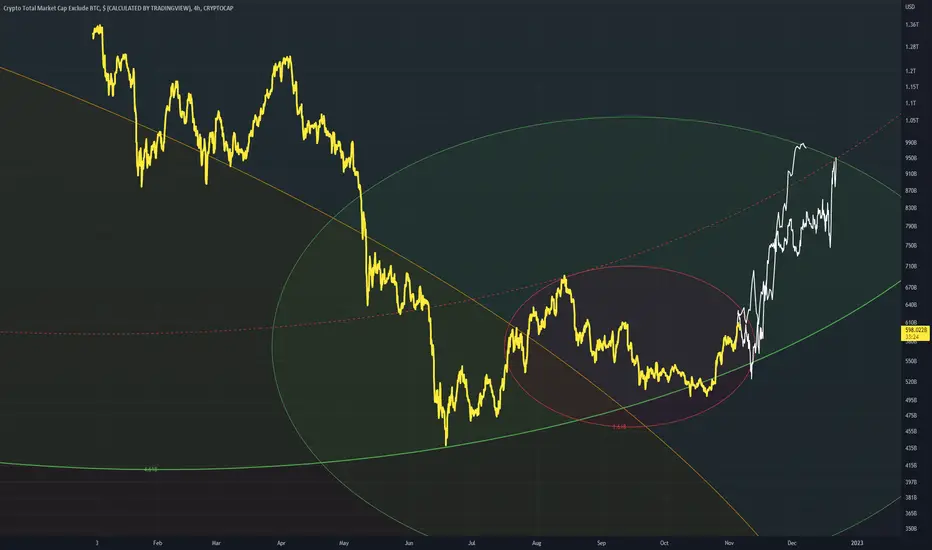
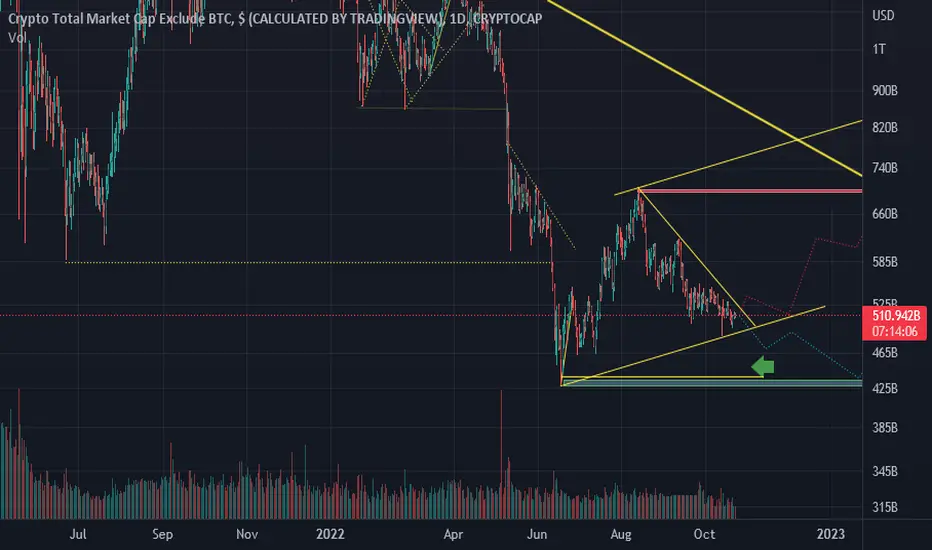
TOTAL2 - Developing the Bottom Structure Plotting a bottom along the 4.618 of a strong downtrend Fib Circle
As you can see the price is moving along this thicker green line
I expect the second bottom to occur and consequently a double bottom occurring
Following this double bottom a rise is in order
This is a complementary post to the one below
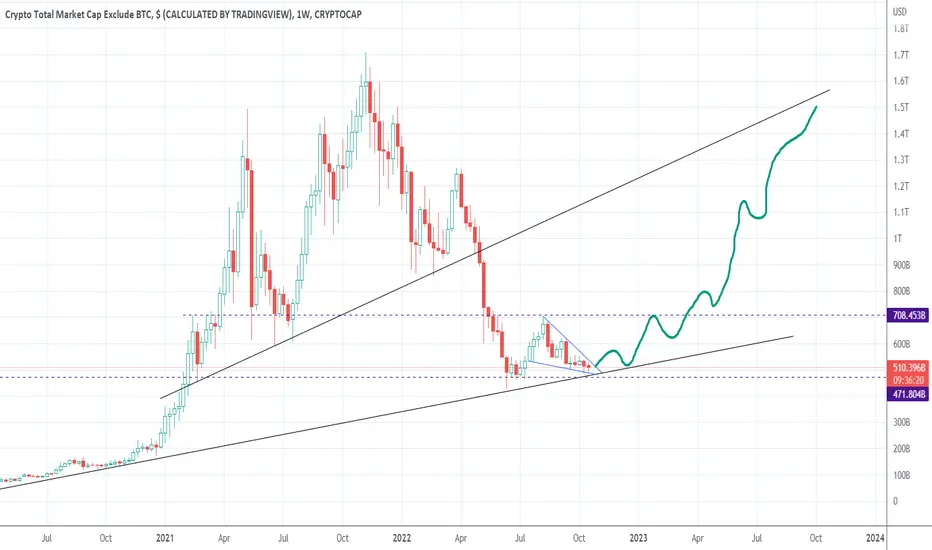
Alt market may be on the verge of something big.If this wedge plays out. Interestingly enough wether the yellow line or the white one is the top trendline the breakout target is exactly the same. We definitely seem on the cusp. *not financial advice*

Crypto Total Market Cap.I think this is a great tool to help nevigate ones Dovish and Hawkish periods in the crypto sphere, hence shouldn't be ignored. Well I don't think we will be hitting 1T very soon, but much later in the future we will sure surpass that level.
Considering inflation rampaging the world, investors are scared of investing and also confused as to what time would be best to get back into the market. On the current move BTC will hit 942B which is very likely.
Total2 ABC Pattern Goes On!As shown on the chart, The Total 2 Chart (Alt-Coins) has a Clean Break-out from 0-B Downward Trendline and after that Breaks the Local High and confirm it with a Clean Pull-Back!
Now The ABC Scenario is the most Likely Scenario to Play Out. at This Moment there is not a great chance for long positions but you can wait for a correction as Leg-B on shown Fibonacci Levels and Fill Your Bags with Crypto to Roll the C - Leg upward movement which will be massive and great Play.
Don't Get into FOMO in these days because it will cause you a loss in your budget but stay in touch and watch the trend for a great buy chance in near futures.

TOTAL2 It is completing the 5 wave of 1orA . The specified Fibo range is reasonable for a buy position.

ALT M.CAP IS FORMING A BULL FLAG!!Hello everyone, if you like the idea, do not forget to support it with a like and follow.
Welcome to this TOTAL2 aka Altcoin M.cap update.
Total2 is forming a bullish flag like structure in 4hr time frame. Currently, it is trying to break the flag here. If it succesfully breaks the flag then we might see some more 15-20% bullish rally in Altcoins. In case of a rejection, we have an important support at around $550B which must held.
Keep an eye on this.
If you like this idea then do support it with like and follow.
Also, share your views in the comment section.
Thank You!

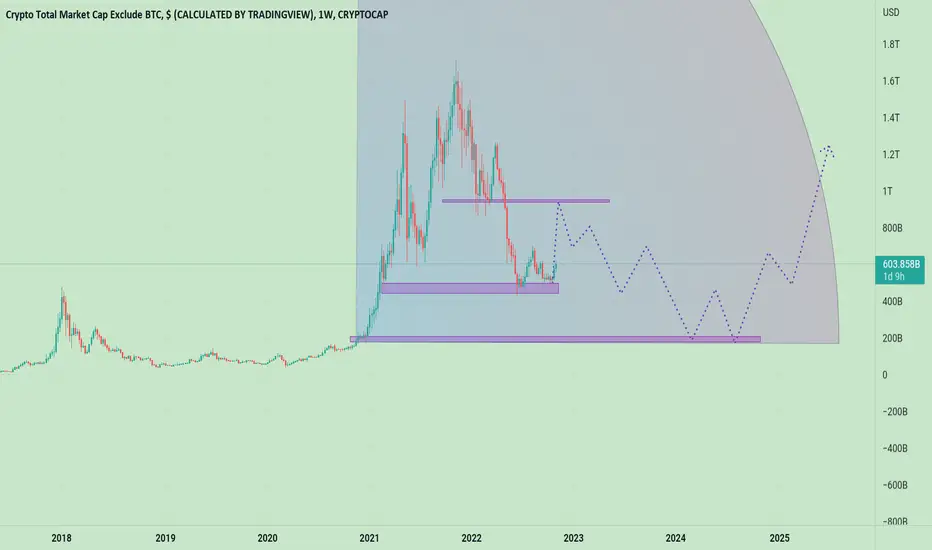
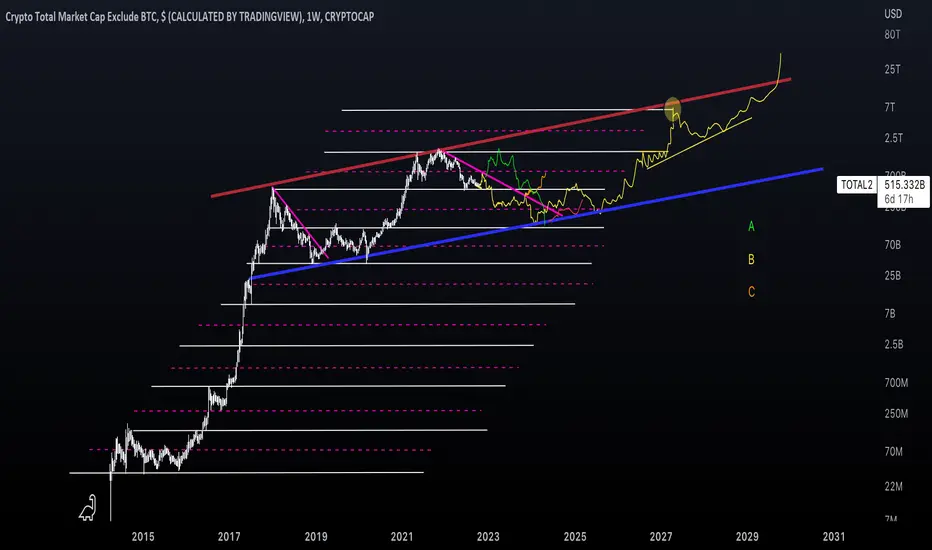
[UPDATE TOTAL2] 3 scenarios: A? B? C? It depends on CPI!I'm comfortable with all the 3 scenarios:)
A) Super rally, lower inflation, and then a new inflationary bear cycle
B) Rally, stage 3 and stage 4 of a bear market. New all-time highs in 2026 and 2027.
C) Rally, we go down less than the previous bear markets. More consolidation.
#TOTAL 2it means coming more money to market
as we can see the trend is broke
and we have a triangle bullish pattern.

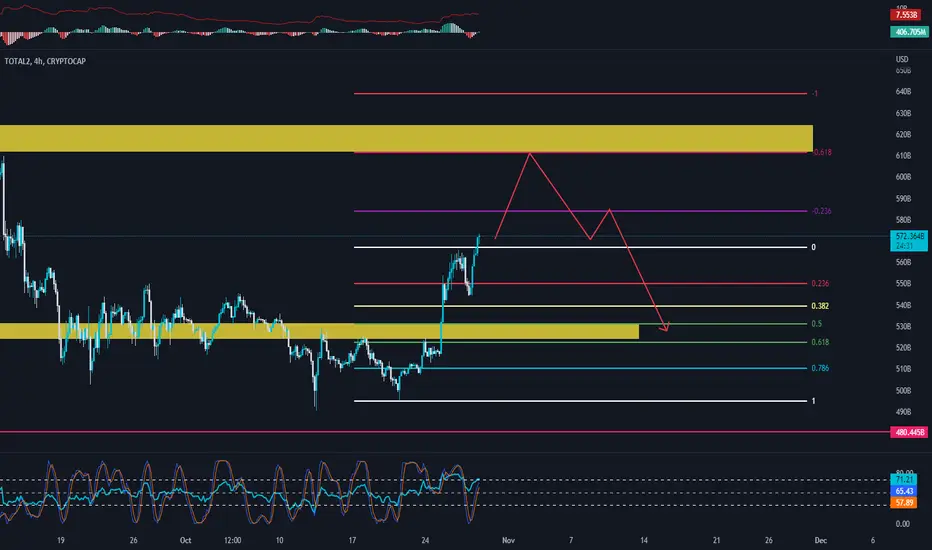
Total 2 be careful with the volatility that could come This zone is specially delicated for how long was the time that the price was lateralizing there , and many indicators are showing bearish divergence so at the end is obviously a strong movement would come in the next days but today and tomorrow the price has higher probabilities to be between the 590/560B .

ALT's updateI believe ALT's have more room to grow. But overall after that this might fall very hard. Be prepare for that. Trade safe. Better if you observe like me.
Not a financial advice
Total 2 the Crypto Market is doing very bad The Total 2 is in a resistance and we can notice the price doesn't have the enof volume and interest for continue going up
Ascending wedge: The big Altcoin flush out is coming in 2024This feels very plausible, if this happens it's probably the entire space getting regulated similar to what happened to the internet after the dotcom bubble finally reached a melt up point. Prepare for the madness. If this happens bitcoin will not become the new gold standard but instead CBDCs will enslave the world. SDR took over back on August 15, 1971, when President Richard Nixon announced that the United States would no longer convert dollars to gold at a fixed value, thus completely abandoning the gold standard.
Blockchain projects like Ripple Labs and Algorand would become a part of ISO20022 to digitize existing ISO 4217 (XDR) Special Drawing Rights.
"The XDR comes to prominence when the U.S. dollar is weak or otherwise unsuitable to be a foreign exchange reserve asset. This usually manifests itself as an allocation of XDRs to IMF member countries. Distrust of the U.S. dollar is not the only stated reason allocations have been made, however. One of its first roles was to alleviate an expected shortfall of U.S. dollars c. 1970"
Under this scenario: Dogecoin (equivalent to Pets dotcom back in the days), Ethereum (equivalent to Netscape back in the days). Would literally die after 2024.
It's a complete Altcoin flushout and altcoin apocalypse for many.
The new digital Gold, or Bitcoin, would also tank until equivalent to 2003 and would eventually hit new all time high which could be anywhere between 90k to 130k (keep in mind that Gold has only hit 66k per kilogram, so maybe peak is already in for Bitcoin unless Gold hits a new all time historic high). Overtime, Bitcoin and Gold could move together. To think Bitcoin will hit a million dollars under this narrative is not and wouldn't be realistic at all, unless there is hyperinflation in the US amidst a total dollar collapse, something that isn't plausible either, it can maybe hit a 60% low in a few years as other countries in G7 are integrated as global reserves next to the dollar.
This is my honest opinion. The most unpredictable scenario is perhaps the most likely one, and I think this is it. Very concerned about the future of decentralization and what crypto meant. Satoshi would be very disappointed.

The bullish scenario of the market, of course, with the right puHello. In this uncertainty of the market, where nothing can be understood about its rise or fall, with total2 and usdt.d, several scenarios can be monitored.
total2 can be one of the two paths in the image that I drew in red and blue. Of course, I said that at the moment it is really impossible to comment with complete certainty, but with two or three scenarios, the final path can be followed.
I will present my new analysis to my friends soon. Goodbye
Altmarketcap usd 1 weekAltmarketcap usd 1 week
dollar mollar
hadi
to the moon
hedef 2024
dayısı ajan
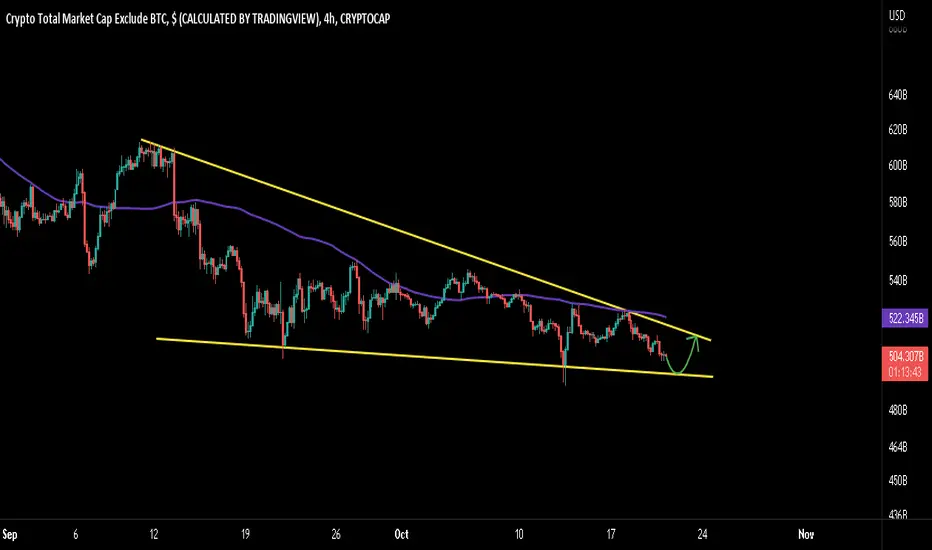
ALT M.CAP UPDATE! WHEN TO GO LONG IN ALTS??Hello everyone, if you like the idea, do not forget to support it with a like and follow.
Welcome to this TOTAL2 aka Altcoin market cap update.
TOTAL2 is forming a falling wedge like structure in 4hr time frame and currently looks like it is going for a 3rd tap of lower trendline of the wedge. Once it is reached near the lower trendline ($495-$500B) we can open some long positions with a tight stop loss. Longing here is more risky and less rewardable.
Hope this chart helps you to take better trade decisions.
If you like this idea then do support it with like and follow.
Also, share your views in the comment section.
Thank You!
TOTAL2 - Whipsaw possible, but I doubt it.It's possible that TOTAL2 touches the weekly 400MA, however indicators are oversold and likely a deviation for liquidity is a higher probability.

TOTAL2 UPDATE! ALTCOINS IS IN DANGER!!Hello everyone, if you like the idea, do not forget to support it with a like and follow.
Welcome to this TOTAL2 aka Altcoin market cap update.
Total2 is not looking good here. It breaks down from the bear flag-like structure and the recent pump in Altcoins was just a retest. After this retest, we might see more drop in Alts.
If you are holding any Alts then keep your stop loss tight.
If you like this idea then do support it with like and follow.
Also, share your views in the comment section.
Thank You!

alt coin rally coming?alts are currently dumping, we can see the 200 wma lines up with some support for alt coin market cap, given the the next few months are historically bullish and we are still before midterms i don't expect this to break yet. could see a double bottom or bullish divergence over next few weeks/ months. but if money starts flowing into just bitcoin as it should this could break fairly quick.
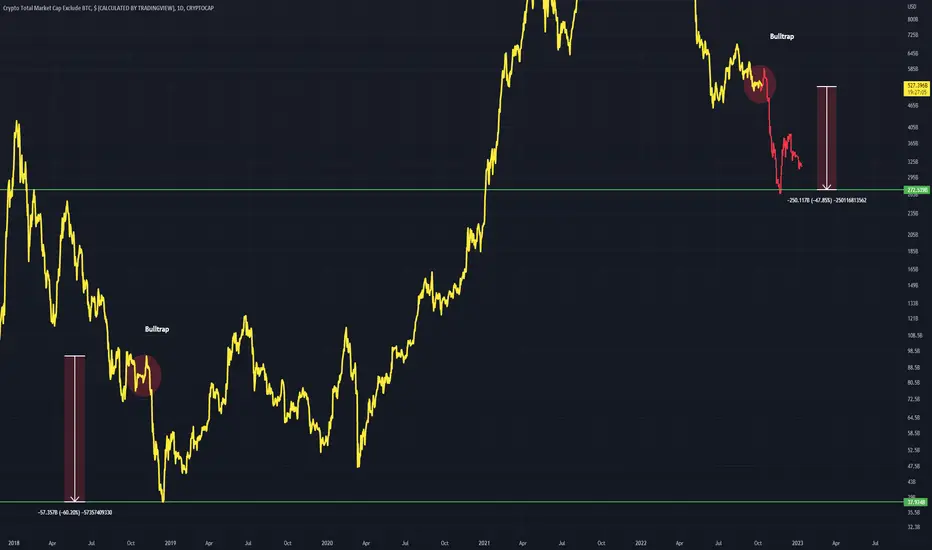
TOTAL2 Alternate Bull Trap ScenarioPrice right now is pretty stagnant this could be indication of a bottom or a bull trap similar to one seen in prior bear market
This is a max pain scenario
Linking my other analysis which suggests this price action is the bottom. Its gotta be one of them right?