ALT COIN MACRO REPEAT - update OCT 2022An update on the ALT macro repeat idea i posted before.
I wanted a map for the continued downside option here.
TOTAL2 trade ideas
TOTAL2 - Mid Term Recovery I expect the crypto market (particularly) the altcoin market here (TOTAL2) to undergo a partial recovery from this extreme bear market we have all experienced.
A market cap rise from where we are now to the middle line of the up channel drawn (dotted white line)
This bullish expectation should be reached by early 2023.
A W formation can be seen on chart with bars pattern.

Altcoins' last bull rally before a tumble?In this graph we have the dominance of altcoins disregarding stable coins.
The calculation is done as follows:
TOTAL = Crypto Total Market Cap
TOTAL2 = Crypto Total Market Cap excludes BTC
USDT = Market Cap of stable coin USDT
USDC = Market Cap of stable coin USDC
DAI = Market Cap of stable coin DAI
So:
Altcoins Dominance % = (CRYPTOCAP:TOTAL2-CRYPTOCAP:USDT-CRYPTOCAP:USDC-CRYPTOCAP:DAI)/CRYPTOCAP:TOTAL*100
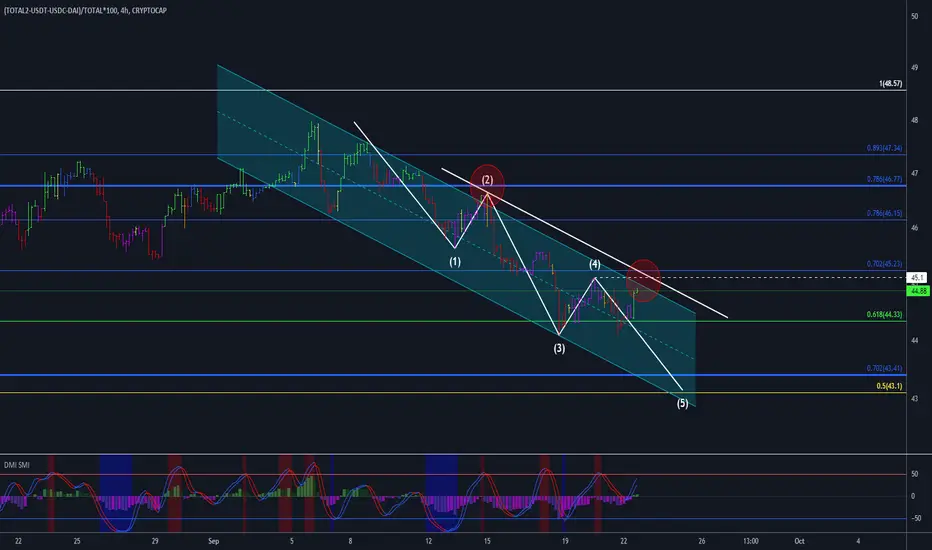
Looking at the chart the index is in a bearish channel.
It will apparently test the top of the channel at wave 4 resistance.
If this channel breaks, we will have an extremely bullish scenario, surpassing all expectations, due to the horrible macro scenario.
Otherwise the downtrend continues, heading towards the end of wave 5.
TOTAL2 Falling Wedge and Triple BottomThis is the 4Hr timeframe chart for TOTAL2
It shows a nice falling wedge forming right along the dominant downtrend line in red
This is all above a strong triple bottom which is a great candidate for a reversal point in the market
I expect a strong breakout out of this falling wedge

Cryptocurrency marketcap excluding Bitcoin (TOTAL2)If we exclude Bitcoin from the total cryptocurrency market cap we get the TOTAL2 parameter. The capitulation can easily be seen in this graph and I can tell you that it is even worse than the Total market cap because the market dumped even further on June 13th week. (482.5 Billion USD) Yesterday's dump brought us close to this low point and we are now at the 518 Billion USD level.
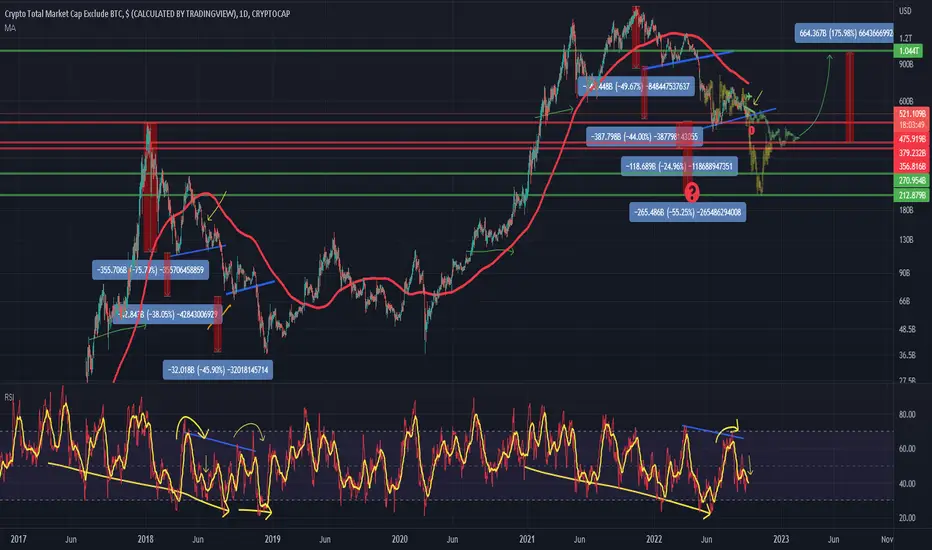
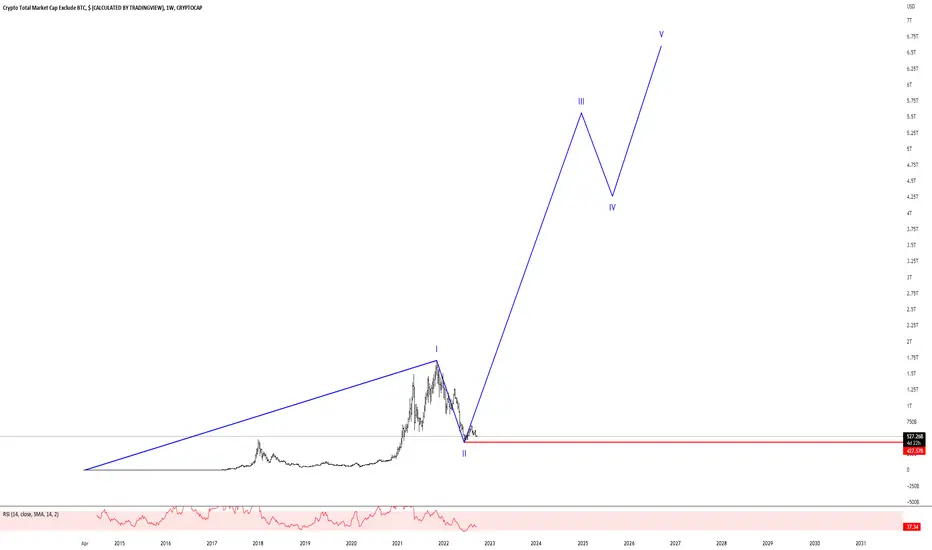
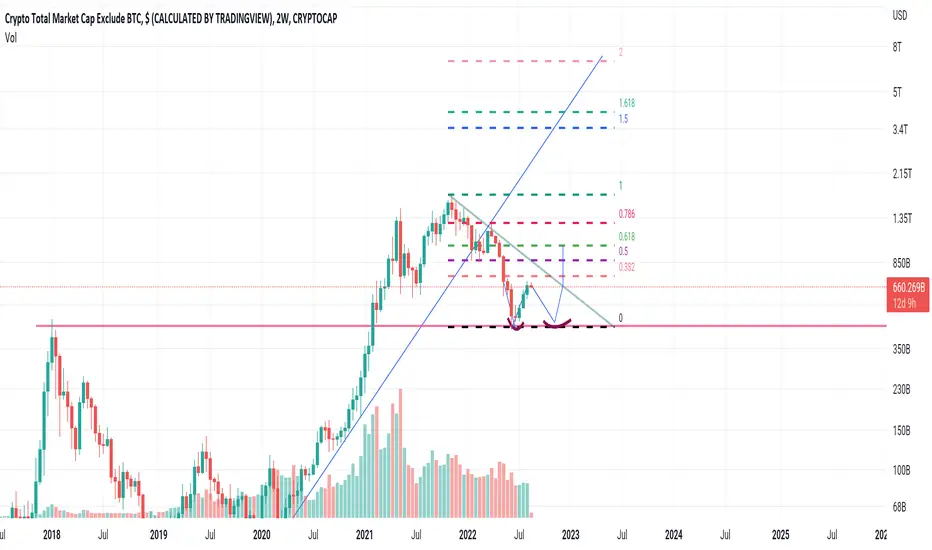
Best Yet To Come...It's looking like we could be at the start of a multi year Bull run and accumulating alts here is likely to pay off long term - The wave count is a visual representation of what I think is going to happen (based off fibs) - Most people now are very bearish and sitting in cash scared to buy - so the bottom is probably in.
Alts Market Current StatusThis is just an idea. Nothing special or advise. This is what i think about Alts market right now, i think it should be better to wait for next moves before entering or exiting the alts market atm.

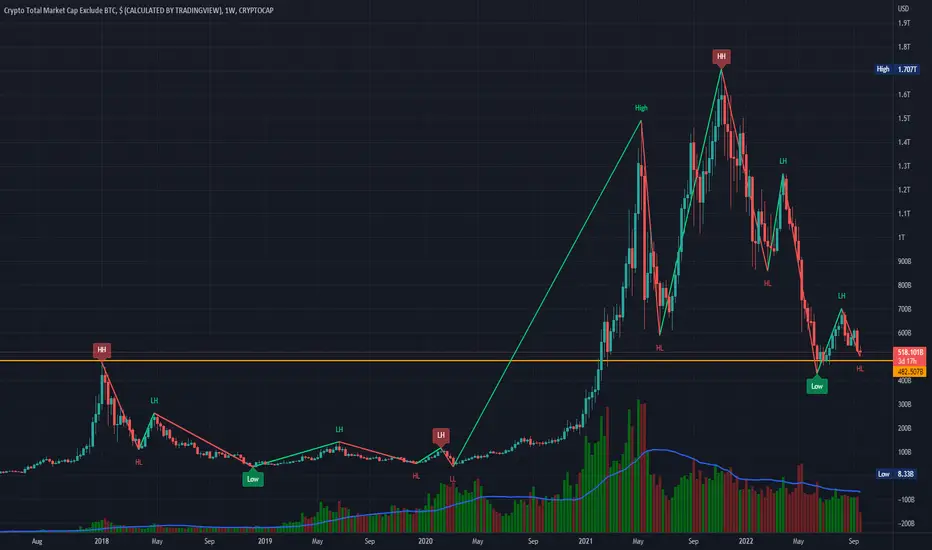
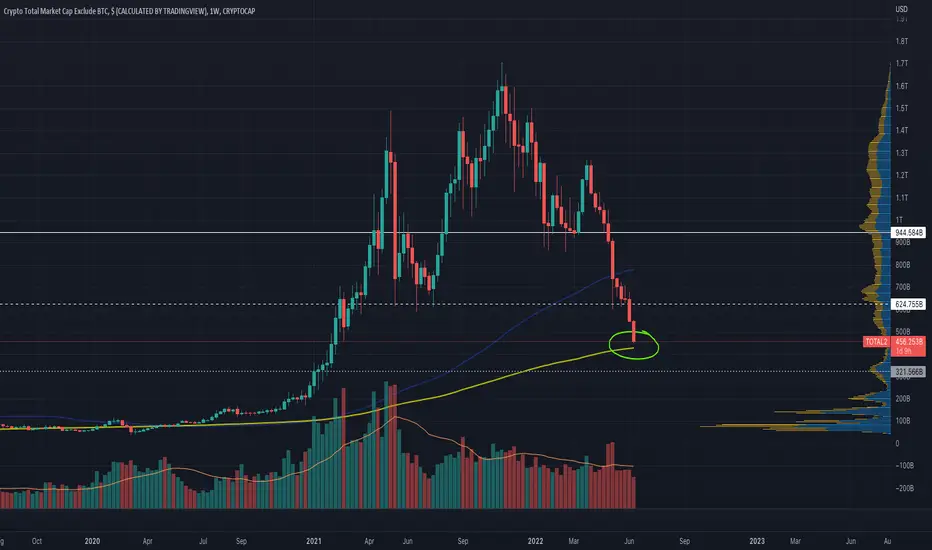
KEY LEVEL TO WATCH: TOTAL2 MacroI previously estimated where altcoins might find support, and I was right... for a few weeks.... but we didn't get a serious relief rally before losing that level.
Contagion has spread and 2 more giga-firms Celsius and 3AC may be insolvent / forced sellers....
And now we are a 7% drop away from a potentially very significant level...
It's the 200SMA on the 1W timeframe (yellow line). We haven't come anywhere near it since pre-bull run. Before that, it never exactly offered rock-solid support, but it did act as a magnet for price action during the previous bear cycle.
When it was broken previously, the Total market cap of altcoins went down another 45% before being drawn back up to it and didn't stray too far in either direction until blasting off this previous bull cycle.
I'm posting these quickly so I'm sorry if some of my numbers are off, but you get the idea. It's a point of interest. If we lose it, expect more downside, but THAT will be when it's time to really pay attention and watch for a potential bottom / rally back for a bearish retest of it.
THINK HAPPY TRADES
THINK HAPPY TRADES
CD
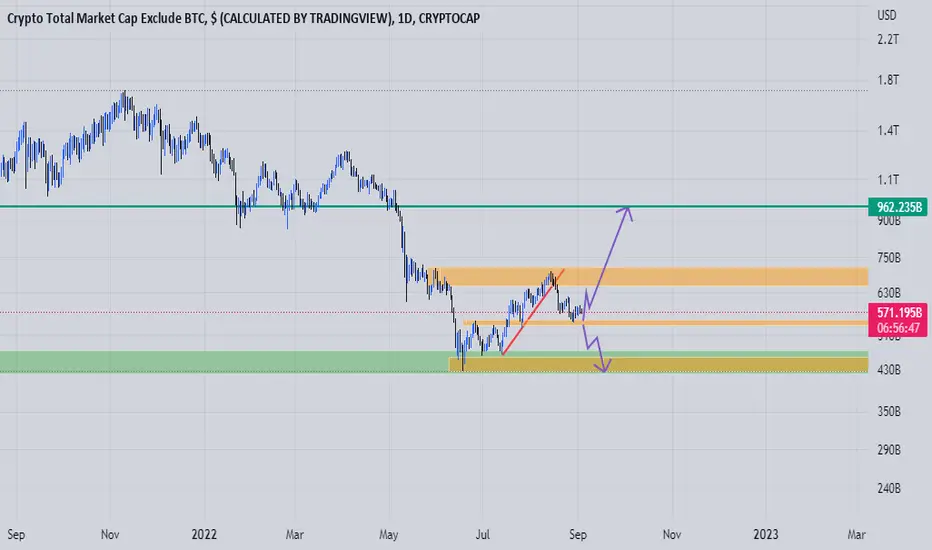
Expect 12-20% lower from here on TOTAL2 before potential supportUpdated my TOTAL2 macro chart - I called the timing/level of the market rally in my first version based on TA.
Reviving this chart because once again, blood is in the water. I'm not predicting it will catch support and rally again at the exact same level;
I'm merely reminding you that this is the next significant level of POTENTIAL support, and there's still a 12-20% drop before we get there.
Careful out there, and keep stops in place. With FOMC in a few days, clearly this will be a volatile week.
Happy Trades,
CD


Ichimoku Analysis for TOTAL278.6% is a good local support. Losing it will be BAD for #ALTS . Keep an eye on Tenkan/Kijun crossover for further direction on this.

Total2 Altcoin Market Cap 8HIt is moving on a Bearish Rectangle and I'm expecting for a breakout to the downside soon. You can see support and resistance zones on the chart.

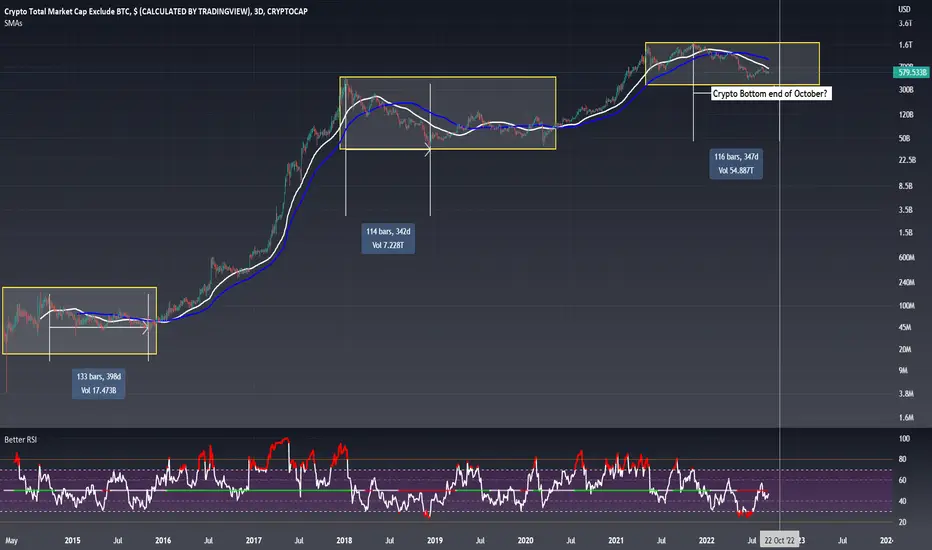
Highly possible scenario Crypto bearish cycle end in 28/10/2022It is highly possible that we end the bearish cycle and market final bottom end of October 2022
Ichimoku Analysis for TOTAL2With the bearish kumo crossover, now we just wait for it to come below the cloud for actual SALE to begin.

Total 2's ambiguous status is on the razor's edgeTotal 2's ambiguous status is on the razor's edge
Buyers and sellers are in a coma
If the resistance fails, the sellers will act aggressively and the named buyers will be desperate to leave
TOTAL 2 MarketCapThe main comment about crypto's marketcap is already published under the TOTAL analysis, but here we can see that VolumeTrend is reversing up and Momenter has signaled a reversal in Momentum.
Bullish for now.

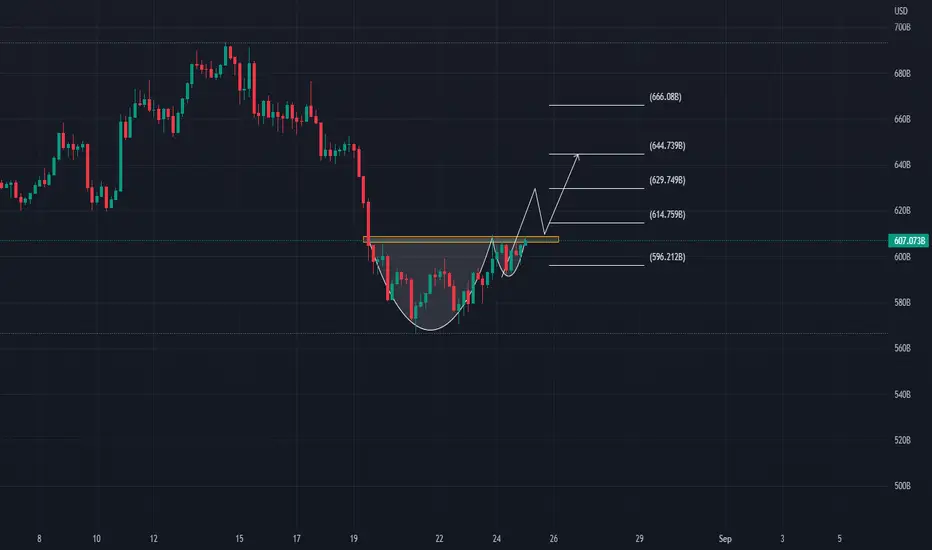
TOTAL2 (Alts Marketcap) MUST EYE ON THIS!Are you familiar with TOTAL2 it is known as total market capitalization of the whole altcoins in the market.
As of the moment, we've spotted a cup and handle pattern on 4 hours time frame. The price action is having little pressure on this resistance area.
But I'm pretty sure if TOTAL2 breaks the current resistant, many of alt coins will fly eventually.
Trade responsibly guys!
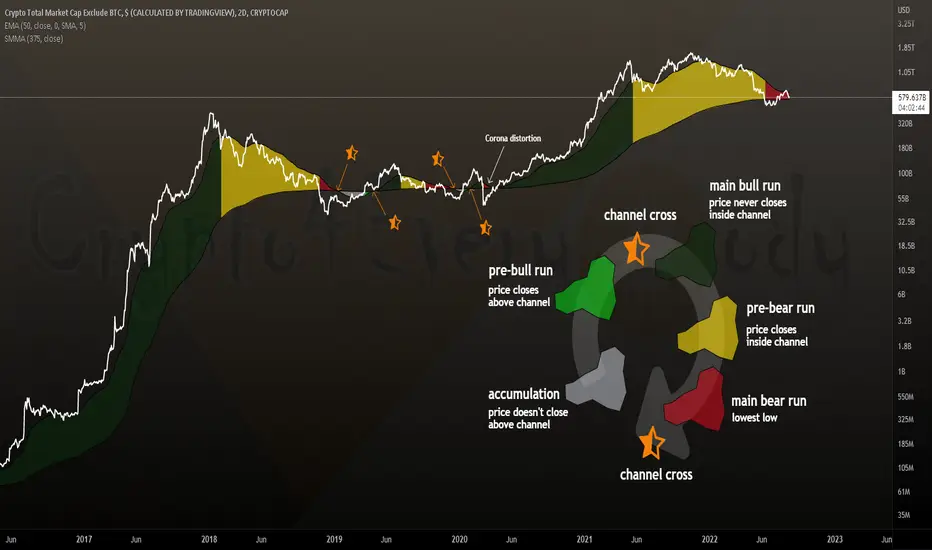
Altcoins channel cross is still aheadUnlike Bitcoin the Altcoins channel cross is still ahead
A channel cross can signal the "bottom is in" since we saw lowest low in the red main bear run
A cross in 2022 is very likely IMO
What are your thoughts on that map dear Crypto Nation? 😎
*not financial advice
do your own research before investing
TOTAL2 Bottom FoundTOTAL2 Has formed a strong double bottom along the 4.618 fib line of a bear trend
This correlates well with a larger bear fib trend (green trendline)
I have plotted price action in bars pattern which shows a reversal out of this bear market
This is the altcoin market cap

[Watch it] Alts market may find a bounceFalling wedge, TD count 9.
Price moving through a descending channel.
Needs breakout of the falling wedge.
First target ideally 700b.
Idea invalidated on breakdown of descending channel.
Watch it.

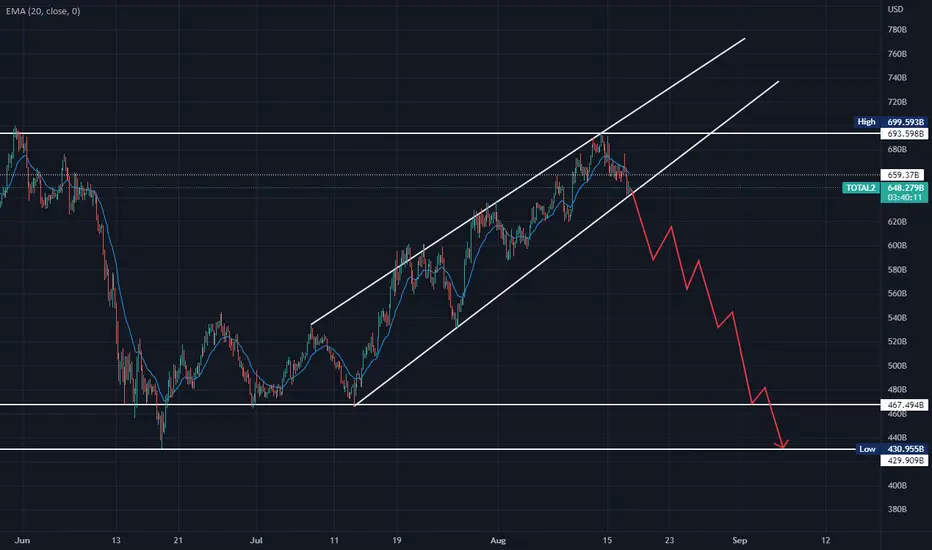
One more leg down - swoop and then initiate Bull Possible top reached across markets - We get another
leg down, then we enter the mania phase which leads into
the Next Bull market. The chart has
confluence with others that
I will post
SOON.
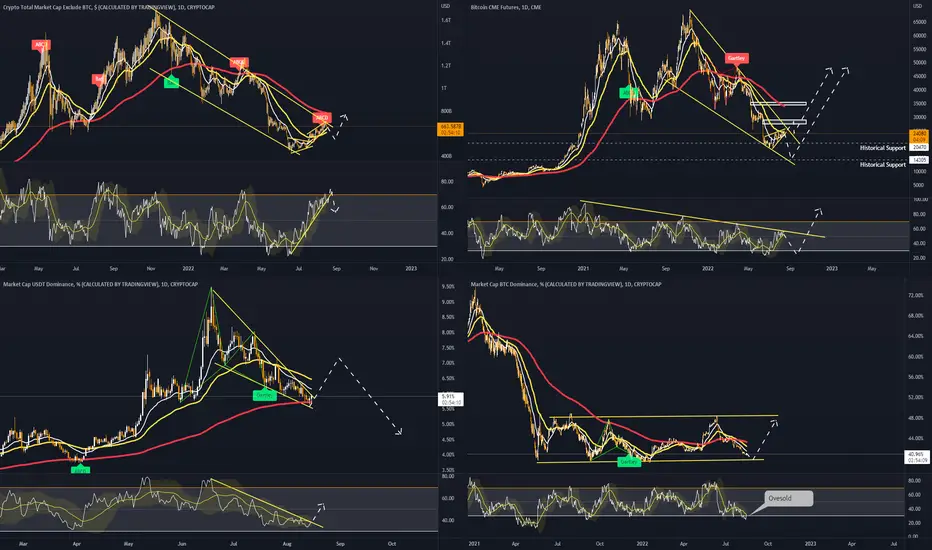
🤖 #BTCLIVE - 15.08 - #IDEA 🤖 - Part 3🤖 #BTCLIVE - 15.08 - #IDEA 🤖 - Part 3
Hmmmmm....things are looking pretty bearish
Alt Market Cap
Currently in a bearish rising wedge, RSI is over stretched now and almost overbought and any further rise 75 and above will confirm a bearish divergence. Expecting a crash from here for Alts - money will flow out of alts and into primarily USDT and BETH* I feel the low caps are really going to feel the pain here. Additionally we are hitting the long term top of the descending channel as well as about to get smacked by the 200DEMA.
USDT Dominance
No surprise USDT Dominance is looking primed to breakout, there is a small chance capital can flow primarily into BTC although highly unlikely. Expecting USDT Dominance to pump. Currently in a long long term falling wedge - as money has been slowly buying positions in alts and BETH. We are additionally finding perfect support on the 200DEMA to bounce.
BTC Dominance
This is holding range well and at the lower end, expecting a large bounce here potentially to about 48% - given the other scenarios this makes perfect sense as capital will likely flow out of all crypto to USDT but out of BTC at a slower rate boosting the dominance quite fast.
BTC Price
Long term bullish but short term looking pretty bearish with the rising wedge, long term trendline resistance, 50DEMA resistance and the other scenarios painting a pretty bearish case.
*My new short-hand for BTC & ETH, don't sue me