TOTAL2 - Buh-Bye 🚀BTC is currently a very confusing chart - and with good reason. It is throwing many off the scent right here 😄.
On this chart you will see BTC overlaid and it hasn't really made progress north.
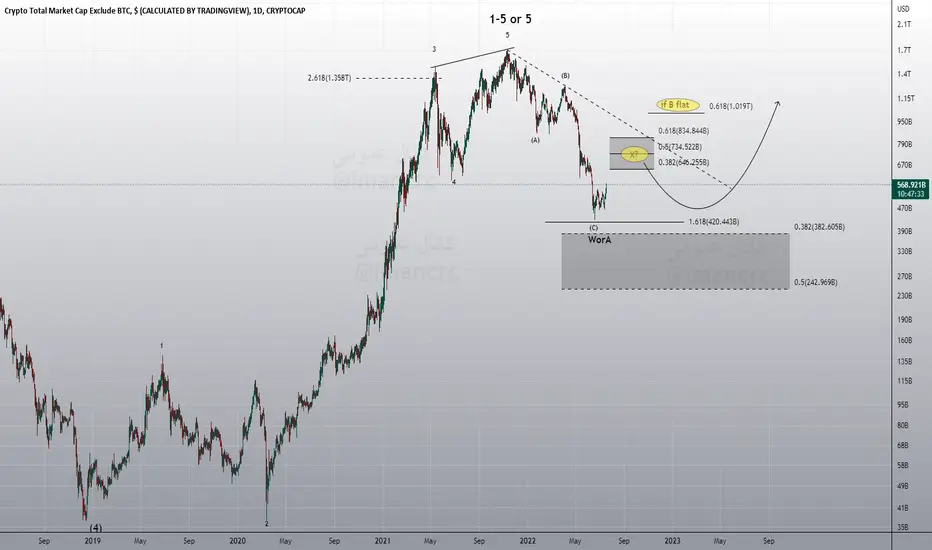
But the little devil in the detail I think is that 5 clear waves have printed now.
And although BTC / TOTAL2 are very exotic, if the dominant trend was to the downside then 3 clear waves should be a contination pattern to the downside but thats not what has happened. There has been no bite from the downward trend in wave 4 and price has held.
Instead we are now in a 5th wave and alarm bells should be ringing for bears but everyone appears to be sleeping and counts are being adjusted.
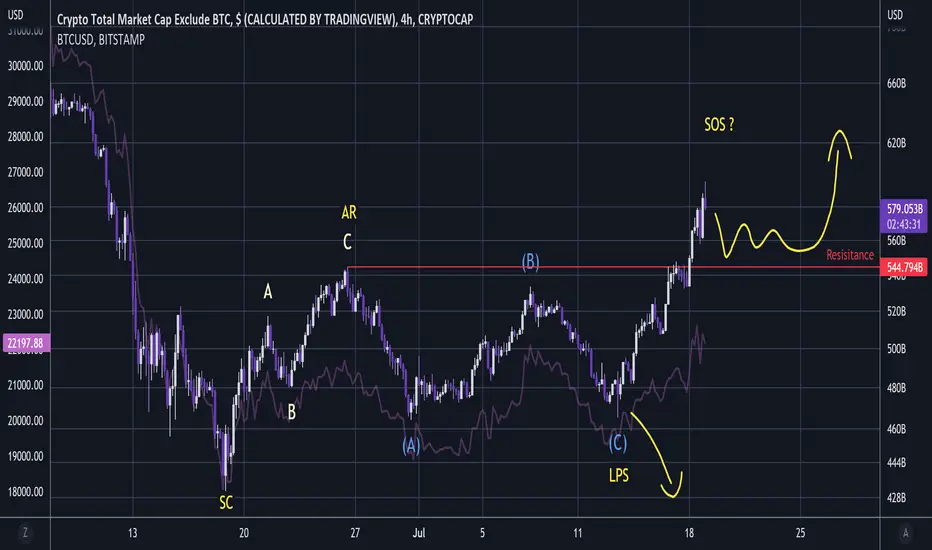
But what is happening I think is clearly revealed in TOTAL2 chart.
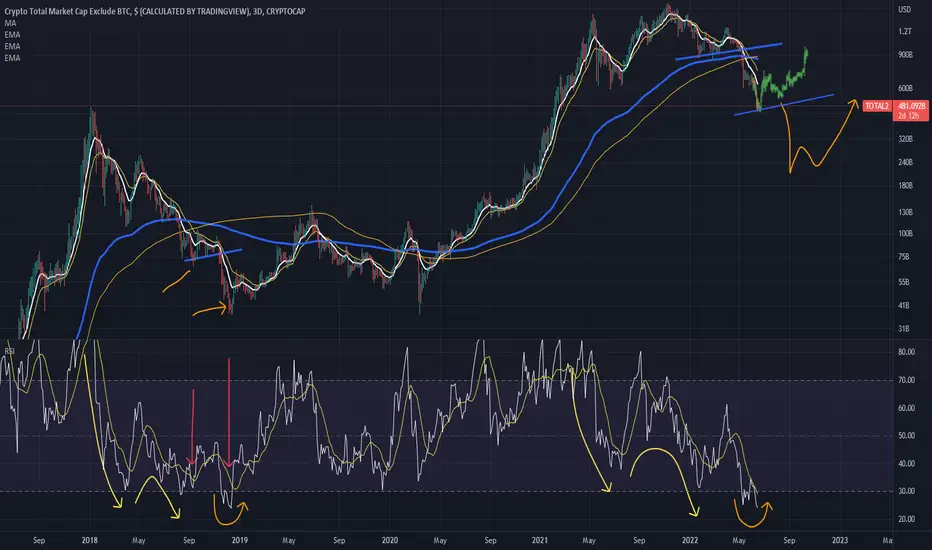
And that is the first wave up is a Wyckoff accumulation AR Automatic Rally minor wave ABC.
This leads into an intermediate wave regular flat ABC but now it is inverted for reversal.
And now the 5th wave is the dominant trend coming in to the upside to print LPS Last Point Of Supply and move up to SOS which will be the wave 1 of the trend up.
The change of character CHoCH is clear as TOTAL2 has become impulsive and there have been many alt explosions recently in reflection of that.
As TOTAL2 moves past AR it is a textbook accumulation. The only difference is that crypto doesn't seem to bother with ST or even a SPRING since it is more bullish in correction than other markets.
And from here it may fall and print BU/LPS which is a re-test of AR resistance turned support. But it will very likely be heading up after that and alts will be off to the races yet again.
Buh-Bye! 😄
TOTAL2 trade ideas
TOTAL2 BULLS ARE STRONG HERE|LONG
Hello, Friends!
After some time of sending us mixed signals
TOTAL2 is finally giving us a solid bullish bias
And judging by the price action at the lower timeframes
The pair is about to go up!
BUY!
✅LIKE AND COMMENT MY IDEAS✅
analysis of total2 1H time frameanalysis of #total2
1h time frame
#bearish
according gan fan anlysis

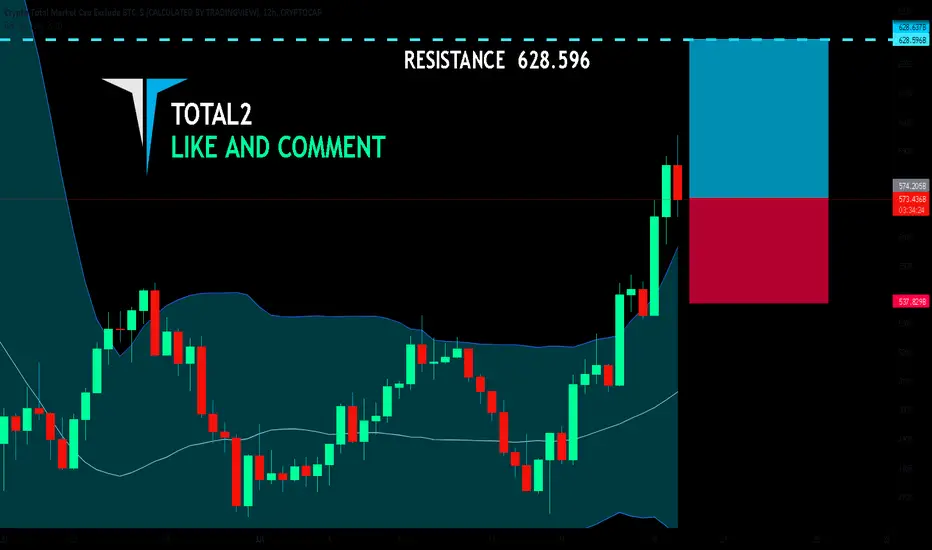
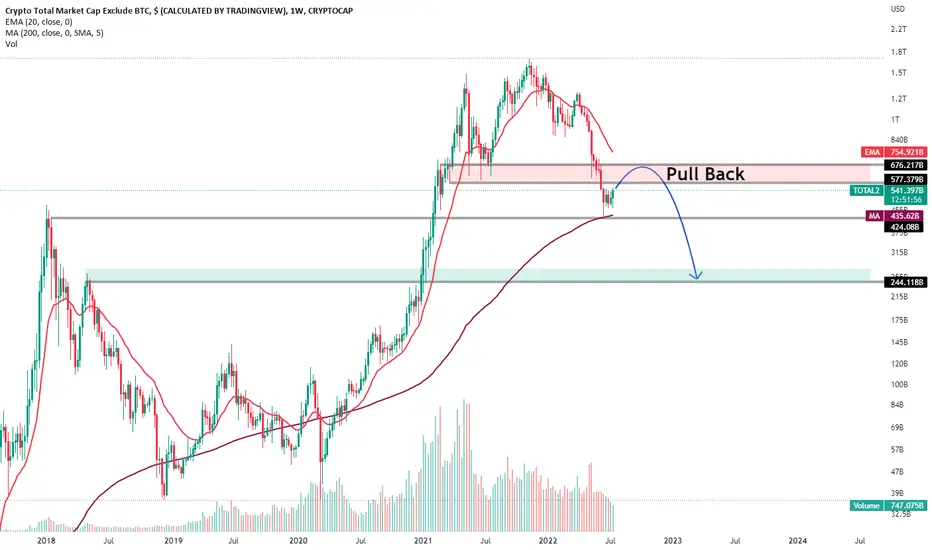
TOTAL2The support of 600-700 billion dollars of Total 2 has now become resistance, it seems to be pulling back to resistance.
#ALT MARKET CAP is on the run! 15% Rally ahead!Welcome to this quick update everyone,
Altcoin Marketcap is bouncing after printing a higher low.
The index reversed on 18th June 2022 with a low of $430.955 Billion Marketcap.
Currently its trading inside a rising channel and to cpmleyte it needs to print another higher high which gives us our short term target of $573 Billion, almost 15% from current level.
THERY TO KEEP IN MIND:-
Since this is a rising channel which is generally bearish in nature and often considered as a bearish continuation pattern unless broken to the upside.
This is a very interesting scenario here. BTC has been surprising us since the last few months and ALT MARKCAP breaking to the upside after printing a bearish pattern could be another surprise while the whole crowd is completely bearish.
This is just a theory. The chart along with multiple indicators are showing possibility of a 15% rally in this index which will eventually push the altcoins 20% to even 50%.
So take your trade decisions accordingly.
INVALIDATION:- A CANDLE CLOSE BELOW THE RECENT Higher low of $461 billion will invalidate this chart.
DYOR before taking any trade decisions based on this chart.
Do hit the like button and share your views in the comment section.
Follow me for more quality updates.
I don't post much , I only do when it's needed.
Thank you
#PEACE

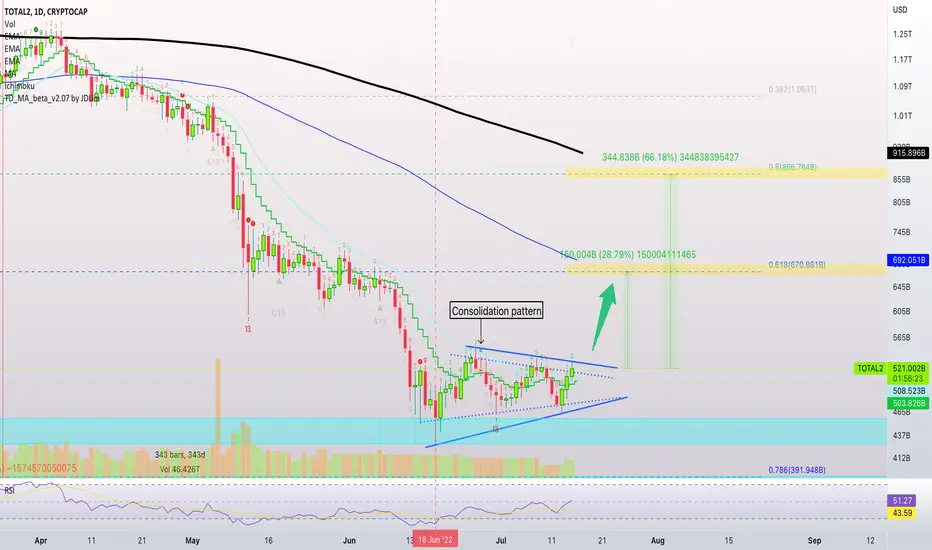
TOTAL2 Can Grow by 150 Billion (25% Or More)Greetings my fellow cryptocurrency traders.
We are looking at TOTAL2 with a chart similar to Bitcoin and all major Altcoins.
This index is trading within a consolidation pattern which is very likely to break bullish based on how the market is doing when looking at the indiviual charts.
The targets are mapped on the chart.
We aim first at 670B but it can go higher.
We wait and see how this level is handled and after the data is in, it is easier to tell if it will continue higher or retrace to new lows.
More likely that a retrace after this target is hit ends up in higher low, to later hit a higher target before the next major correction.
This correction can set the bottom before sustained long-term growth.
That's my analysis of the crypto markets and this chart.
Namaste.
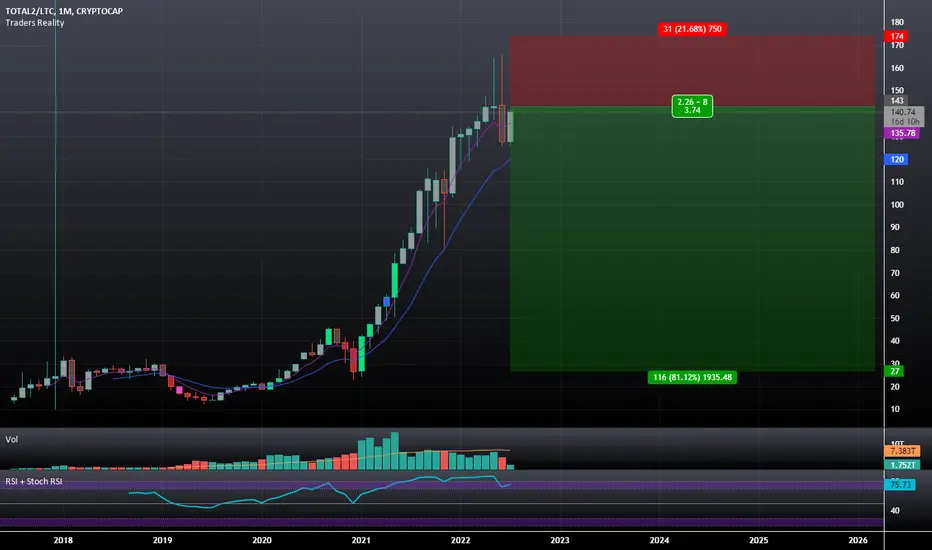
LITECOIN to Take $19 Billion From The TOTAL2 Altcoin MarketcapWe have a Bullish 3 Line Strike as well as a Tweezer Top Visible on the Monthly Timeframe which would Currently put LTC on a path to take atleast a 3.7% Market Cap Dominance over the Total2 Crypto Market Cap which at TOTAL2's current USD value would put LTC at a Market Cap of atleast $19 Billion which is a little over 11 times more than it's current Market Cap; Assuming that the Circulating Supply of LTC remains near where it is, that would imply that the LTC/USD price will go up to around $584.85 per coin of this TOTAL2/LTC chart were to play out.
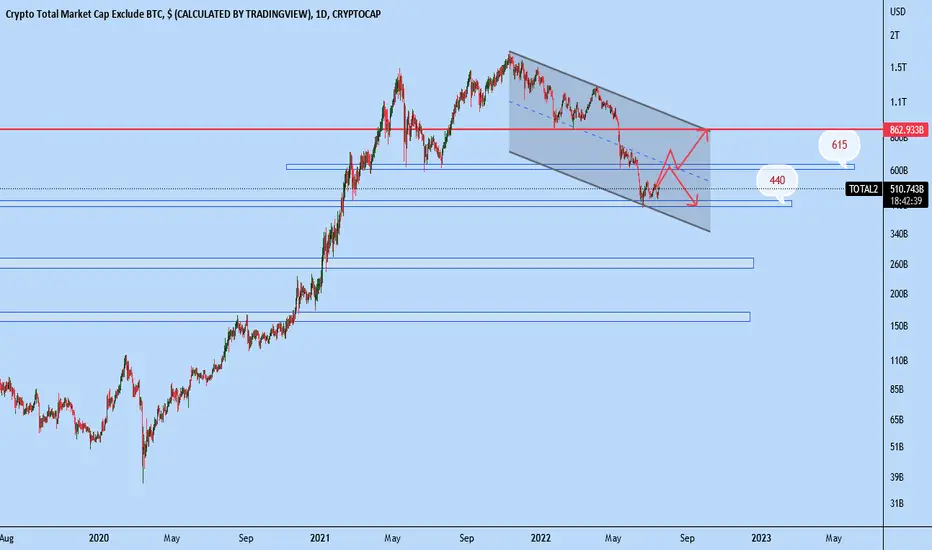
TOTAL2TOTAL2
It is located in a descending channel, which has shown weakness compared to the support of the bottom of the channel and 440.
It is expected that the midline of the channel and the resistance of 615 will grow and we will start our downward trend again.
#TOTAL #TOTAL2 #BTC #BTCUSD #LUNA #LUNC #UST
CRYPTO total ; ALTS ; repeating RSI patternsCRYPTO total ; ALTS ; repeating RSI patterns
as the title; the last one linked showed our potential roll over, which unfortunately has happened and a bear market is now in full swing. seems like we are at that capitulation omega point in the cycle.
hard to tell which one of those two red arrrows we are at IF we are just repeating cycle momentum here. looks like a potential bottom, or at least large bounce, after riding back to double bot on the small time frames here.
also we fast roll over here, and a massive last leg down happens real fast. like minus 30-50% in a day or two.
its actually an easy play because it will be strong and fast either way.
lesson: dont put your buy too low within the 'roll over dome threshold' lol! dont get too greedy on your bounce entry in other words.
Crypto Total Market Cap Exclude BTCCrypto Total Market Cap Exclude BTC
There is a strong relationship between this index and altcoins that should be considered before trading altcoins
This is my personal idea and it is not financial advise

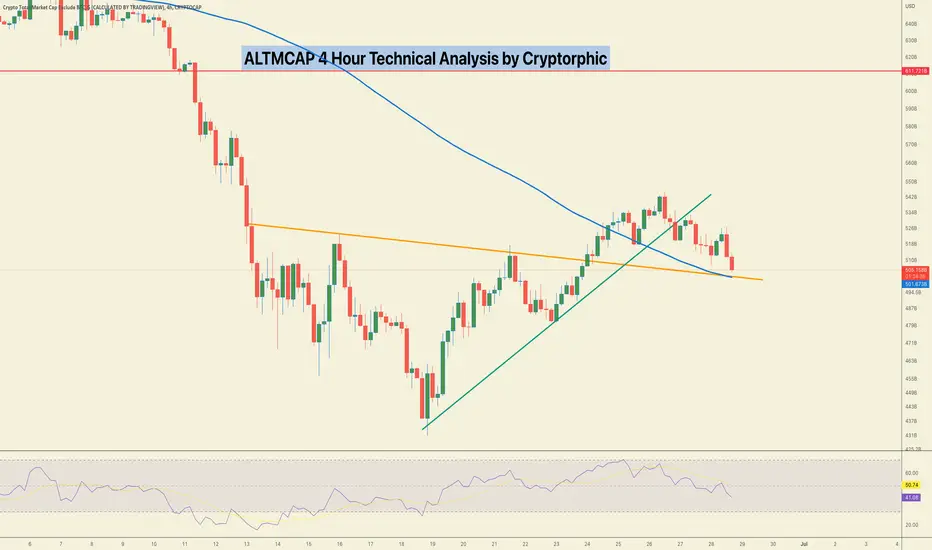
Altcoins could see more pain as Feds keep up Interest rate hikesUsing a 4 hourly chart. Unfortunately, as we move into this bear market with all of the recession and inflation fears we will continue to see a drawdown in crypto prices. As I posted recently on a hidden bearish divergence with the Altcoin market cap chart we are starting to see a pullback already. I have a fractal for illustrative purposes only and as a visual of what can happen price-wise. Inflation numbers come out July 13th and then after this we will know how aggressive the Feds will be with the next rate hike.

ALTS MARKET CAP UPDATE Hi guys, This is CryptoMojo, One of the most active trading view authors and fastest-growing communities.
Consider following me for the latest updates and Long /Short calls on almost every exchange.
I post short mid and long-term trade setups too.
Let’s get to the chart!
I have tried my best to bring the best possible outcome to this chart, Do not consider it as financial advice.
ALTS MARKET CAP is making these two patterns in which one is bearish and one is bullish .
ALT MARKET CAP is forming bearish pennant in 4hr timeframe
If pannent broken downside then is ready for another 30% bearish wave.
TOTAL MARKET CPA is forming this symmetrical triangle also So let’s wait for a sustain break down or breakout will confirm the next move of the TOTAL MARKET CAP.
Let's see how the market will react in few hours.
Stay tuned
This chart is likely to help you make better trade decisions if it does consider upvoting it.
I would also love to know your charts and views in the comment section.
Thank you

Next Bounce for Crypto?We've met resistance and recently seen some strong buying on this 5-year trendline. If it continues to act as support, then we might see a good bounce from here.

Altcoins Bearish Hidden DivergenceWe are posting a Hidden Bearish Divergence on the daily chart with Altcoin Market Cap.

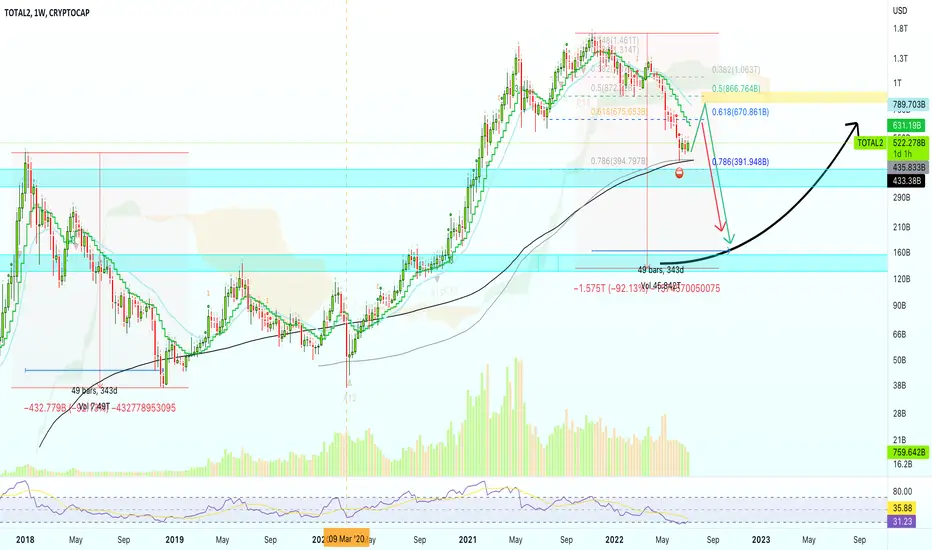
TOTAL2 Weekly TF Analysis (Bounce, Drop, Up)This is an interesting chart.
TOTAL2, the index for the top 125 cryptocurrencies excluding Bitcoin.
TOTAL2 bounced right at EMA300/MA200.
The grey/black lines on the chart.
TOTAL2 managed to close above EMA300 back in March 2020, afterward a strong bullish market followed.
This time around we can see another bounce at this level:
- The RSI is starting to curve upward.
- We can also appreciate a hidden bullish divergence.
The difference between now and March 2020 is big.
After March 2020 the market moved straight up.
After July 2022, we can see a bounce followed by another crash before the phase of sustained long-term growth.
(Bounce, drop then up)
TOTAL Weekly Chart:
Namaste.
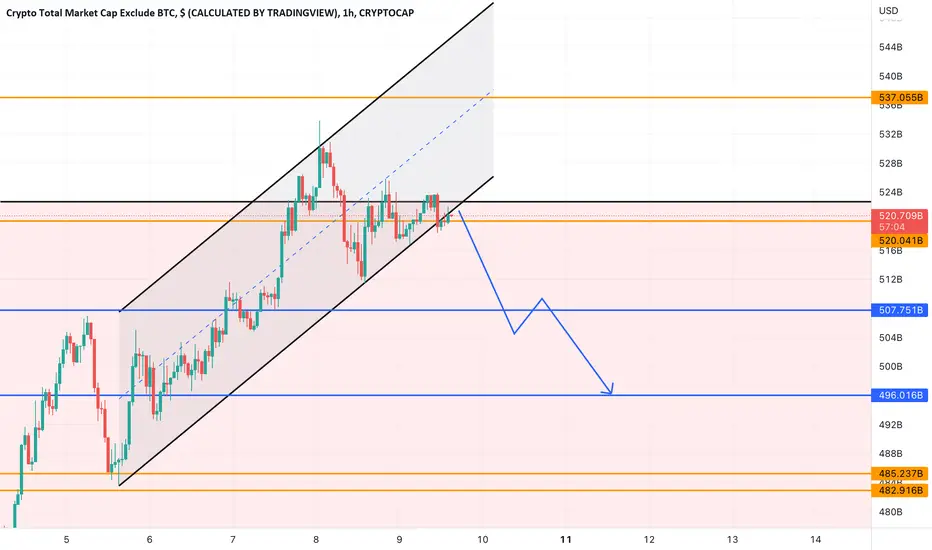
Possible pathway for TOTAL2Here is my opinion on possible pathway and direction of TOTAL 2 in short term…Weakening of buying strength together with overbought state of channel with retrace back to channel indicates me of possible downward trend.
Lets see if it works out…
Always a student
TOTAL2 - New lows Soon - alts bleed 45%Higher low, higher low and again higher low. Clear Ultra bearish scenario. Alts about to bleed additional 35-45% where they will bottom and a mini alt season will start.
Buy in alts when this charts bottom and compare to BTC.D where it should be at 49% => HIGH BUY
TOTAL 2 following my strategy to the tick.
Thanks me later, cheers!

Total2 In a delicate position.Crypto market cap hanging by the edge. 50% more down from here if it fails to bounce.

TOTAL2 - Daily Bullish DivergencePrice prints lower lows
While indicator prints a higher low
This is a Classic Bullish Divergence
Daily timeframe

#ALT MCAP $500 billion at critical level.
ALT MCAP is moving towards the 100 MA support around $500 billion mcap.
This is an important level to hold.
A green close above this level could trigger a bullish rally across the market, until it happens we are short-term BEARISH.
Be careful.
Let me know what you think in the comment section. Do hit the like button if you like me to post these small updates.
Thank you
PEACE
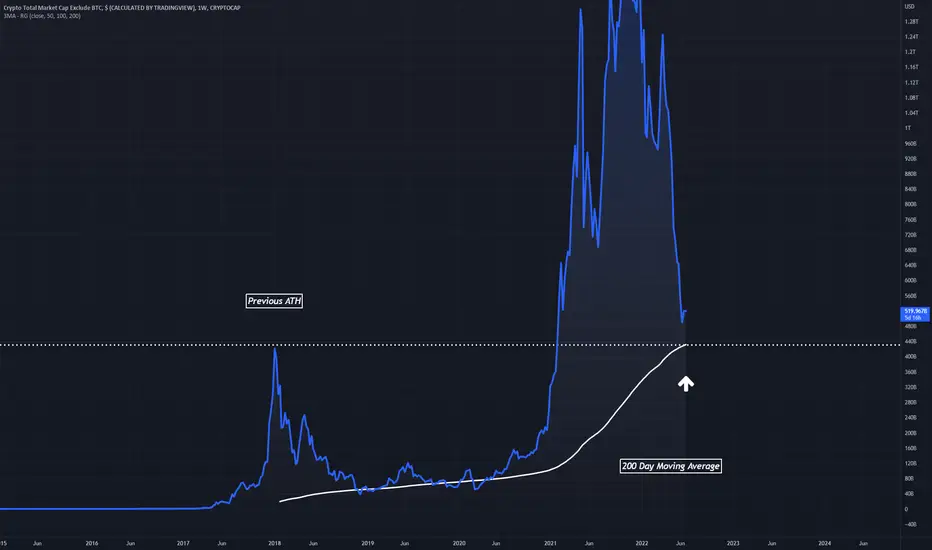
TOTAL2 - Altcoin Market Bottom (200MA) TOTAL2 has endured most of its bearish activity, with price finally reaching the Weekly 200MA
This 200MA aligns perfectly with the prior 2017 bull run
An entry along this line is optimal
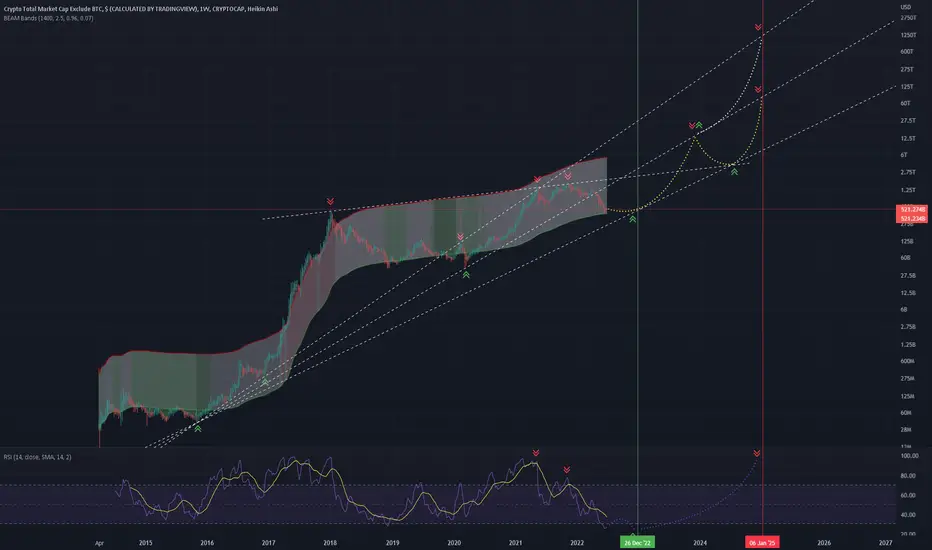
#TOTAL2 #ALTCOINS - forecast for the next 4 yearsI will be brief. The main article is in the appendix. In addition to it, I would like to offer a corresponding forecast for altcoin market capitalization.
On the graph I marked a supposed growth of capitalization. I do not give exact entry/exit numbers, but you can calculate the approximate ranges. The trend itself is important.
Not advice, but a demonstration of my own strategy for the next few years.
Good luck to all and strong seat belts in this rocket! 🚀