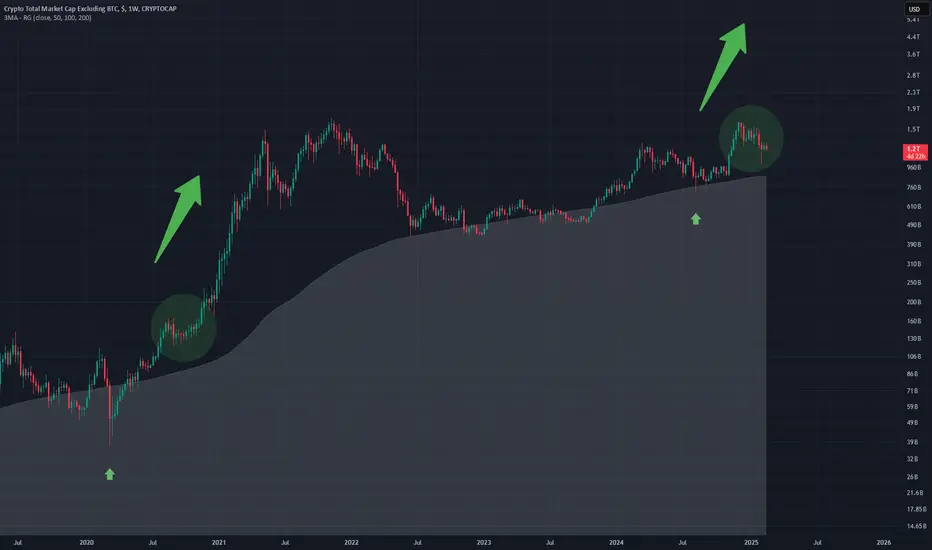
TOTAL2 - Similar Positions The White area represents the 200MA and in both situations the MA is tested and then puts itself in the prime position (green circle) We are now in this prime position.
The white area will unlikely be tested again this bull run as we are heading into the next phase of the bull run indicated by the arrow
BULL TIMES
Weekly timeframe
TOTAL2 trade ideas
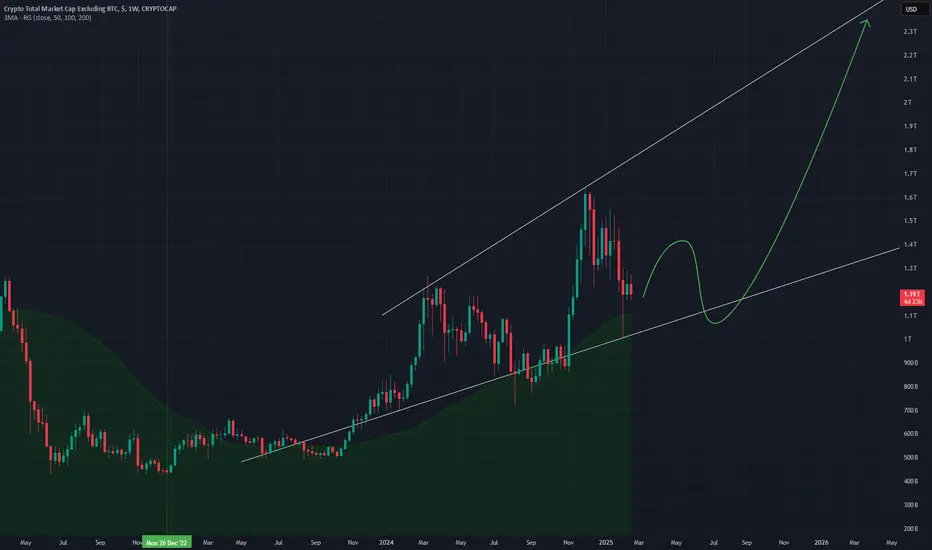
TOTAL2 - Rising MegaphoneThis structure allows for strong bullish continuation on this TOTAL2 chart
The green area line shows the continued support for price, this is also the 50MA
I believe we are going to see more support for alts and therefore the market cap will increase
Bullish on this Weekly
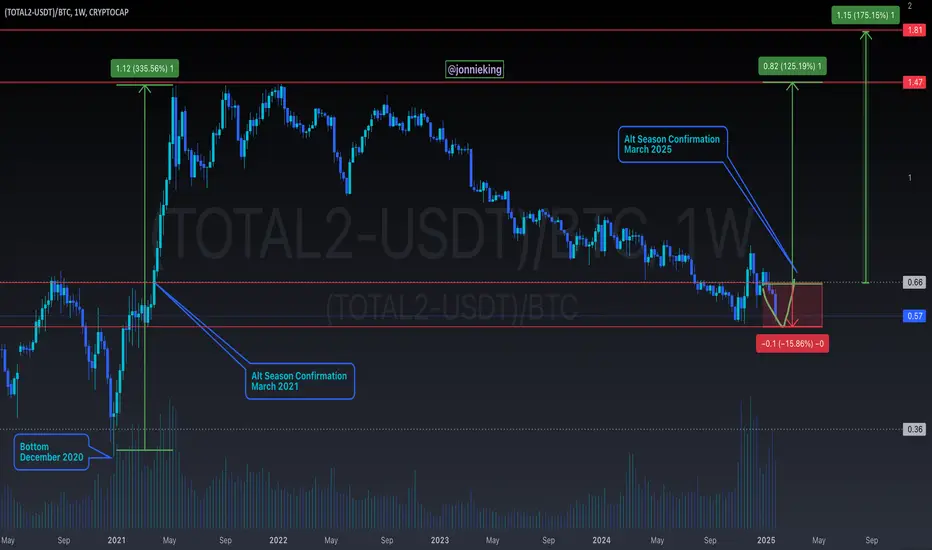
New ratio chart: $TOTAL2/$BTCToday we are looking at a new ratio chart where we plot the CRYPTOCAP:TOTAL2 (Crypto market cap without Bitcoin) vs CRYPTOCAP:BTC market cap. As we see from the chart the ratio chart as we see is making lower lows and lower highs. ALTCOINS are bleeding against the CRYPTOCAP:BTC in this Crypto market cycle. The long-awaited ALTCOIN rally is still missing in this crypto market cycle.
With TVC:US10Y holding onto the 4.5% level there is very little respite from the pressure on the ALTCOIN market. The recent meltdown of the meme coin market is also adding pain to the $CRYPTOCAP:TOATAL2 Market cap.
If we plot the Fib retracement level from the top to the bottom in the ratio chart, then we see that the chart is @ 0.236 level. The chart pattern is not bullish, and it is still below the 0.236 Fib level. The chart is bearish and maybe the Ratio CRYPTOCAP:TOTAL2 / CRYPTOCAP:BTC touches 0.36. May be by then the CRYPTOCAP:BTC.D @ 66% as predicted in my blog on 9th Feb 2025.
ALT SEASON IS COMINGWouldn't this be the perfect outcome? something many aren't seeing anymore at this point.
One thing i've been noticing is that social behavior is massively changing and people are litteraly stcuk in the trenches and hating on each other for being bullish or bearish which is basically the type of behavior like what we had in 2020 during COVID.
I overall remain bullish and don't see any reason why i shouldn't be. All the fundamentals are in our favor and AUM's are filing for ETF for alts left and right which means a requests to inject BILLIONS in capital into them.
Time will tell of course but i overall remain bullish untill proven different.
CRYPTO IS UNDER. VALUED.

Altseason? YesHello
How are you?
Bitcoin grew well, but other currencies lagged behind
If the pattern that has formed is complete, we will see multi-fold growth for many currencies.

Altcoins Variety: 2025 Bull-Market —Bitcoin Is Better Than GoldI am going to be looking at everything and sharing it here for you.
Some pairs (Altcoins) will produce all of their growth in 6 weeks and that's it. Other pairs will grow steady for 8 months. Some pairs have already been growing for years and will continue to grow. Some will produce a steep incline while others do so very slowly producing a long upward curve.
Some pairs are stable while others are unstable.
There is no way to do it right or wrong. Choosing wisely is choosing what works for you.
If you dislike risk and have a big capital, you can always choose the bigger more stable projects.
If you enjoy risk and have a small capital, you can go for the smaller projects with huge growth potential.
If you are in-between you can pick and mix. Long-term stable growth projects, short-term projects, on and on.
If you have experience you approach the market in many ways at the same time. A portion of your capital goes for margin/leveraged trading. Another portion remains in cash for great timing based opportunity. A big portion is your long-term portfolio, another portion for spot. Long-term storage, hardware wallet, so on and so forth.
Strong variations.
I share the basics and a simple strategy.
I share many methods and varied strategies.
I shared advanced complex and strategies.
You choose what works for you.
There is always the need to adapt the information to your own liking.
The information needs to be adapted to your living style, lifestyle.
The strategy needs to be adapted to your risk tolerance, your goals, your capital and the pairs that are available for trading where you reside. Not all countries hold the same rules. While some are restrictive towards the Cryptocurrency market, others are supportive of the market.
I make generalizations but we have to do what works for us.
You have to do/choose what works for you.
I can call to your attention many different pairs. Hopefully with great entry timing and good potential for growth. It is your job to decide how much to buy and for how long to hold.
The real basics start with the simplest strategy, buy and hold. As we go through this strategy, join the market, enjoy the market and start to experience success, we expand and add more complex tools to increase our potential for gains.
Strong variations, but I am here for your support.
You can count with my guidance for the long-term.
The information that I am sharing and will continue to share should not be construed as financial advice. This is technical analysis at its best.
I am also sharing my opinion and my many years of experience. I've been in Crypto since 2013. Started trading the Altcoins in 2014. Now, I am writing for you all.
Started writing here on TradingView in 2017. And I appreciate your amazing and continued support.
We are only getting started.
A new bull-market is upon us and we will be blessed with lots of the best. The best is yet to come.
Thank you.
We are getting ready.
We are getting closer.
Once the action start, there is no going back; Cryptocurrency is changing the world.
We will have a better world based on free, decentralized, secure, middle-man free, independent money. The money monopoly is over.
Money is now owned by the people.
This is the biggest technological development since the Internet.
Crypto (Bitcoin) is the most important financial development since Gold.
Namaste.

ALTS painting a clear Cup & HandleNot sure what to do with this information.
I am cautious up here as many of my ALTS are already up over 400% and I have taken profit, just can't unsee what is cooking.

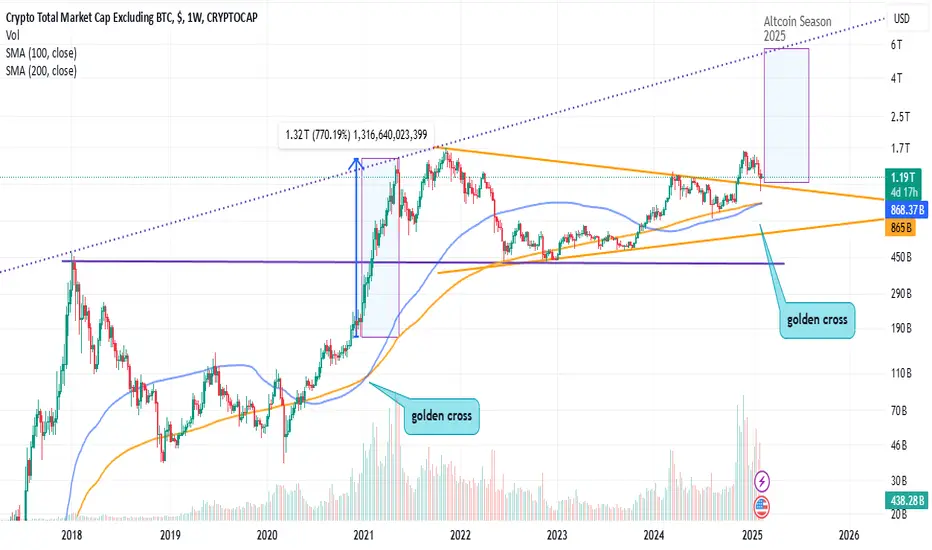
Golden Cross Alert! Altcoin Season is Imminent!Hello Traders 🐺
A Golden Cross has just formed, signaling a massive bullish momentum ahead ! Historically, this pattern has led to explosive moves in the market, and this time might be no different!
With BTC dominance reaching key levels and money starting to flow into alts, the long-awaited Altcoin Season could be just around the corner! ⏳💎
Are you ready for the ride? 🚀📈
Make Sure to read my Ideas about ETH and BTC.D !
TradeCityPro | TOTAL2 BullRun Trigger Identified!👋 Welcome to TradeCityPro Channel!
Let's go together to examine and analyze the Total 2 chart in the Dominance section, which includes all cryptocurrency coins except Bitcoin in its chart.
🌐 Overview Bitcoin
Before starting the analysis, as usual, we wanted to take a look at Bitcoin in the one-hour time frame, but we made an interesting decision with the team guys and decided to analyze Bitcoin for you every day with a poll that we posted in Telegram. Today's analysis was also uploaded before the start of the New York session and you can see it from the link below.
📊 Weekly Timeframe
In the weekly time frame, we were rejected from our ceiling, which is an important point of $1.62 trillion, and this makes the ceiling more and more important for us than ever.
Let me also tell you a teaching point that I just pointed out to you on a candle on the chart, and these candles are mostly made at the market ceiling or a place where At least we are going to get rejected from it and it is an important resistance for us and they are usually red and have a longer shadow than the body from below. I suggest you watch them for a while so I can teach you.
Also, if you are looking for an entry trigger for bull runs and spot purchases and anything else, your best trigger will be on the weekly time frame at 1.62 and after the break, good money will enter the market and our new primary trend will be formed and I will definitely enter myself.
We also had another entry with the resistance level of 662 billion and it was mostly Ethereum, Solana and Link that we tried very hard to break 662 and be with it and I will try just as hard to break 1.62 and enter it. We are currently at the support of 1.13 and in case of a deeper market correction, we will move to the levels of 974 and 817.
📈 Daily Timeframe
On the daily time frame, the total two is very good and this shows that Alt Coins above rank 30 did not make a very deep correction, and if you look at the charts that you see had a deep decline, they are still correcting, and the main reason for the chart being this way is Solana, XRP, BNB, and SUI.
Also, after breaking our good daily trend line and breaking the 974 billion box ceiling, we experienced a very good upward movement and moved to the 1.55 level and the important ceiling, and we actually suffered a heavy rejection, but because it was because of FOMO, we could not count on its resistance, but the pullback and future rejection formed the important resistance price of 1.55.
After forming a daily range box of 1.32 to 1.55, which we had been suffering for a while, and the recent series was very weak, and it caused us to suffer a rejection halfway through and break the 1.32 support in a sharp manner and come to the 0.5 Fibonacci support, which is very important both in terms of Fibo and also in terms of Dow. 50% correction is very important and this could be the place where the price rises
We will probably stay on this support for a while and suffer and then move up and if we lose 1.17 we will go for lower levels like 1.09 and 974 billion but the most important support that should not be lost is 797 billion but there is a long way to go
📝 Final Thoughts
Stay calm, trade wisely, and let's capture the market's best opportunities!
This analysis reflects our opinions and is not financial advice.
Share your thoughts in the comments, and don’t forget to share this analysis with your friends! ❤️

February Altcoin Requests Hey everyone,
Surviving the Bloodbath & Finding market Opportunities! As we know the market has been brutal with relentless drops, liquidations, and many portfolios deep in red. The current conditions are shaking out weak hands, and it’s frustrating watching investments get drained daily. But this is when smart traders prepare, adapt, and position for the inevitable turnaround.
That’s why we’re opening up our February Alt Requests! Let’s identify potential recovery setups and navigate this market with strategy and patience.
📅 Submission Deadline: February 12th, 2025
🔹 Request Guidelines:
✅ Each member may submit one altcoin for analysis.
✅ Use the format: ETHBTC, ETHUSDT, or ETHUSD.
✅ Ensure you include the coin’s ticker symbol or full name.
Despite the harsh conditions, we’re committed to analyzing at least 30 altcoins and providing clear, unbiased insights to help everyone make informed decisions.
⚠ Important Reminder:
All analyses are for informational purposes only and do not constitute financial advice. Always conduct your own research before making investment decisions.
💡 The market is ugly right now, but this is also where the biggest opportunities are born. Stay focused, stay disciplined, and let’s work through this together! 🚀
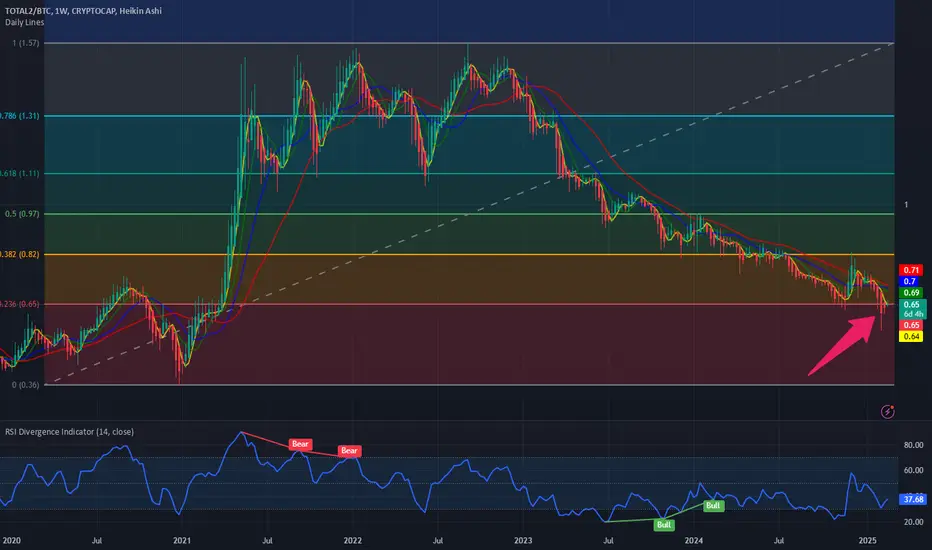
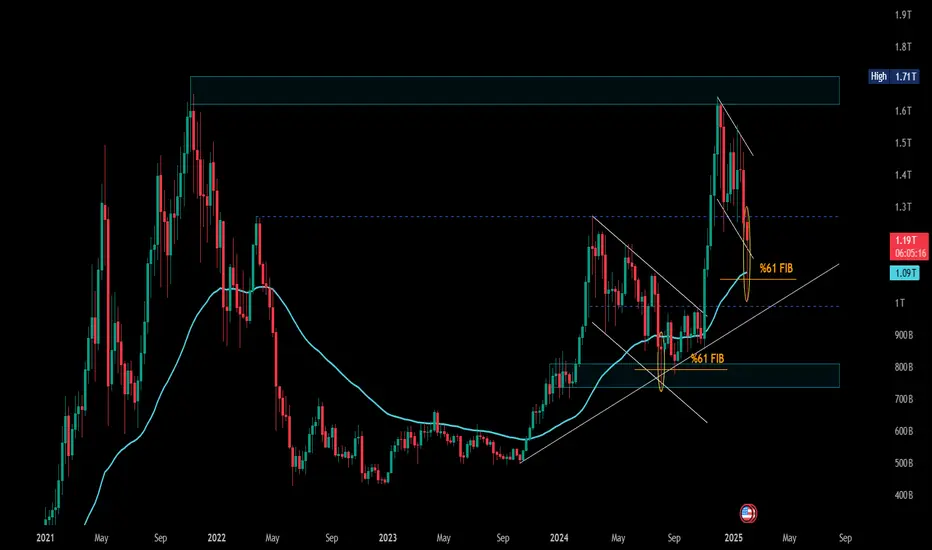
TOTAL 2 repeating the same pattern of cup&handle also a line witrepeating the same pattern of cup&handle also a line with the 50 EMA and 61% Fibonacci level
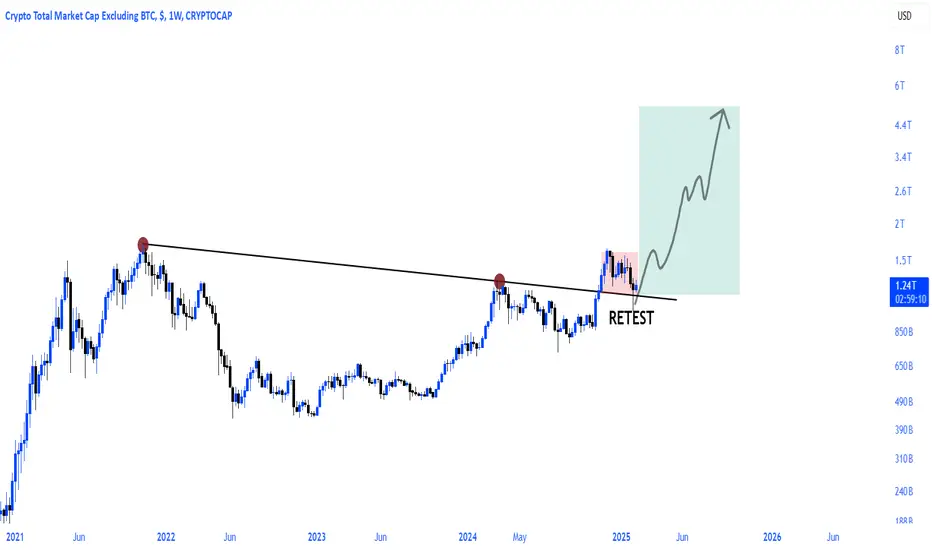
About to Sell Your Altcoins? STOP & Read This First!!🚀 Hey Traders! Ready for Altcoins’ Next Big Move? 👋
If you’re finding value in this analysis, smash that 👍 and hit Follow for high-accuracy trade setups! 💹🔥
I know many are frustrated and losing hope in altcoins due to the current market conditions. But selling your spot holdings now—right before a major move—could be the worst decision of your trading journey. Before making any rash decisions, read this update carefully! 👇
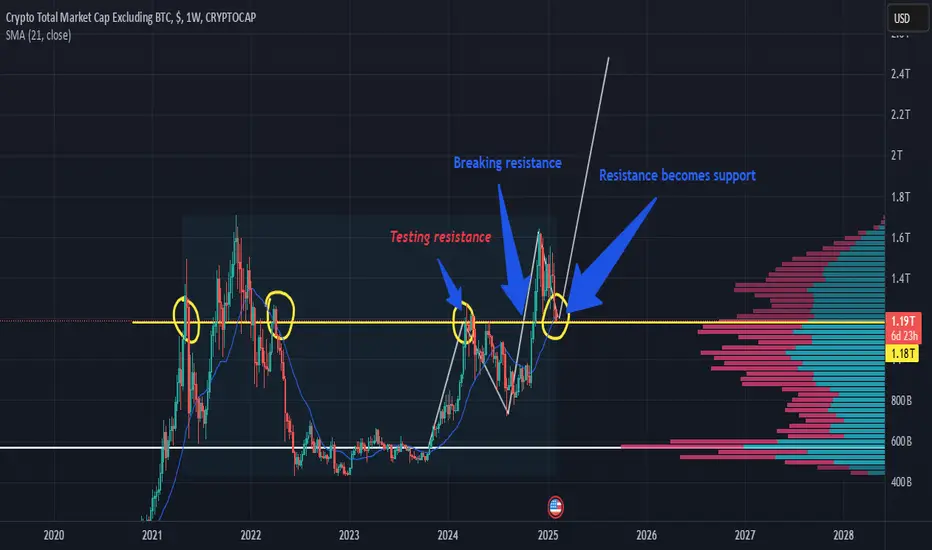
📊 What is Total2?
Total2 represents the total market capitalization of all cryptocurrencies except Bitcoin (BTC). It helps us gauge the strength and momentum of the altcoin market.
💡 How to Use Total2 in Trading?
📉 If Total2 is falling → BTC dominance is high, and altcoins are struggling.
📈 If Total2 is rising → Altcoins are gaining strength, signaling a possible altseason.
🔥 Altcoin Market Cap (Total2) Looks Bullish!
✅ Breakout Alert! Total2 has broken out from a cup and handle pattern on the weekly time frame and successfully retested it. This setup is a classic bullish signal, suggesting a strong rally could be on the horizon.
🚀 If this pattern plays out, altcoins could skyrocket! Be patient—your altcoin holdings may soon reward you in a big way.
⚠️ Invalidation Level
If Total2 closes below $1 Trillion on the weekly timeframe, the bullish outlook weakens. Until then, the upside potential remains strong!
💬 What’s Your Take?
Are we about to witness an altcoin explosion, or will BTC continue to dominate? Drop your thoughts in the comments! Let’s ride this market together and secure those gains! 💰🔥

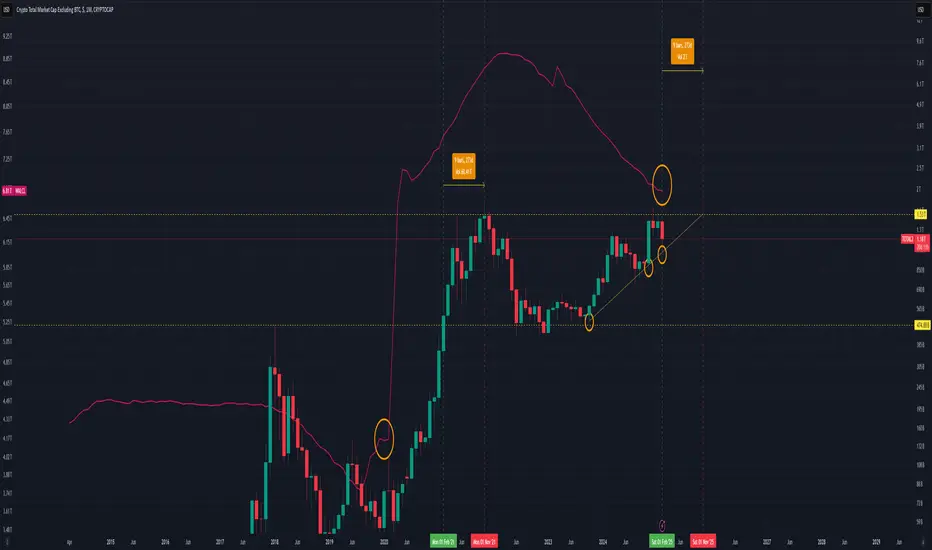
The elusive alt season... Is QE coming soon?The magical Alt season never seems to come. Most have thrown in the towel or lost all their money, which is a good sign the bottom is in.
The secret here is paying close attention to the FED's (FRED:WALCL) Quantitative tightening and easing.
Since the start in 2008, we have always either had QE or some sort of pause like you see in the 2016/17 bull run, but as soon as the FED flips to tightening, what happens? BTC pauses.
It is true that Bitcoin has performed very well during tightening cycles, as massive corporations like BlackRock and MicroStrategy are eating through the supply.
As for the altcoin market, it has been a bloodbath. One thing that’s clear to me is that altcoins need the FED to flip to QE in order to get things really going.
Going over the latest FED's Monetary Policy Report that came out yesterday, it hints that they are close to ending their tightening cycle and easing off a bit.
**WHICH IS HUGE NEWS!**
We can now see that this is true indeed because the red line is now starting to flatten out, just like in 2020 before the FED flipped to QE.
As far as the technicals go, the altcoin chart has now formed an ascending triangle and, for now, is still printing higher lows. 20 days left for this monthly candle to close.
If, let's say, this monthly candle breaks ATH and closes above it, it could signal the start of the alt season, and if history repeats, we’re looking at a run-up from March 2025 to September/October 2025.
So the next FOMC meeting from the FED is the most important of the year. Now that this report hints at the end of the tightening cycle, is it possible that at the next FOMC meeting on March 18th, 2025, they will announce the end of tightening and trigger the start of the alt season?
Pretty heavy upper wick for now on the BTC.D. It’s currently on the .702 retracement. Is this the top?
A chart I use a lot. Really want to see this monthly candle close back into this triangle.
**Alts/USDT.D**
This chart is one of the most important ones I’m looking at right now. Currently forming a bump-and-run reversal, and again, very bullish if we hold the neckline.
The USDT.D chart will always lead the way. It’s always one step ahead, never fails me. Until we see a break of this green support line, we won’t see ALT season. The bear flag pattern target is the same target as April 2021, which is interesting.
As I published on my ETH TA, if we close the weekly in this channel, it will be very bullish.
### Conclusion
I'm extremely bullish right now. Leverage has been reset, greed has been reset, and everyone is throwing in the towel. On social media, "it's over" talk is everywhere. This is the kind of depression I'm looking for to tell me it’s the start of ALT season and not the end.
**Invalidation of this thesis would be the following:**
- ETH closes weekly under the channel
- Bump-and-run reversal fails to hold the neckline
- FED does not flip to QE in the FOMC meeting on March 18th
If all these things happen, I will flip bearish. Until then, I'm extremely confident that this is the bottom, and you should go all out, lay all the cards down, take out loans, put all your chips on the table—it’s time to go hard or go home!
TOTAL2 may continue down 20%TOTAL2 broke the trendline and may be down more to its support line
It could be -20%, TOTAL2 include stablecoin, it means ETH may down 20-30%, mid cap 50-60%, small coin 80-90%

TOTAL2 - Support Found Above Down Trend Down trend in white has become a support level for price on this Weekly timeframe for this altcoin market
This is also within a small up channel forming
I expect further upward movement in the coming weeks
1T has a big support

Total alt coins If this support dont hold alt coins might re test recent lows . to the 1t support . Some alts got totally crused on the dip . I hold some cash and some eth now we will see if this support holds , long term i think the market will recover completly no reason why it will keep dipping if joe biden and gary gansler try to kill crypto and it survided now that trump and crypto czar are incharge there is no reason to be bearish long term. just an opinion

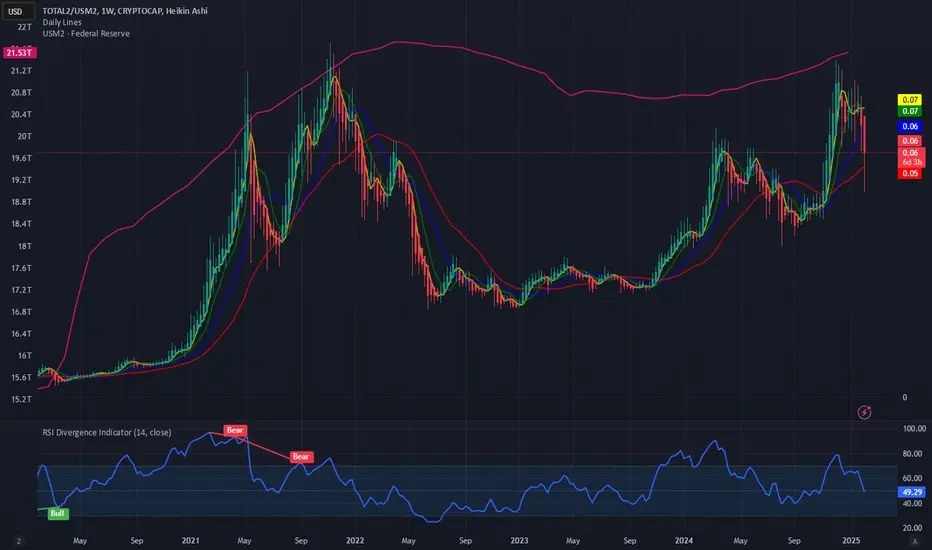
$TOTAL2 vs $USM2 RatioIn the crypto world many analysts watch the Money supply called M2 closely to determine the direction of the market. During the last crypto cycle, the CRYPTOCAP:TOTAL2 index (Crypto Market Cap without CRYPTOCAP:BTC ) hit an ATH when the M2 hit 21.75 Tn $. Since then, the M2 Money Supply has been trending down which resulted in a major bear market in the Alt Coin space.
If we look at the chart of CRYPTOCAP:TOTAL2 vs ECONOMICS:USM2 we see that the chart hit an ATH on Nov 21 with M2 peaking in March 22. The ratio chart hit a low on Jan 23 with M2 hitting the cycle low on Mar 23. Since then, the CRYPTOCAP:TOTAL2 vs ECONOMICS:USM2 has shown a steady recovery with an increased money supply. The current level of M2 is still below the peak of March 22. But with increasing M2 we can expect a bull run in the Alt coin market including $BTC. There have been recently some weaknesses in the chart on a short-term basis. Let’s see how the chart develops on a medium-to-long term. Until then watch out for this space. CRYPTOCAP:BTC CRYPTOCAP:TOTAL2 ECONOMICS:USM2
Beginning of Altseason.We are testing a support. Don't panic
When everyone says "no alt season" is time to buy. Altcoin rally in 3..2..1...
ALTCOIN SEASON called off? This chart is quite concerning Crypto Cap excluding CRYPTOCAP:BTC chart—essentially the total market cap of all altcoins, including CRYPTOCAP:ETH , CRYPTOCAP:XRP , and everything else except Bitcoin.
#
Another 3%-5% down, and our beloved (or most hated) altcoins will hit the Golden Pocket. Will this be the best time this year to load up before the inevitable "altseason"? Maybe.
Probably. Or maybe not—depending on the geopolitical situation, or rather, the geo-economic situation. Mr. President has decided to wage his trade war with most of the world.
I’m not going to pretend to know what’s going to happen tomorrow on that front. Maybe China retaliates with its own tariffs—nobody knows.
In my 12 years in crypto, I have never seen this level of uncertainty. This is madness. All I can do is sit here and analyze the impact off the charts.
The bullish pennant has been invalidated, and that pattern was supposed to give us explosive price action—to the upside. That’s canceled. Based on this chart and many others.
I still believe many cryptos will deliver fantastic returns this year. But a general altseason, where everything pumps?
Forget it. Those days are over. Selection of coins will be critical from now on.
That’s my thesis for the rest of the year. Not rushing into any more buying for now—heading to bed instead. Stay safe, folks, and maybe, just maybe, don’t throw any more of your funds into shitcoins. Most of them will die off, slowly but surely. 👽💙

TOTAL2 / BTC ALTS Should be Close to BottomingWho remembers this chart I posted a month ago on TOTAL2 / BTC ?
This was the one that TradingView shared of mine on 12/31/24
Called the double bottom here. My squiggles are undefeated.
Alts should be close to the end of bleeding.
One last flush I presume (hope) 😂