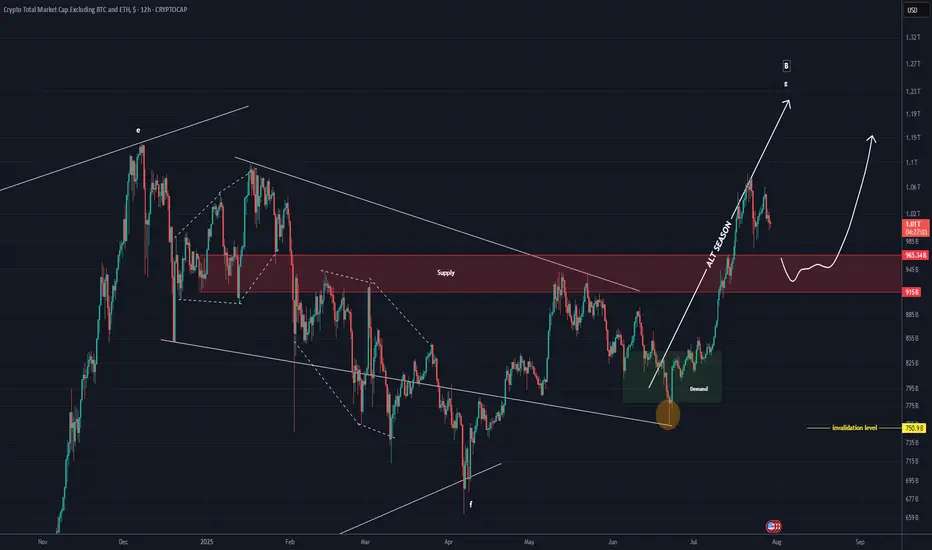
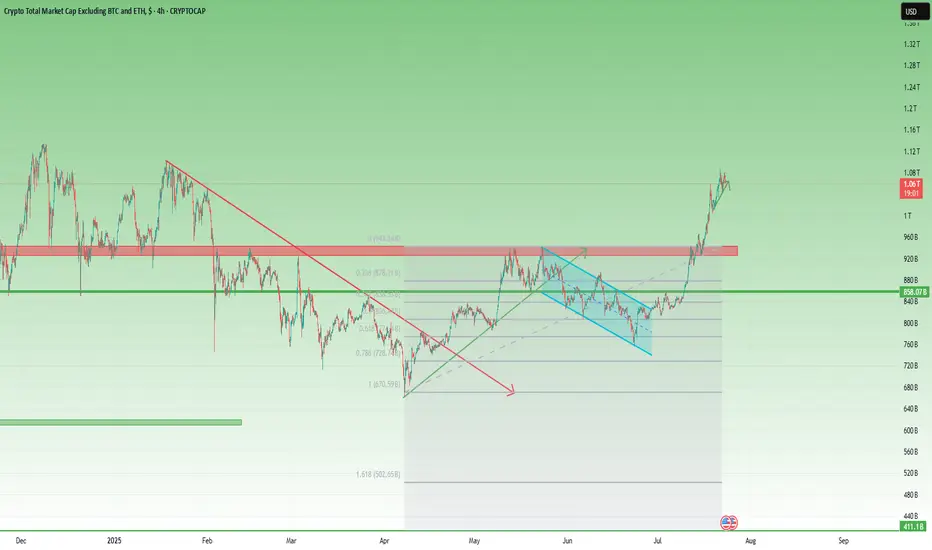
TOTAL 3 New Update (12H)This analysis is an update of the analysis you see in the "Related publications" section
This index has broken below the red zone; if a pullback to this area occurs, it may act as support again and the index could move upward
For risk management, please don't forget stop loss and capital managemen
Key data points
Previous close
—
Open
—
Day's range
—
About Crypto Total Market Cap Excluding BTC and ETH, $
Bitcoin and Ethereum are such major players and so popular among investors that when you enter the market, they draw all the attention to themselves leaving other coins in their shade. It's not that they do not deserve this attention, but without their colossal figures, investors could take a healthier look at the crypto market to define its overall state and direction. Following this logic, we've calculated total crypto market capitalization excluding BTC and ETH market caps and displayed how the final number changed over time on the chart. Hope it proves useful in your analysis of crypto markets.
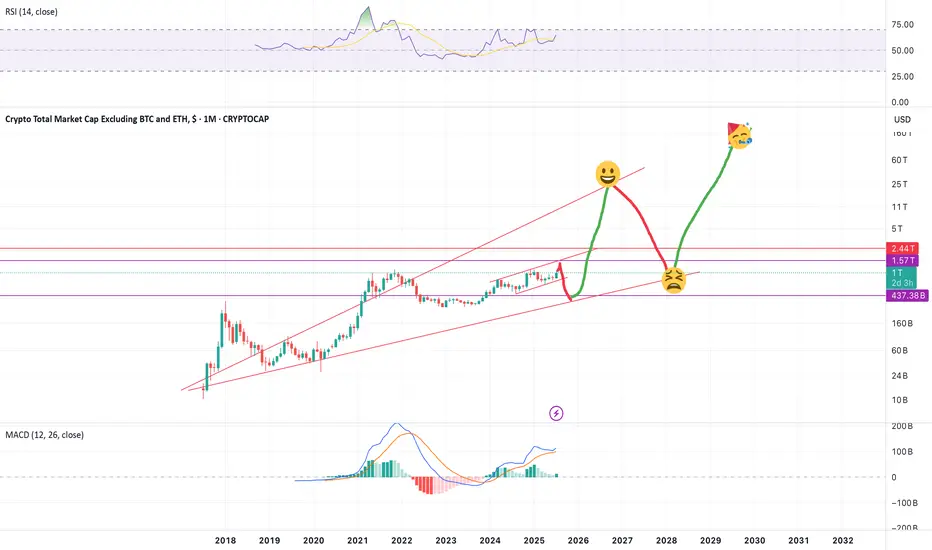
Total3 Wild ride, will make Millionaires and reck Millionaires this is not a financial advise but this is how i'm playing it
an investment of $10,000 can make you millions if played right.
buckle up
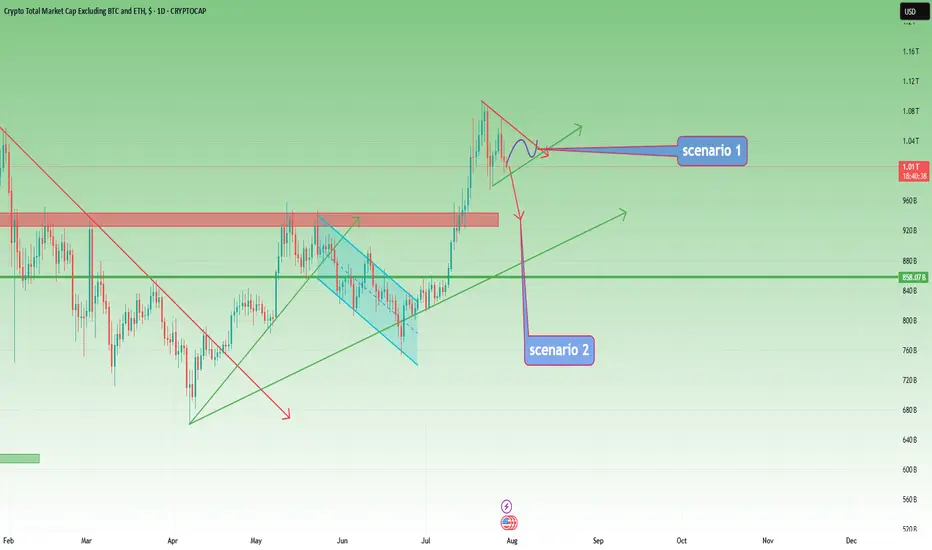
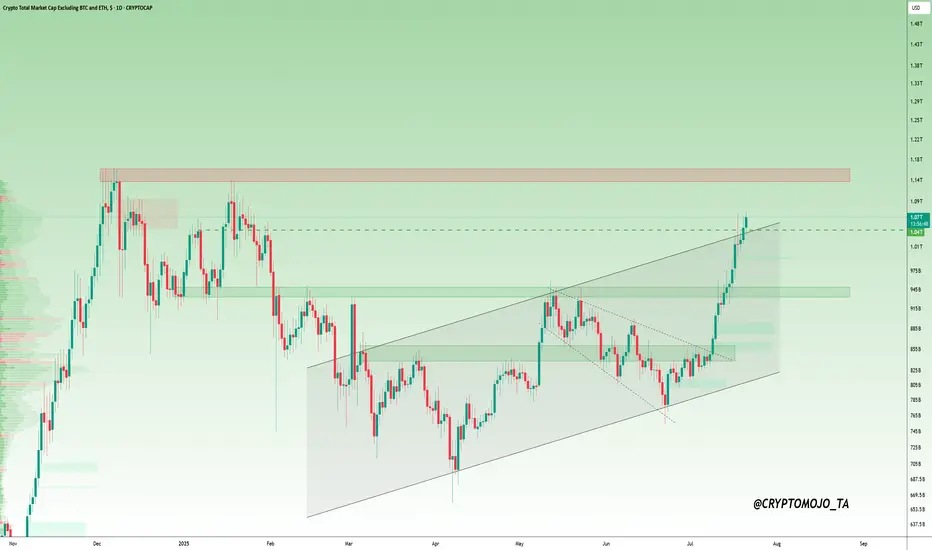
TOTAL3 – Still Bullish, But Waiting for Clarity
In my previous analysis on TOTAL3, I mentioned the high probability of a correction, but also noted that I didn’t expect the 925–940B zone to be reached.
And indeed, price reversed early — finding support around 975B before moving higher.
However, after a push up to 1.07T, the market has started t
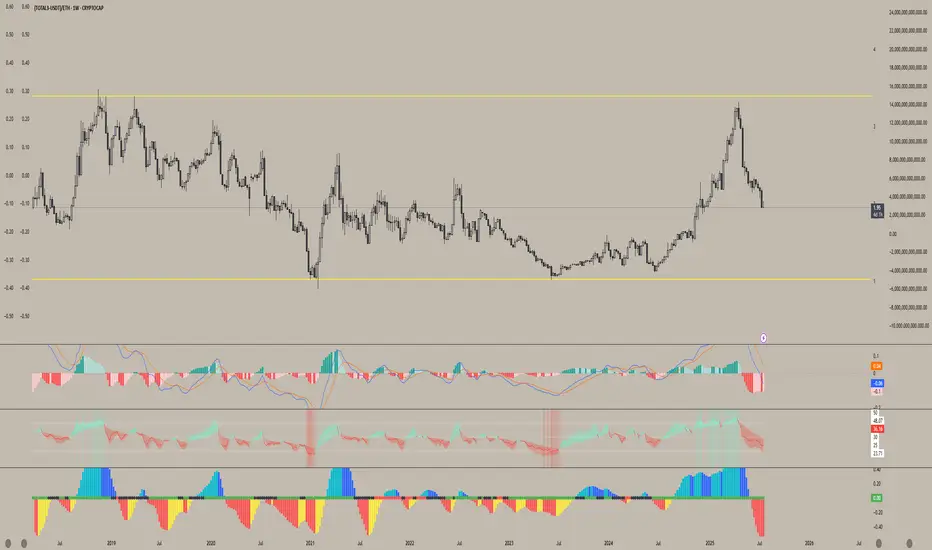
ALtseason-2025: where to exit?I have 2 metrics when I'm going to exit the market (with my profit):
1. When BTC.D falls to 40%;
2. When (Total3-USDT)/BTC = 1, in other words, when the amount of money in the altcoins is almost equal to the amount of money in Bitcoin and Ethereum.
When you see it happen, sell everything and exit th

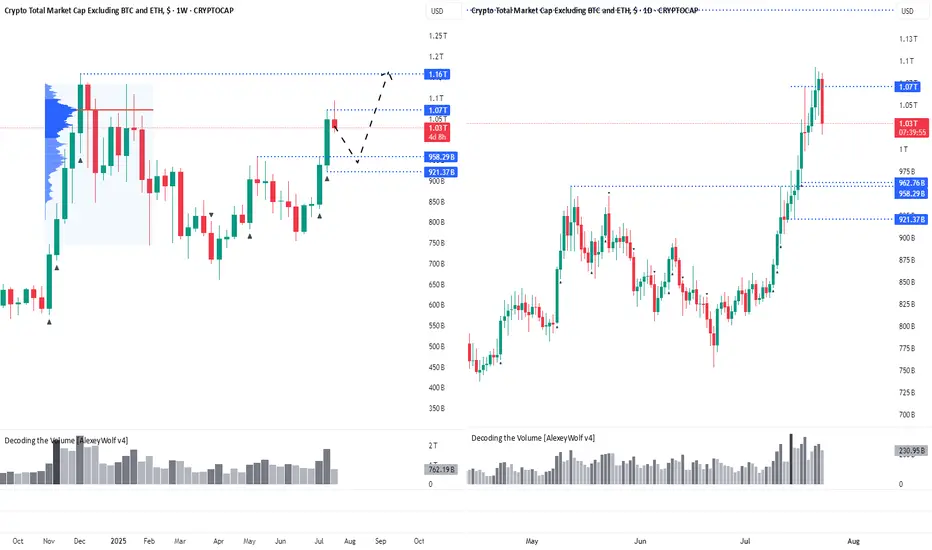
Altcoin Correction Scenario: Where to Look for EntriesHi traders and investors!
The market capitalization of Total3 has reached $1.07 trillion, marking the first major target for the altcoin market.
This level corresponds to the Point of Control (POC) from the previous bullish rally and the subsequent correction — a key area of traded volume and marke
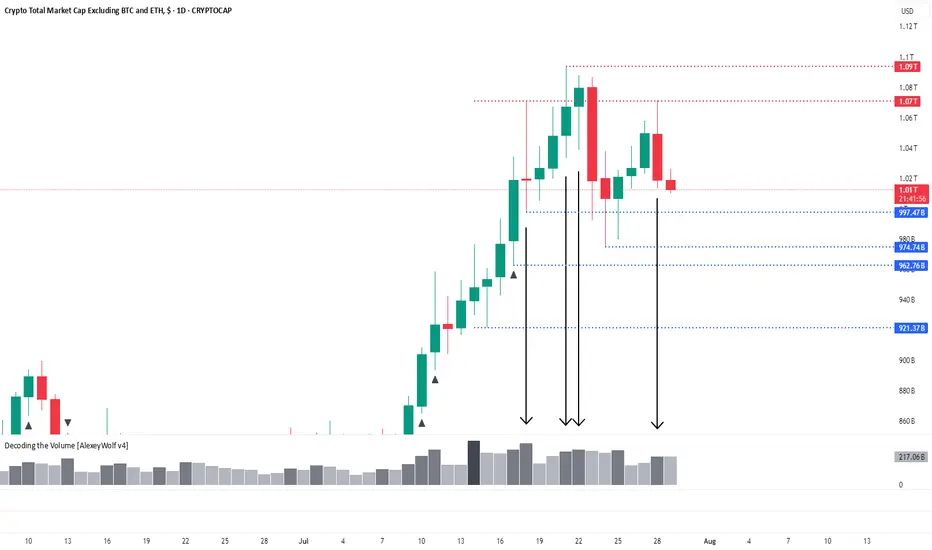
Total3: Fourth Interaction with 1.07 LevelHi traders and investors!
The altcoin market capitalization (Total3) is interacting with the 1.07T level for the fourth time — and once again, on increased volume. Yesterday’s price action formed a bearish candle after touching this level — a clear seller’s candle.
We’re now watching the 997.47B l
Altcoins are getting absolutely decimated relative to ETHWhile Ethereum has been on a massive run from its lows this year — pulling altcoins up with it — most alts are still lagging far behind.
This chart clearly shows how poorly altcoins are performing against ETH, reinforcing why, at least for now, ETH remains the better hold.
It also fits the classic
Altcoin Market at a Make-or-Break Moment!TOTAL3 Update (Altcoin Market Cap)
The altcoin market has just moved above the $1.05T mark. If this level holds, we could see momentum push us toward the $1.14T resistance zone.
But if it fails to sustain, a drop back to $964B or even $850B is possible.
This is a key moment for alts.
The next mo
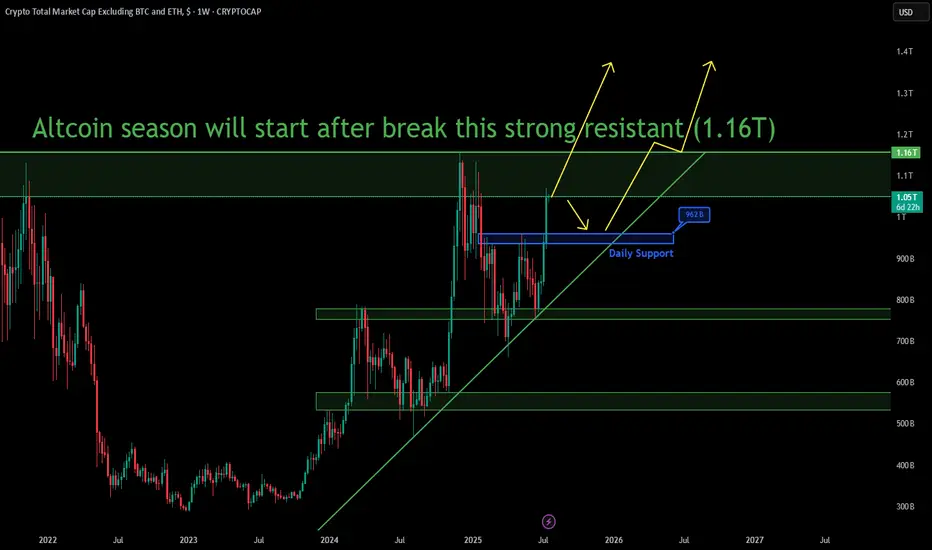
Altseason Bomb Start After $1.16T ? (VERY SOON!)The market structure remains bullish, supported by a strong upward trendline that has held firm since early 2024. Price continues to respect major support levels during pullbacks.
🔸 The key resistance level is at $1.16T, which has acted as a strong barrier in the past. A confirmed breakout above th
Total3 – Back Above 1T, but Will It Offer a Second Chance?📈 What happened since April?
After the sharp low in early April, Total3 began to recover steadily.
Toward the end of the month, it broke above the falling trendline that had been holding since January — a key technical shift.
This triggered a strong recovery rally, pushing total altcoin capitali
See all ideas
Summarizing what the indicators are suggesting.
Oscillators
Neutral
SellBuy
Strong sellStrong buy
Strong sellSellNeutralBuyStrong buy
Oscillators
Neutral
SellBuy
Strong sellStrong buy
Strong sellSellNeutralBuyStrong buy
Summary
Neutral
SellBuy
Strong sellStrong buy
Strong sellSellNeutralBuyStrong buy
Summary
Neutral
SellBuy
Strong sellStrong buy
Strong sellSellNeutralBuyStrong buy
Summary
Neutral
SellBuy
Strong sellStrong buy
Strong sellSellNeutralBuyStrong buy
Moving Averages
Neutral
SellBuy
Strong sellStrong buy
Strong sellSellNeutralBuyStrong buy
Moving Averages
Neutral
SellBuy
Strong sellStrong buy
Strong sellSellNeutralBuyStrong buy
Displays a symbol's price movements over previous years to identify recurring trends.