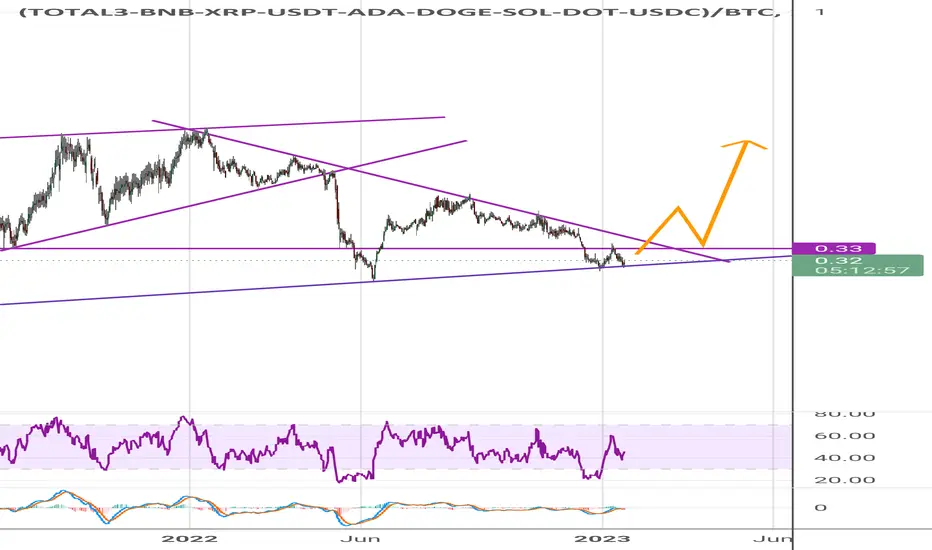
You better be Bullish on ALTS!Look at this beautiful chart!
Double bottom on small ALTS dominance.
Small Altcoins will rocket from here!
TOTAL3 trade ideas

TOTAL3 Market Cap ( Exclude BTC & ETH )TOTAL3 is pretty well ALL ALT COINS but does include BNB and al its BNB Chain coins.......(maybe time to NOT call BNB an ALT anymore but thats another convo )
This Daily chart shows us how PA has been stuck in a descending channel since around May '22 and how, repeatably, PA has hit Top trendline and been rejected.
And here we are again
Shorter Acting StochRSI is oversold so may offer some support but over all, MACD ( longer MA) is above 0 but not yet Overbought, so, should fundamentals come in with Good News, we have the ability to lift through that line of resistance.
A descending channel has a high chance of breaking trend, the longer it stays in it......but it replies on fundimentals and investment to make that happen.
There is a strong chance, Markets may well just wait now till the FED in the USA ( A Group of PRIVATE Bankers) decide how they are going to approach the issue of interest Rates.
The very idea of Crypto becoming a World wide financial service will get rid of this "Centralised Financial model" where One group of people can control Everyone else.
But that another story, meanwhile, Take care, have a plan and act upon it....PA may well Drop before it goes up again,

2023 Crypto Echo Bubble - sh*tcoin edition July 2021 to November 2021 rally of Total3 overlayed on current chart. Would be a perfect underside re-test. See 2023 Crypto Echo Bubble post on BTC fractal for more info.

ALTs need to break trendALTcoins have been bullish but...... cabt break trend the line shown in the chart ...i do believe when that happens ALTSeason begins

Crypto Market CapLooks like the crypto market is about to bleed on last time before lots of money is going to get dumped in after it bottoms.
~186 Billion (a numerical version of phi, the golden ratio, the 618) will be where it bottoms.
Get your USDT, Cash, USDC, ect ready. Looks like January 18-25 or so.
If there is any chart you'd like to see me calculate. Send a message and i'll pop it out for you.

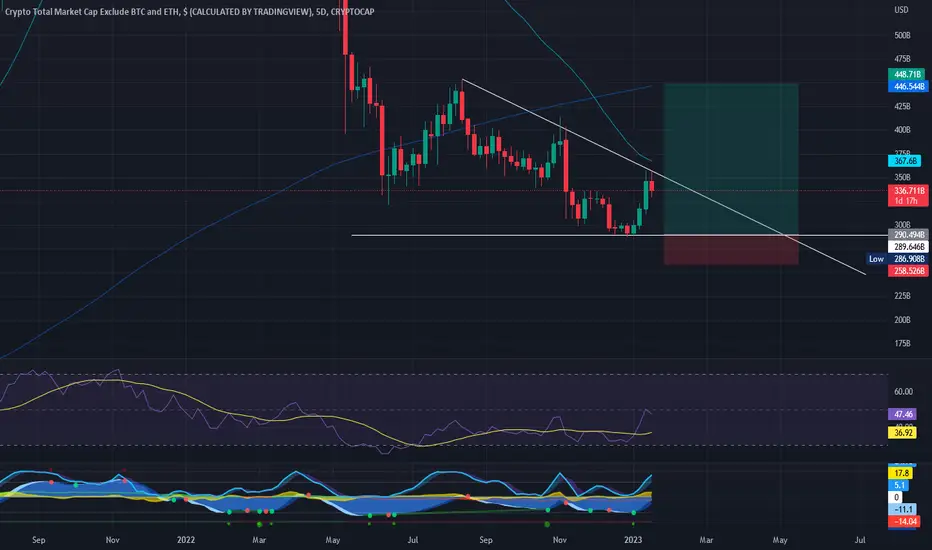
TOTAL 3 Ex BTC & ETH - CautionI see a lot of people jumping up and down about ATLS running but this chart shows a level of caution should remain
That 200 SMA has rejected PA harsly before and may well do so again - However, on the 4 hour chart, PA is being supported well by the 50
But, may not be enough....
Once PA gets through this 200, than I am all in
Untill then, please remain cautious

Small ALTS dominance about to go UP We've created a double/triple bottom on the small ALTS dominance.
In my opinion, small ALTS will start outperforming Bitcoin in the coming weeks, months.
WARNING. I am a altcoin bull! I am biased!
possible long after a retrace on T3This is the crypto market cap minus btc and eth.
A nice invalidation level, you cant trade this directly, but can use it as a guide to know whether alt coins will run
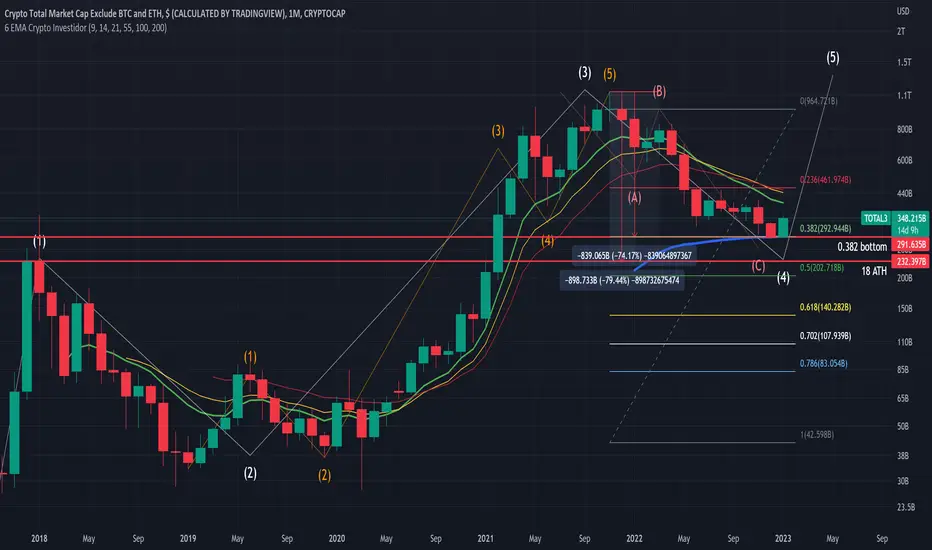
#Altcoins Wave 5 | #ALTCOIN CYCLEWave 5 : ALTCOIN CYCLE
White EW:
-Macro Wave 4 has hit the 0.382FIB
-Macro Wave 5 is forming.
To the Moon!
That is all.
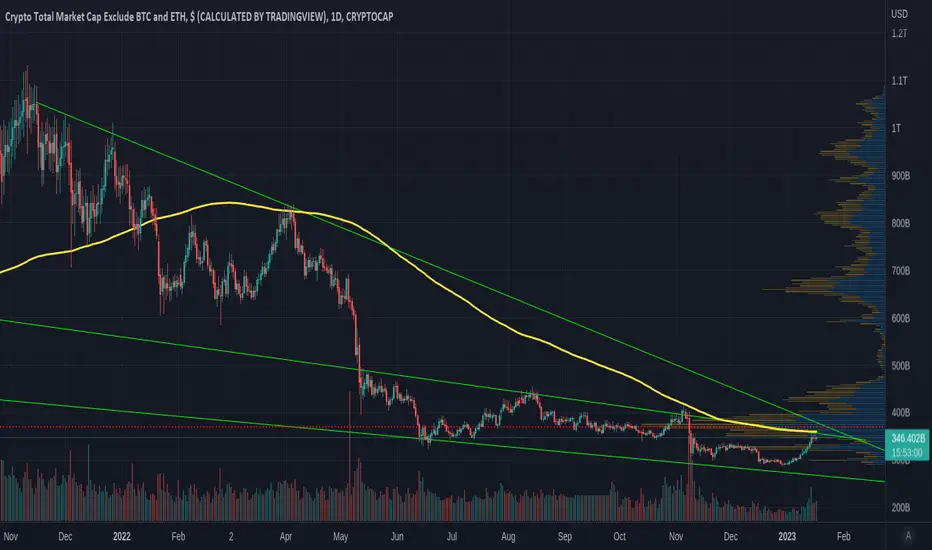
TOTAL3 ( ex BTC & ETH) Crypto Market CapPA coming under pressure here and is bumping into the 200 SMA for first time since April '22
It is also running along upper trendline of long term channel AND at same time, now hitting the longer term resistance from Off ATH
This is a crucial time for ALTS
They have already begun a slight pul back in Markets while BTC PA appears to be hanging on for now.
🔥 Altcoins Can Fall MUCH Further: Be Careful!As seen on the chart, the total altcoin market cap has been steadily falling and making new lows while BTC and ETH are still trading above their respective bear market lows.
Last cycle the total altcoin market cap fell a whopping 92% from the top. If the altcoin were to fall that same percentage during the current bear market it would indicate that alts will fall another 69% on average.
Another way to track the relative weakness in altcoins would be to look at the Bitcoin Dominance. Check my most recent analysis on it below.
Whether alts will fall another 69% remains to be seen. The market is more mature than the previous cycle, plus there are arguably better alts on the market which people will want to keep buying. Nevertheless, I think we can safely assume that the current ~75% decline from the top is not going to be enough.
How far do you think that alts can still fall? Have we bottomed? Share your thoughts🙏.

Total 3 - I think Altcoins havae bottomed!!!Giant wedge from the top, we just hit the bottom of it, I think altcoins are about to rip faces along with the rest of the markets. Hard to believe now in the depths of the bear market but the best thing to do is to just play the charts. Still need confirmation but I'm getting excited.

TOTAL 3 with thought process of bullish and bearish ideasTOTAL 3 need a support bounce to help the ALT coins
if it breaks below 307 it will be very bad for the ALT coins
what we really need is the price action to get a
support bounce ( bullish retest ) of 336
Price Prediction
not financial advice
this is for entertainment purposes only
always DYOR

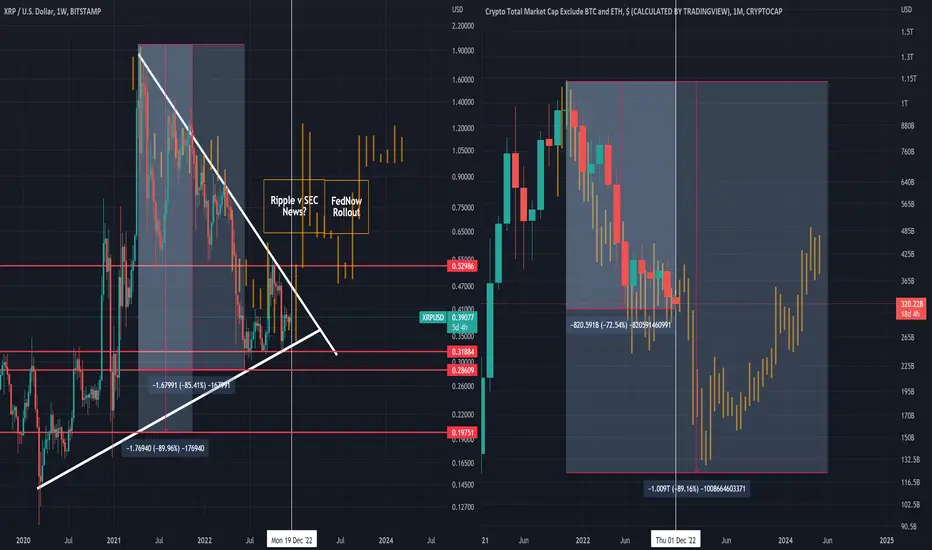
#XRP 89% Draw Down Narrative #XRPUSDThe 2016 XRP Draw Down was 89%. Will history repeat in 2023?
I compared the TOTAL3 (altcoins) 2018 Fractal and nearly nailed out the full 89% Draw Down ALTCOIN market.
There might be a small pump before the HUGE dump to the full 89% Draw Down.
Altcoin Rally:
- Potentially Ripple SEC news comes out?
- FedNOW (SkyNET) Goes online Mar 2023 and everything crashes down to 89% mark?
* www.federalreserve.gov
Will XRP hit the Double Bottom?
Altcoins look like s*Clearly confirmed r/s flip here. Below 302B its full send down
back flip r/s and it might buy bulls some time
Hold my beer pls
----
No financial advice, do your own research, don't be stupid

Total3Total 3 Market Cap is approaching the Phase E of Wyckoff Distribution where the price will soon break the support and continue the downtrend.
The Target is $150b which can be seen as obvious support on the weekly.
This is the beginning of the 50-60% drop most alt coins will experience.

Total 3 3day chart is bullishI have marked out the last couple of times that the MCB showed bullish divergence.
Is it alt-coin season? This graph says so!

Altcoins about to get #rekt
Same as for Bitcoin but way more severe.
Started 5th wave down with wave3 triggering 2.618 => wave5 will hit around 4.236 (intermediate, orange count).
Locally same structure expected to hit that level w3 on 2.618 and w5 on 4.236
Also locally just now confirmed previous support as resistance.
Fasten your seatbelts!
Bargains ahead!
Hold my beer pls
----
No financial advice, do your own research, don't be stupid
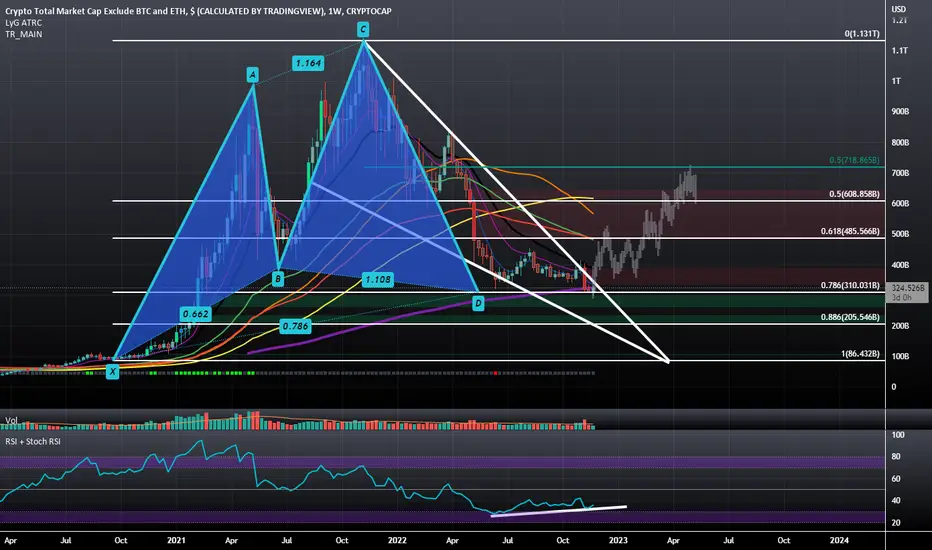
TOTAL3 Bullish Cypher Remains Strong Despite Bearish PushbacksDespite the recent Bearish pullbacks, the news driven dumps, and coin collapses (particularly among coins that have heavy unstable associations with DeFi); the Total 3 Market Cap itself has remained stable above the 78.6% Retrace Cypher PCZ and above the 200 Week Moving Average.
I think we will see marketcap flow out of the DeFi space and into coins like Litecoin, Dogecoin, and XRP and that that will keep the Total 3 Marketcap afloat.
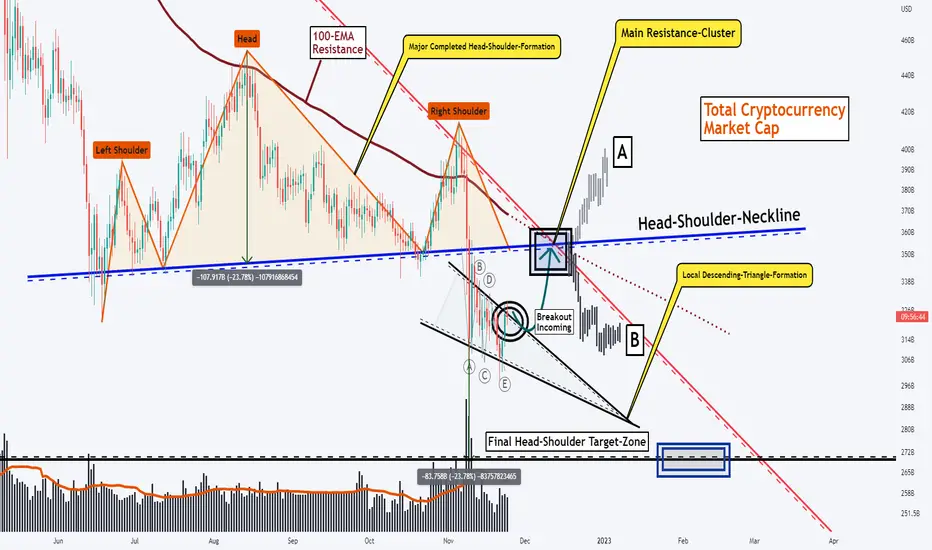
TOTAL CRYPTO-CAP, Retest of the Primary Formation Indicated!Hello Community,
Welcome to my new analysis of the Total Cryptocurrency Market-Cap and where it is heading in the next time. Important to notice here with the Total Cryptocurrency Market-Cap is that the price action made a sharp dip towards the downside beginning just hours after the FTX collapse has been officially announced as I already pointed out in my recent Bitcoin analysis. To take this into the current context it is necessary to realize that this dip may not happen if the FTX collapse did not happen at this point, therefore this sharp bearish wave can be considered as an unnatural movement nevertheless it has completed a crucial formation and this is the important point in this whole structure. As the Total Cryptocurrency Market-Cap completed this massive head-shoulder-formation this gives the whole movement a bearish edge also from the technical perspective.
Now it is necessary to wage the possibilities and see where the market is likely to move and in this case, the market is now forming this interesting local descending triangle formation which is likely to complete as it is marked in my chart, once this formation has been completed it will be the setup for the market to continue and show up with a volatility relief rally till further levels are being tested. In this case, once the formation has been completed the market is likely to move on into the head and shoulder decisive range as seen in my chart, from there on two directions are possible, firstly the market manages to move into this range with a very strong bullish movement giving the indication for a breakthrough above the resistance and declaring the formation as a fake head shoulder formation and the second direction will be a pullback from the resistance from where on the price action is likely to reach out the final targets of the head shoulder formation, currently, the second scenario has a higher possibility nonetheless this can change when the market shows up with a considerable bullish strength.
In this manner, thank you everybody for watching, Let's move forward together.
"Diligence is the cornerstone of good fortune."
The information provided is only educational and should not be used to take action in the markets.
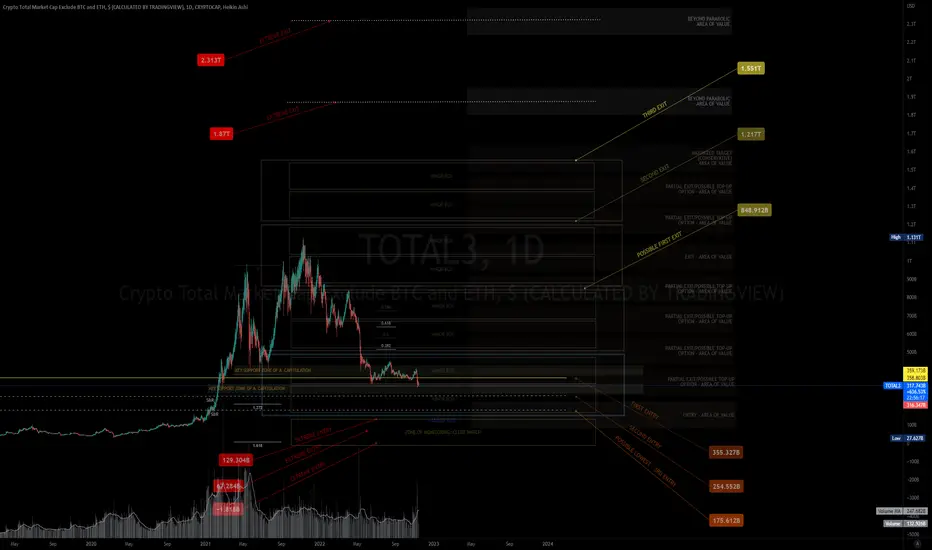
MY MINIMALIST ANALYSIS FOR TOTAL 3 ALL CRYPTOSTOTAL 3 - ALL CRYPTO CURRENCIES
On a DAILY Chart
LONG POSITION -MOMENTUM STRATEGY - SWING
11.14.22
0845H +8 SINGAPORE
Disclaimer:
The findings of the following analysis are the sole opinions of the publisher of this idea and should not be taken as a piece of investment advice.
My Published Ideas are not 100% Accurate. There are many factors at a given time that can change the forecast.
ALERT:
Forecast Entries for a BULL SWING.
Based on VITAL SIGNS ( RSI , STOCH , VOL., MA VOL.) RSI is EXTREMELY OVERSOLD , BUT we still have to see if it breaks the next or reaches the AREA OF CAPITULATION
We still have roo for our extreme entries as the war in Ukraine continues and the economy recovering from the pandemic
In my oppinion and what the market is doing, Smart money wants a REBOOT of 2018 and all is possible for the forecasted entries based on numbers and the character of the market now. Let us see how price action reacts on a DAILY chart .
A lot of HODLING happening which gives it the strength to go further down in small increments.
The BENTO BOXES are close to a hundred percent in forecasting turning points.
Hoping that this BENTO BOX CHART ANALYSIS will efficiently help you with your DYOR as we Enter a NEW SWING CYCLE for LONG positions, either short, mid, or long term.
INSTRUCTIONS:
HOW TO USE THIS MINIMALIST CHART a.k.a (Bento Box)
"Follow the white rabbit!"
Just Follow the TOPS and BOTTOMS of the BOXES as a GUIDE to where the MARKET will take you.
If it cannot break a TOP or BOTTOM of a BOX, It signifies a reversal.
TARGET ZONE IDENTIFICATION:
The LARGE BOXES (Tops and Bottoms) are MAJOR turning points that will occur sometime in the future. While the SMALL BOXES (Tops and Bottoms) are MINOR turning points.
These can be entries to a BUY/ SELL POSITION, EXIT/PARTIAL EXIT/TOP-UP AREAS, as well as Support and resistance levels
Also includes MAXIMUM TARGET EXIT AREA OF VALUE - CONSERVATIVE (If price action conditions are right at that given moment.)
NOTE:
1. That PRICE TARGETS for ENTRY and EXITS are DYNAMIC and can CHANGE from time to time.
2. Created using data on a MONTHLY, WEEKLY & DAILY Analysis of a MARKET'S CHARACTER.
3. My BENTO BOXES are designed for SWING TRADES at the LOWEST or START of a SWING CYCLE.
4. At times I will include a WAY BEYOND PARABOLIC PRICE TARGET, depending on The Character of the Market (CRYPTOS ONLY).
5. DYOR for your Fundamentals, Volume , Chart Patterns, Candlestick Math, FIB COILS ( ABC ), Price Action, FIB LEVELS, Market Dynamics, AB=CD Pattern especially institutional and retailer trading psychology .
Wishing you all The Best Trades and Thank you all for your Appreciation and Support of My Work.
Much thanks to My 3 Mentors. They are so much of a Blessing that I also wish to share my knowledge.
Vive Le Autist!
TOTAL3 -Altcoins Mega Falling Wedge Ready To begin a bull marketLet us analyze the total 3 chart - which measure only altcoins excluding Ethereum . It seems to have possibly bottomed at around the 330B USD level and forming this gigantic falling wedge bullish pattern. The Target for this pattern breakout will be at least 10x of the market cap of altcoins from now.
This is an incredibly long term chart and might need years to play out but make no mistake crypto is here to stay and this pattern is still very much valid. Invalidation would be Until we see a strong breakdown of support and confirming the current support levels around 330B as resistance

