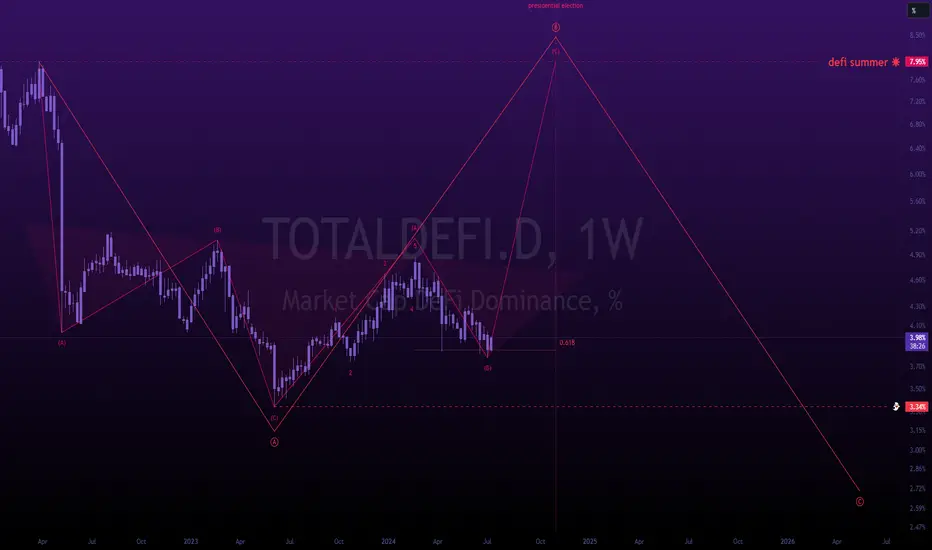
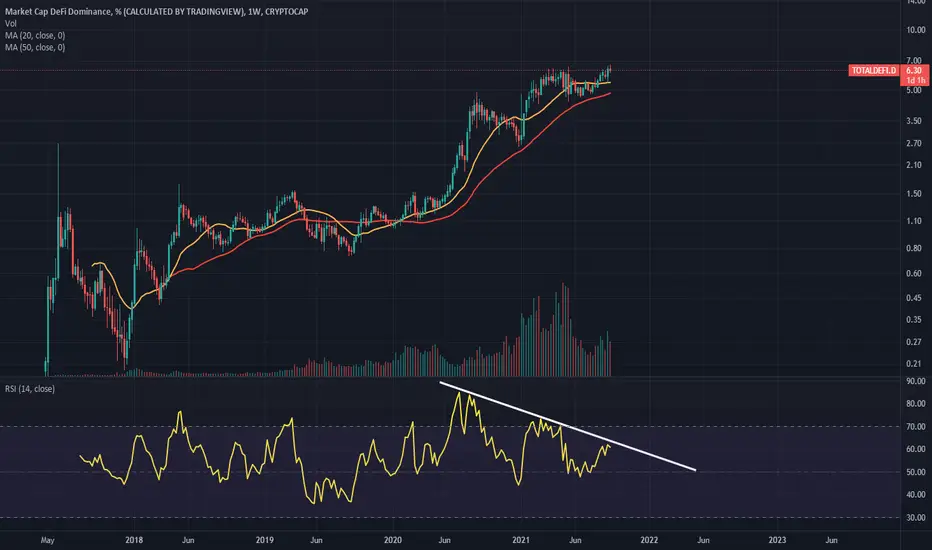
defi summerthis chart portrays the total market cap of the defi dominance.
it's currently sitting at 3.98% with an inverse h&s on a weekly timeframe.
my projected upside target sits at the ath of about 7.95%
---
the last meaningful defi summer we experienced was in 2020.
☀
let's make this one count.
---
i'm projecting this defi market cap dominance to hit 8% into the presidential election where a soft top will likely be created.
i've shared a lot of plays over the last few months with our members, and we're just chilling into november.
---
tldr; hodl into a 3-4 month long alt season, and tp into the presidential election.
TOTALDEFI.D trade ideas
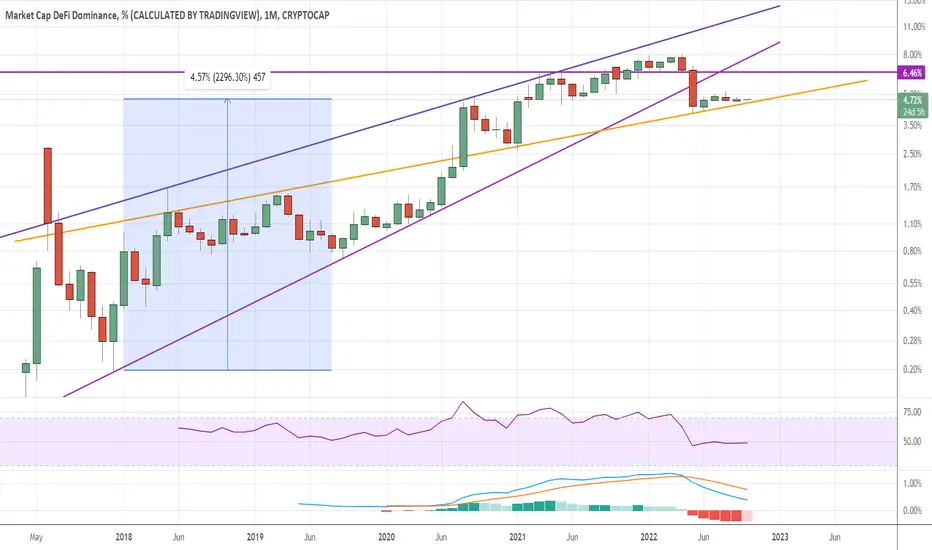
Crypto total cap DeFI.D - % of dominance of DeFiLogarithm. Time frame 1 week. Chart. This is the crypto total cap DeFI.D
This is the percentage of dominance of DeFi projects in relation to the entire market. This is a very important indicator for understanding the pump or dump of this asset class. That is, to understand when there will be an alt-season on this group of assets, which will "overtake the market" at a moment in time.
Below is a basic type of asset group grading on tradingview that makes sense to monitor and use as true market indicators. This gives insight into potential asset group pump/dump or market phase shifts. These types of idea are done once and for many years. Because relevance is never lost if you understand the meaning
1) Market capitalization of different assets:
Crypto total cap - total market capitalization of the market in $
Crypto total cap 2 - market capitalization excluding BTC in $
Crypto total cap 3 - market capitalization excluding BTC and ETH in $
2) DeFI projects:
Crypto total cap DeFI - DeFI cryptocurrency capitalization in $
Crypto total cap DeFI.D - capitalization in % terms of DeFi dominance to the market
3) Major Stablecoins:
Market cap USDT - capitalization of USDT in $
Market cap USDT % - capitalization in % expression of dominance to the whole market
Market cap USDC - capitalization of USDC in $
Market cap USDC % - capitalization in % dominance terms to the whole market.
4) Bitcoin
Market cap BTC $ - capitalization of BTC in $
Market cap BTC dominannce % - capitalization in % dominance expression to the whole market.
5) Ethereum
Market cap ETH $ - capitalization of ETH in $
Market cap ETH dominannce % - capitalization in % dominance expression to the whole market.
6) USD index (DXY)
US Dollar cyrrency index - this is the most important indicator of the pump/dump markets as a whole (more globally, not just crypto).
Market cycles are humans behavior, what is displayed on the price chart and which lends itself to cyclical thinking/actions, which shapes the market direction. .
Below I will publish similar ideas - indicators that I have published previously for several years and that for obvious reasons remain relevant. I will also make analysis of new groups of assets by capitalization from the list, which have not been analyzed before. But, I will do all the analysis of instruments only when I have free time.

DEFI dominance going up!Thanks to the XRP trial, altcoins will most likely do very well for the next couple months.
DEFI coins are poised to pump up quite a bit!
On the chart you see the DEFI coins dominance. We've just bounced on the trendline. Very bullish!
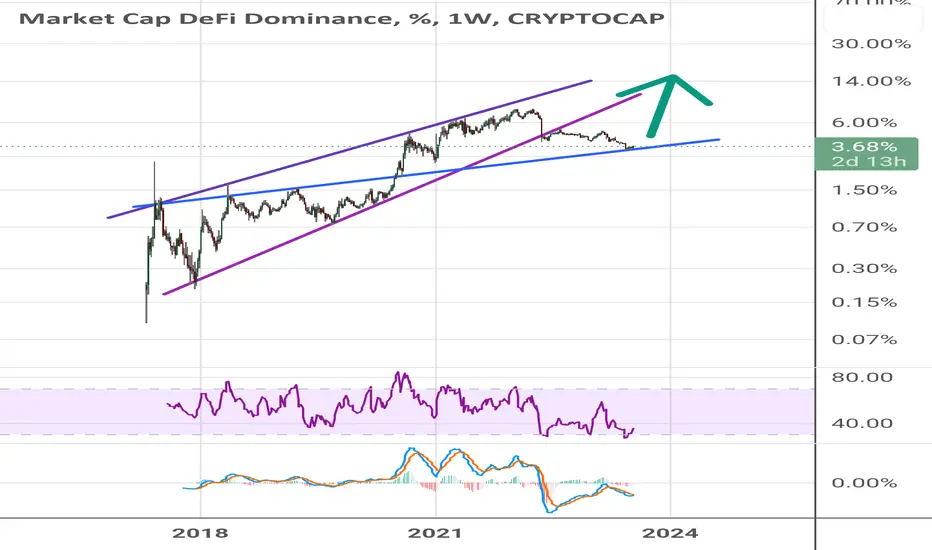
DEFI Marketcap Dominance up 23x since 2018 - From 5% to 12% ?If you invested in DEFI early 2018, you made a shit ton of money.
Dominance has 23x, 40x at the top.
We are currently sitting at almost 5% dominance. The trend is UP!
Can we go from 5% to 12%? Almost a 3x in dominance?
That would be a MAJOR ALTCOIN rally!
I'm optimistic!
goodbye DeFi?We're in a bear flag right now, possible target ~2,7% (down from 7,95% high on April 2nd)
- Benayman
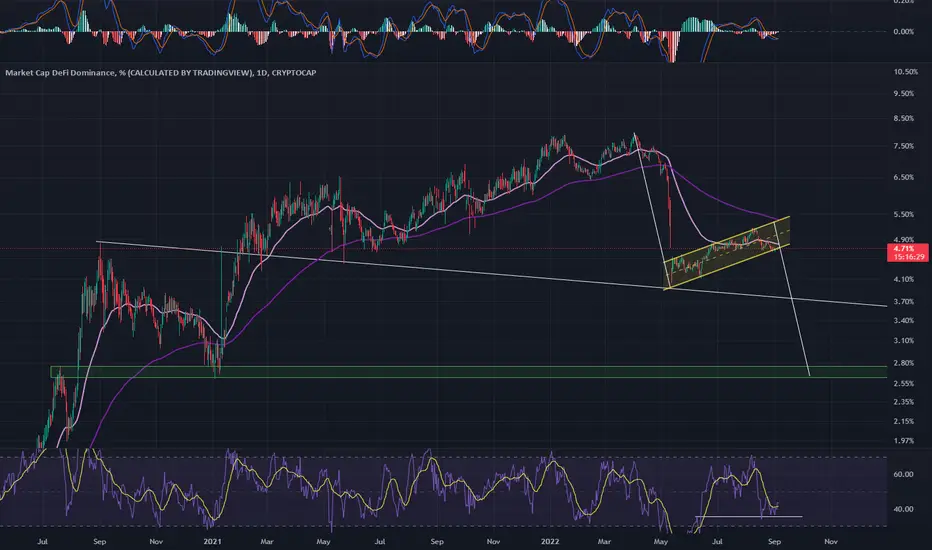
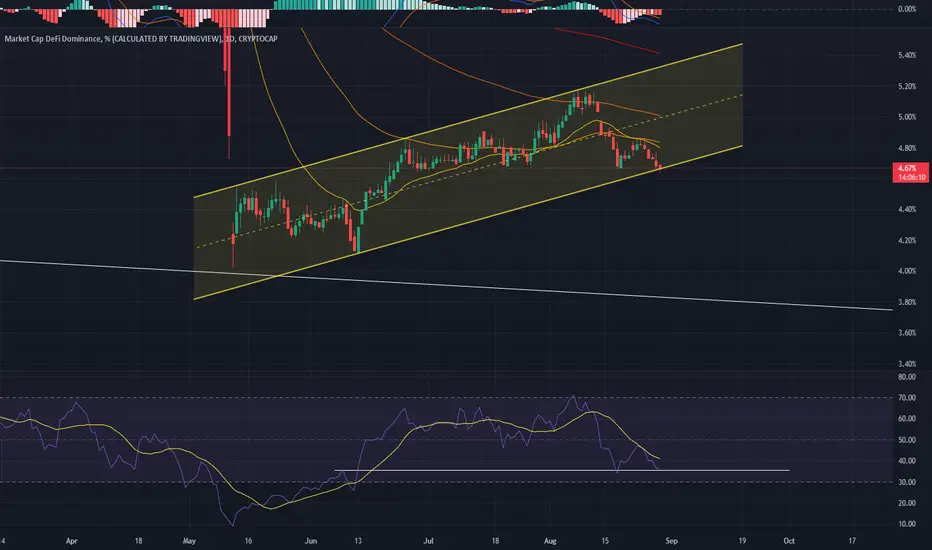
DeFi about to drop hard?Defin about to drop hard?
Keep an eye on RSI- and Channel-support!
- Benayman
TotalDEFI.DTotalDEFI.D Analysis
Time Frame 1M, 1W, 3D
Support and Resistance
-----------------------------------------
In Chart

TOTALDEFI Ready to moon looking at weekly RSIWe have a triangle on weekly RSI. Moon mission engaged!

Is BTC.D about to form a new low?I'm assuming the chart self explanatory. If not, ask away. Otherwise, hope to hear your thoughts. Thanks!

DeFi dominance weekly bearish divergenceAs we can see, there is bearish div on weekly defi.d chart. We need to break this resistance or down it goes...
DEFI dominance going to 8% by year endCheck out this new indicator on TradingView!
DEFI market cap dominance!
It includes coins like AAVE, UNI, SNX etc...
It's been consistently increasing these last months.
It's going to 8% by year end.
Very bullish on DEFI!

DEFI dominance rising in a rising wedgeAlthough this patter is a bearish one note that this is a weekly chart and I expect a rising of DeFi dominance at least until the first third of October. This means overall DeFi will keep pumping. I hope you own some of them!
Thanks to Blockwolf for sharing with me this DeFi domindance ticker which I didn't know!
