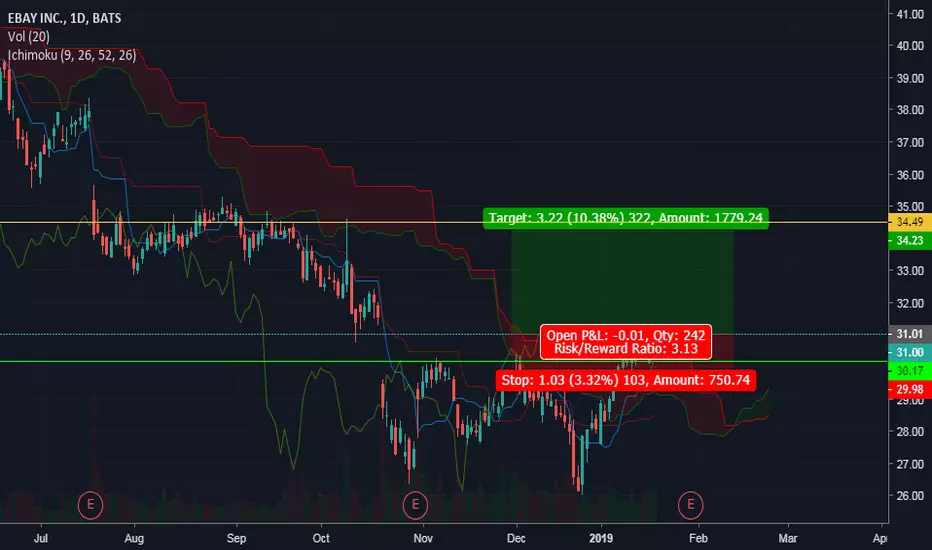
EBAY ichimoku signalIchimoku singal
Conversion over base
Bullish cloud
Candle closed above cloud
Lagging span closed above cloud
Trend continuation signals
Higher highs, higher low
double bottom
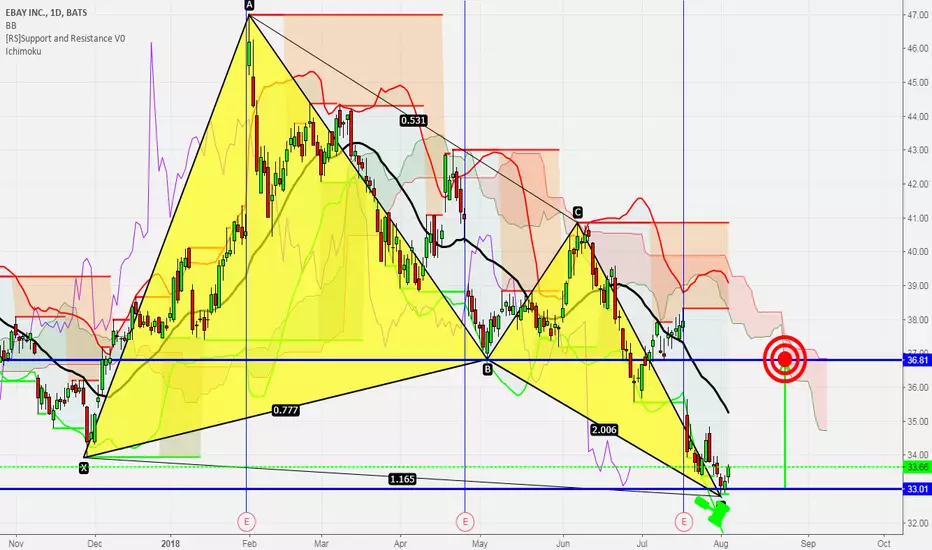
Support/Resistance
green previous support on daily
Yellow strong resistance on the daily (there's a couple of weaker resistance lines on the daily on the way up)
3:1 Risk/Reward
appreciate the feed back from the experienced guru's out there as this is the first analysis i'm sharing. i'm just a dumb boilermaker!
EBA trade ideas
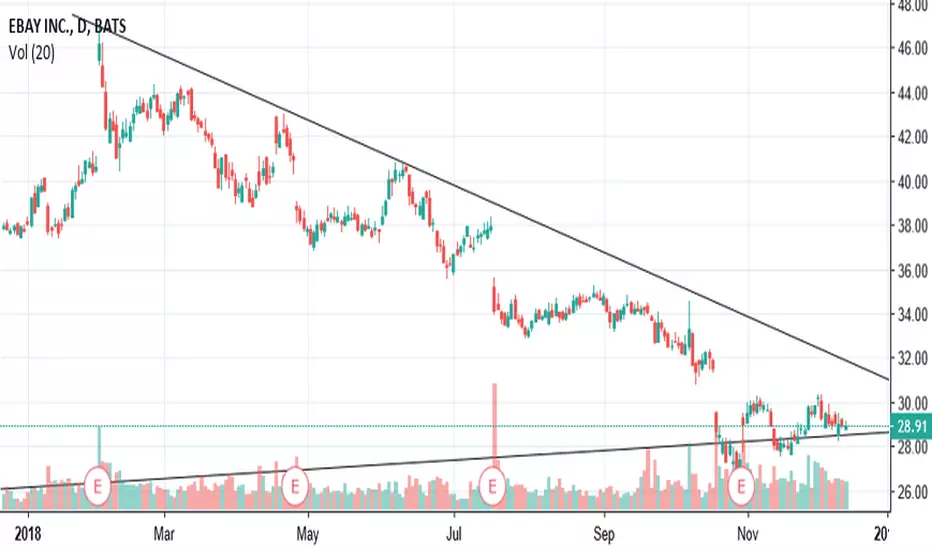
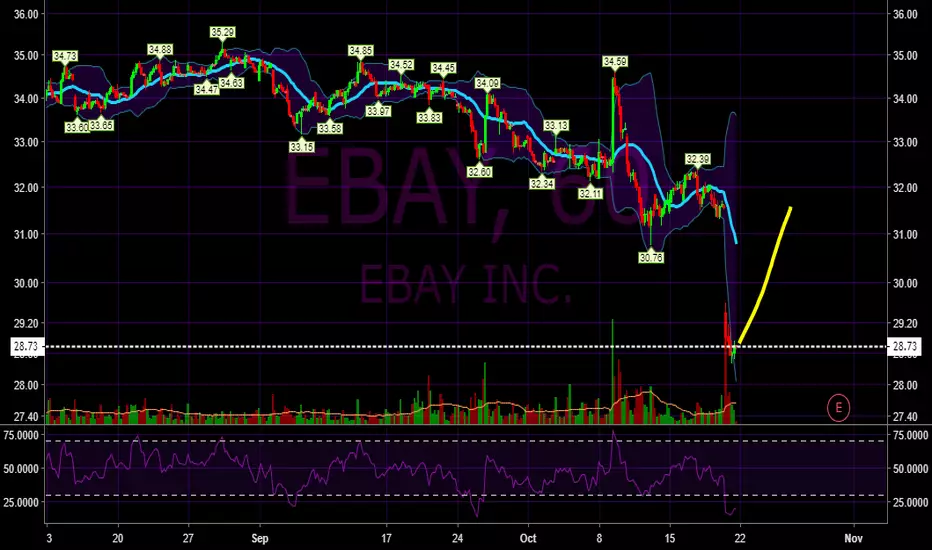
Ebay to Head Lower?From the looks of price action, Ebay has set us up with a good opportunity to sell this stock.
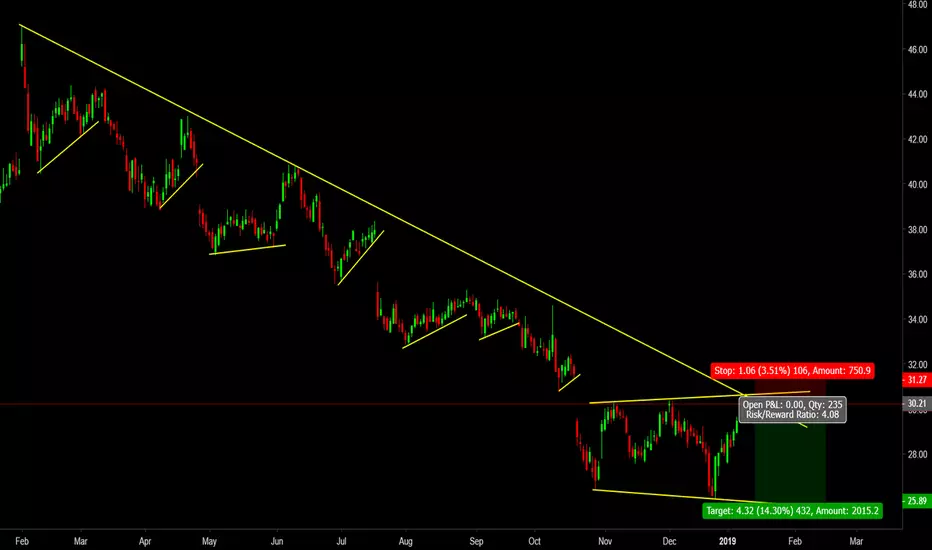
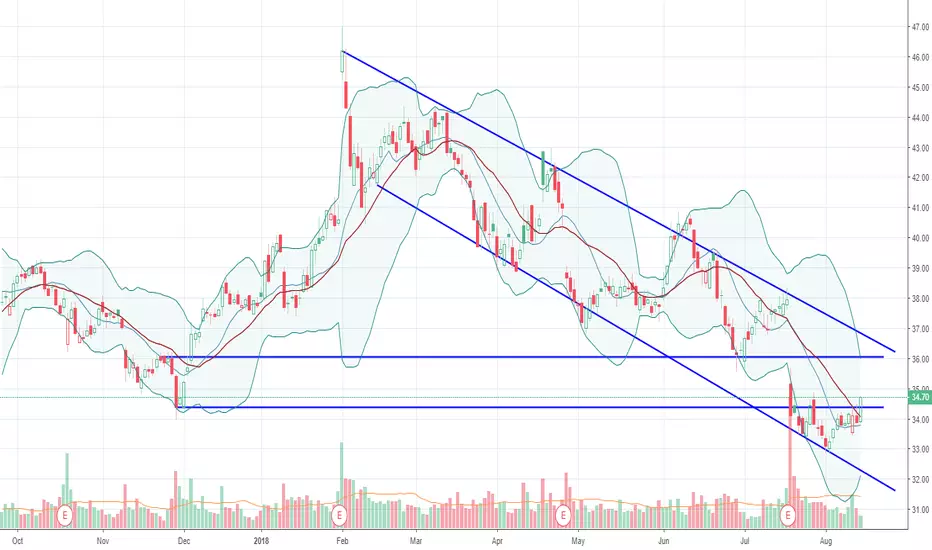
$EBAY Short below trendline and long above trendlineInteresting here, let's see which way it wants to run.
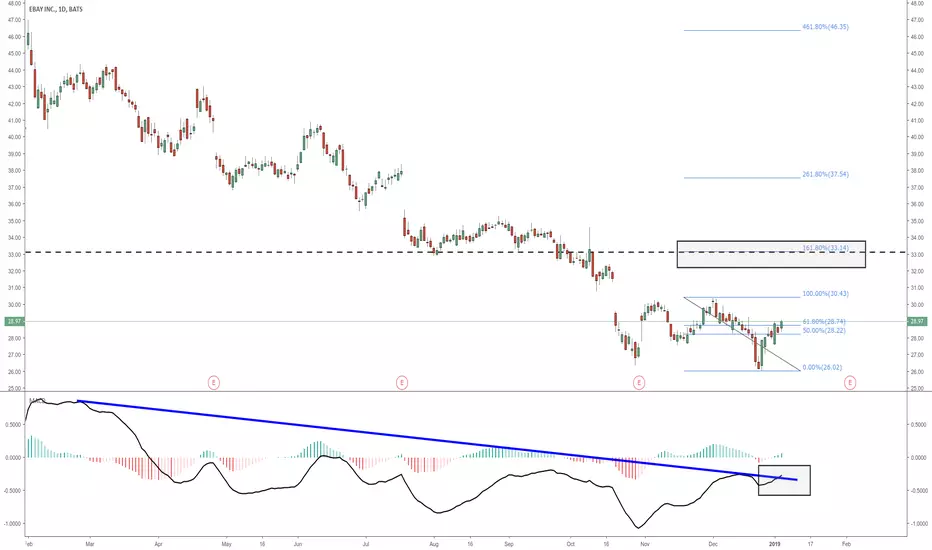
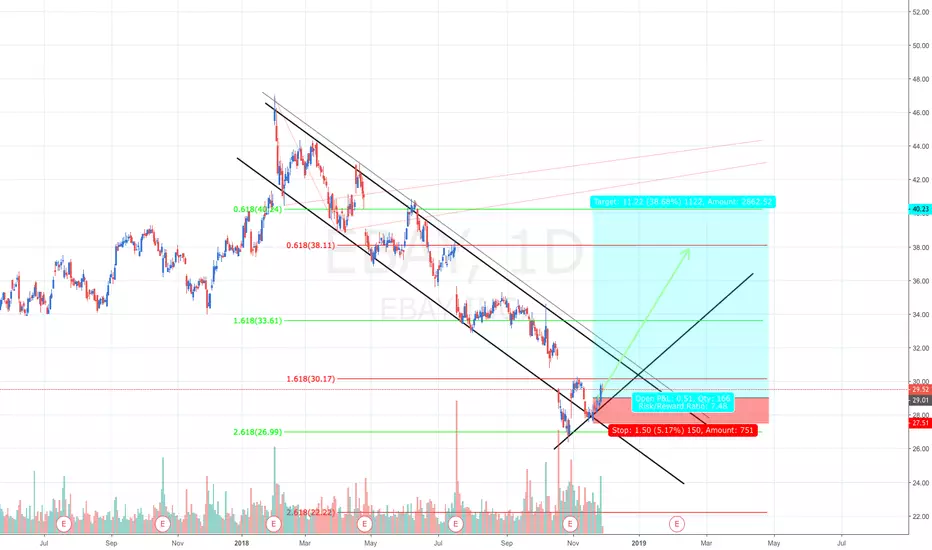
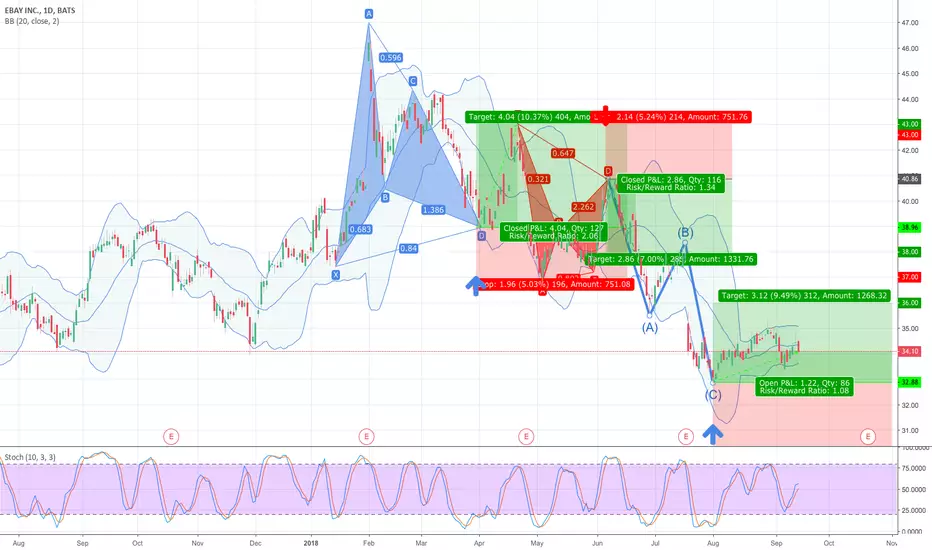
EBAY LongLong based of channels and fibs
My Entry: 29.00
Stop Loss: 27.50
PT: 40.23
Risk/Reward: 1:9
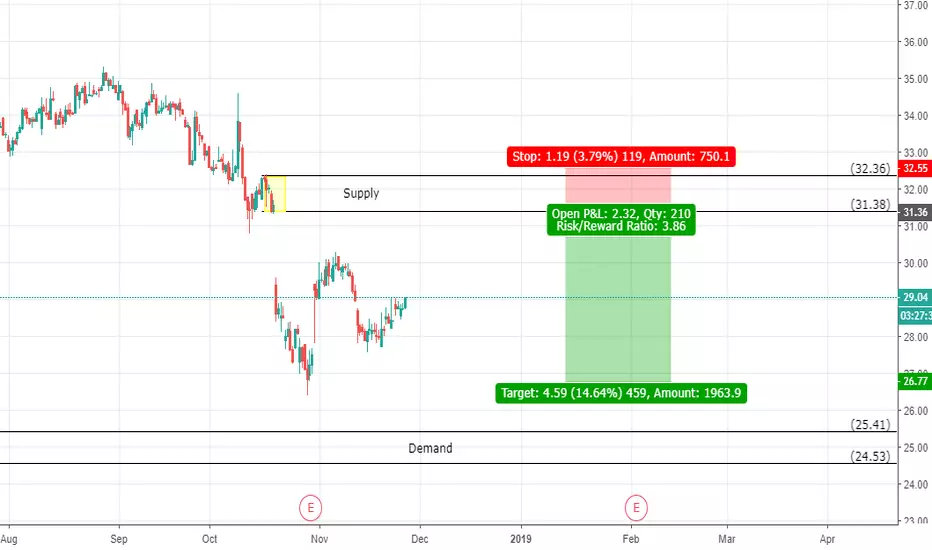
Ebay Stock SpeculationBigger picture suggests we are close to significant demand. As we move to the lower time frame we can see supply above. Looking to use the supply to take us down to demand to ultimately get long. For now we will focus on this intra-day level. Look forward to another post of this chart soon.
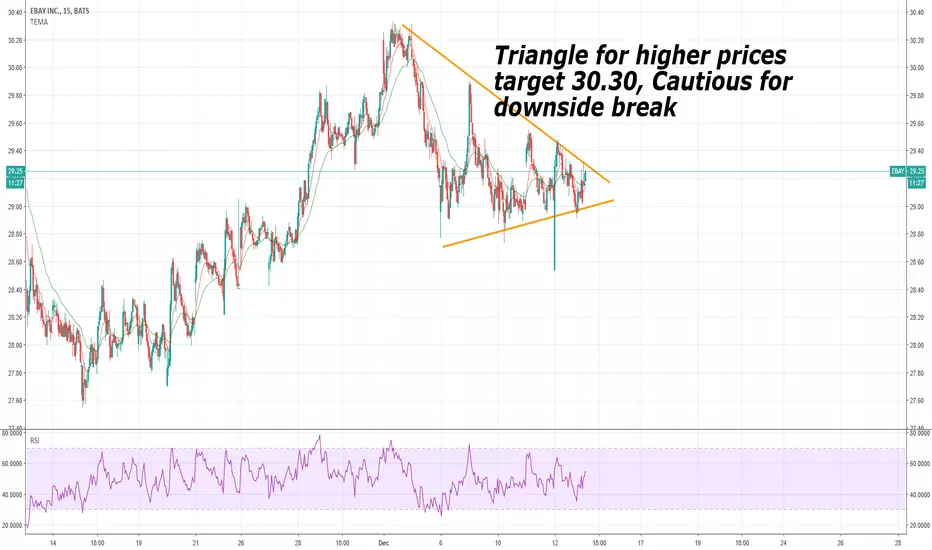
Bullish bounce forecast for eBayI think eBay will continue on its bullish trend very soon.
Let me know what you think in the comments.
Like the idea if you agree.
Follow me for more tips like this!
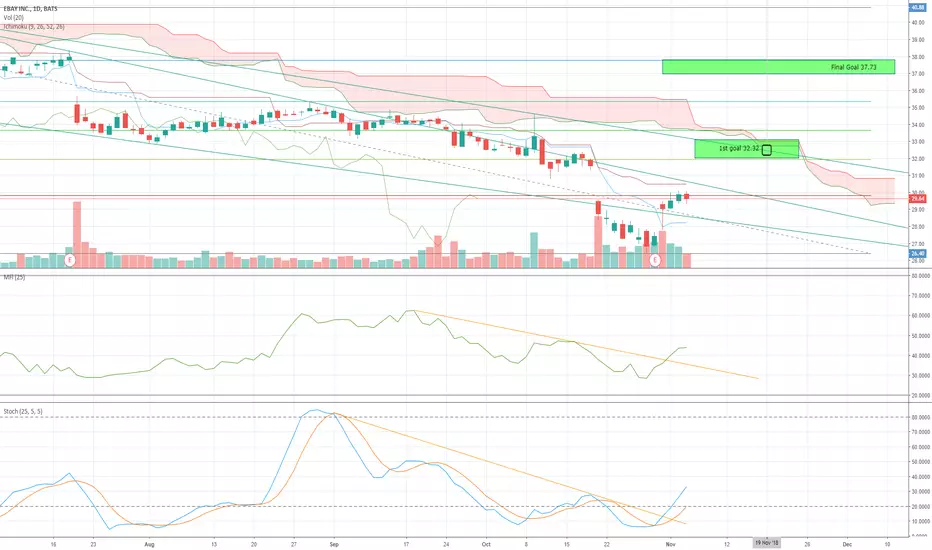
EBAY Daily chart now at 29.64 .. Suggested LONG targeting 32.32Suggested uptrend pattern after reach its new support bottom at 26.37 .. Share started new trend with aiming goals 32.32 then 37.73
Support; 28.79
Resistance: 30.8 then 32 - 34

Rebound on Mon/Tue?eBay will announce earnings on Tuesday, I tend to short it however seems a bit risky - there is a good chance it will jump back into the trend channel
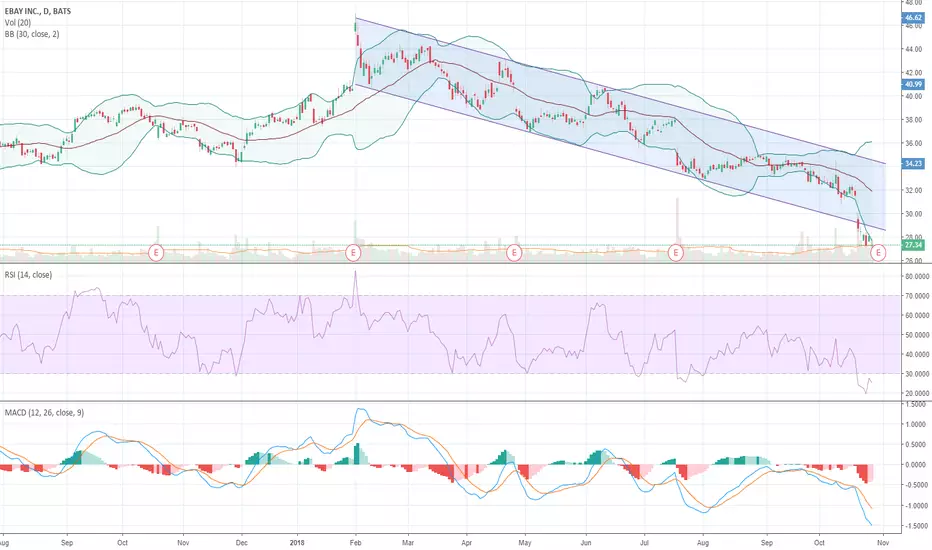
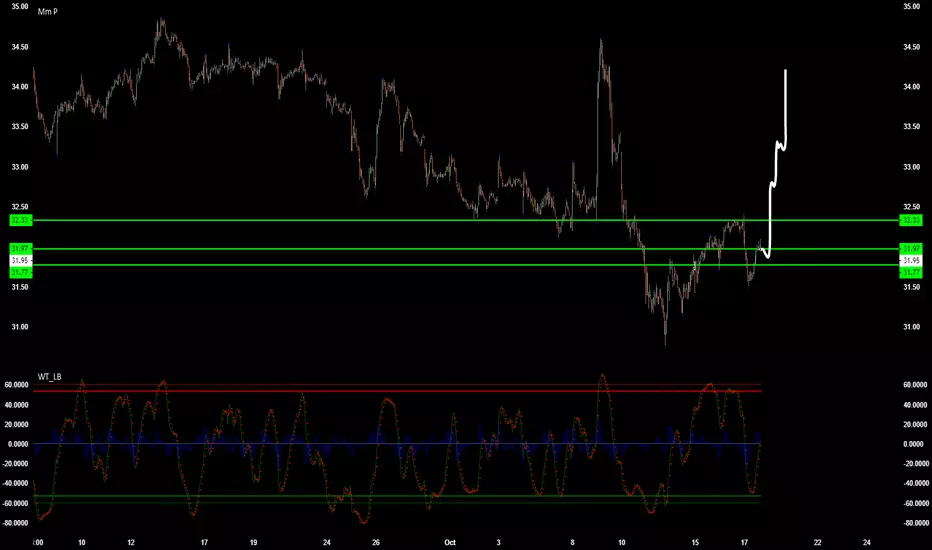
[EBAY] phase 4 -> Don't buy!The price is far away from 30MM, RSI is under so low and slope of 30MM is negative. Don't buy.


EBAY finally getting ready for bullish divergenceHi guys:
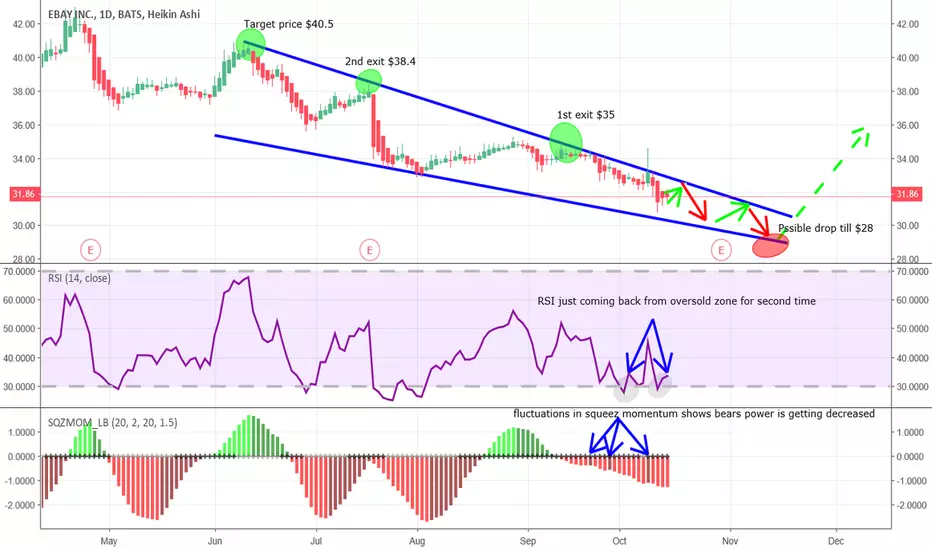
Since 11 June 18 the EBAY priceline is moving within a falling wedge but now it is going to break the resistance of wedge and bulls are going to take charge soon.
RSI went to oversold zone for second time now it moving back
Candles are almost at the end of wedge but there is some more cushion for pirceline to move down till $28
The squeeze momentum has fluctuated for 3rd time which is indicating that bears are loosing charge and bulls will take over soon
Profit possibility: 15 to 40 percent (depends on entry point)
Entry point: $28 - $32
1st exit: $35
2nd exit: $38.4
3rd exit and target price: $40.5
Best of luck and regards,
Atif Akbar (Moon333)


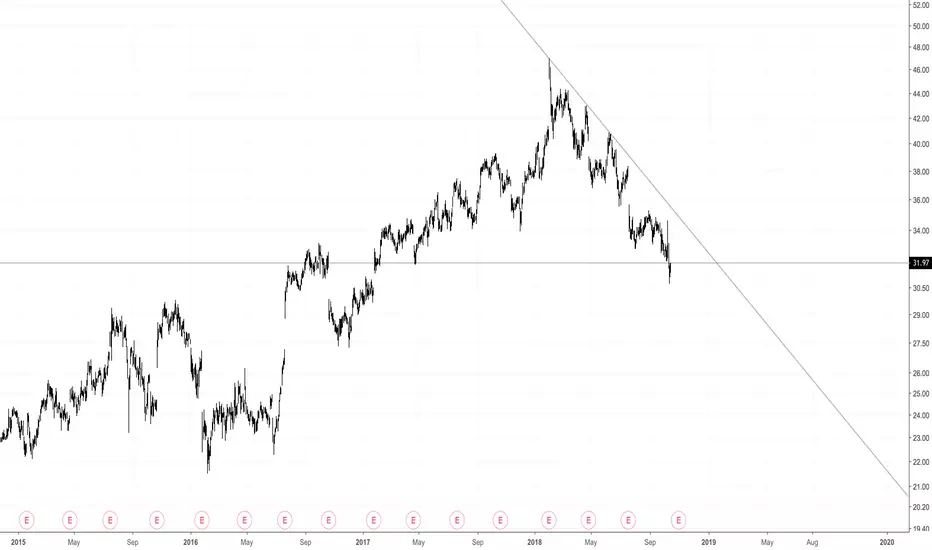
38.2% & POSSIBLE 61.8% Retracement LONG GWAVE.38.2% & POSSIBLE 61.8% Retracement LONG GWAVE.
FIB Retracement Percentage is calculated in a Higher Euclidean Dimension.
PLEASE ALWAYS WAIT FOR STOCHASTIC CONFIRMATION!!! THANKS
38.2% & POSSIBLE 61.8% Retracement LONG GWAVE38.2% & POSSIBLE 61.8% Retracement LONG GWAVE.
FIB Retracement Percentage is calculated in a Higher Euclidean Dimension.
PLEASE ALWAYS WAIT FOR STOCHASTIC CONFIRMATION!!! THANKS


EBAY - Time 2 Buy!!!Time to write a call credit spread and/or write covered call option, for an easy $4 profit very soon. Nice harmonic pattern, can't get any better.