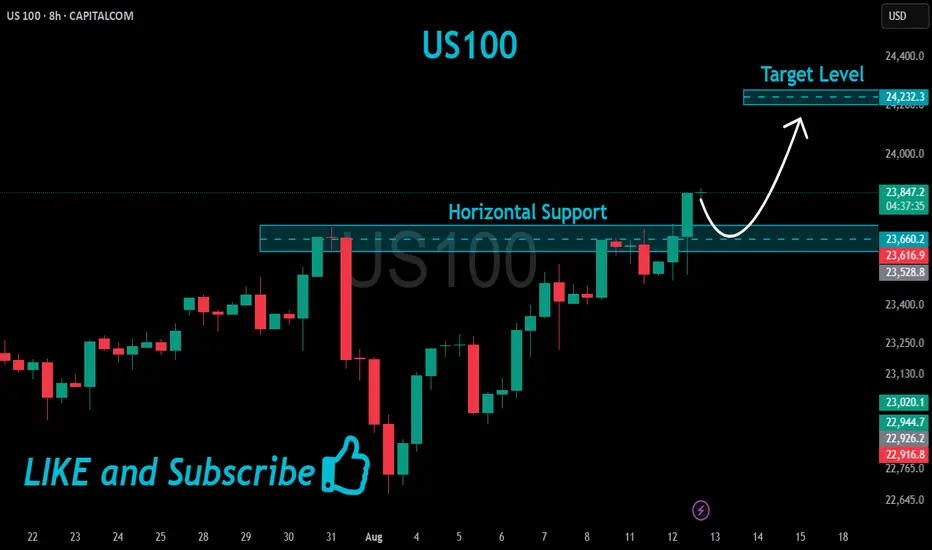
US100 Local Long!
HI,Traders !
#US100 made a retest
Of the horizontal support
Level of 23266.0 from where
We are already seeing a
Local bullish rebound so
We will be expecting a
Further bullish move up !
Comment and subscribe to help us grow !
USTECFU trade ideas

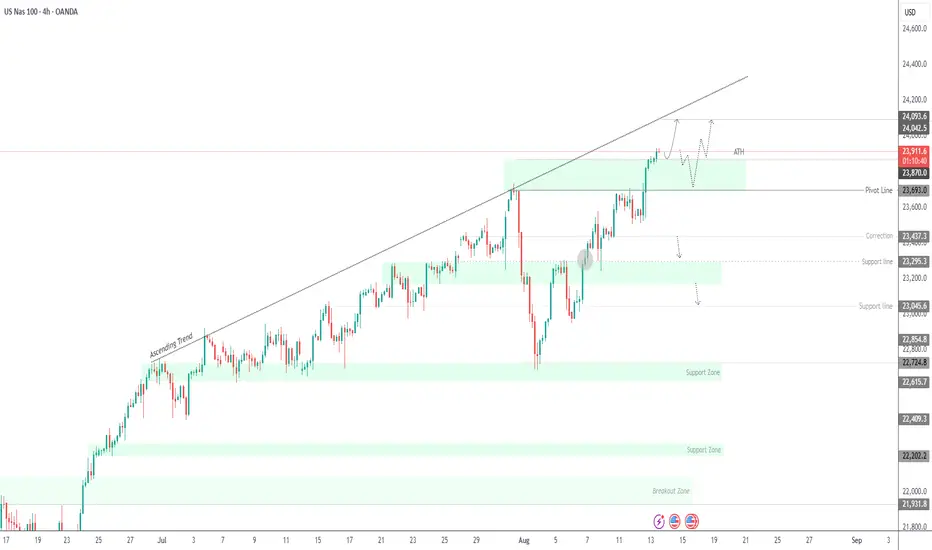
USNAS100 | Holding Above ATH – Key Pivot at 23870USNAS100 at Record Highs on Fed Rate Cut Hopes
Nasdaq indexes held at record highs on Wednesday, supported by growing confidence that the Federal Reserve could restart its monetary policy easing cycle next month.
Technical Outlook:
The price has stabilized in a bullish trend after breaking its all-time high, with a 4H candle closing above it on strong volume.
As long as it trades above 23870, the bullish trend remains intact toward 24090.
To turn bearish, the price would need to close at least 1H below 23870, targeting 23690.
Resistance: 24090, 24190
Support: 23690, 23430
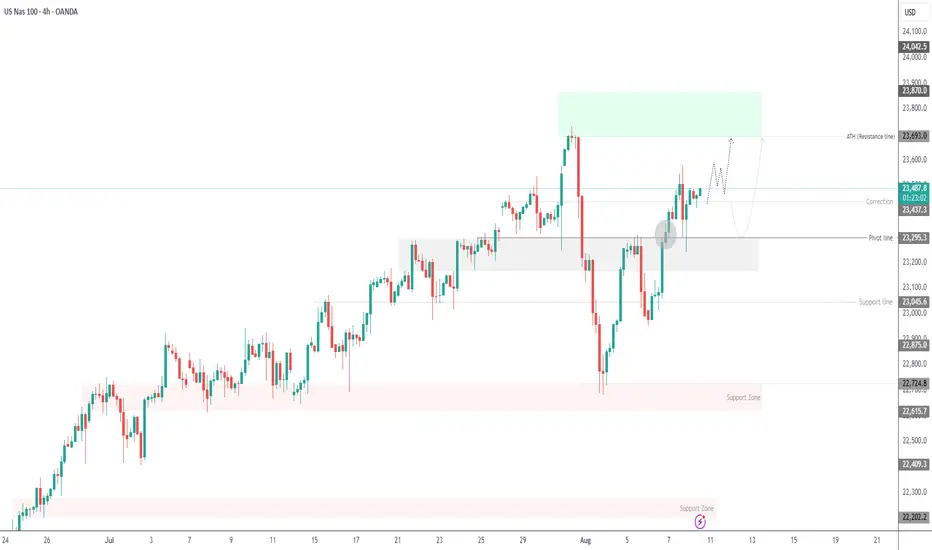
USNAS100 Volatile – Key Level at 23440 in FocusUSNAS100 – Market Overview
The indices market remains highly volatile following the latest developments regarding the Federal Reserve Chairman.
The situation remains tense, with the possibility of one rate cut this year still on the table.
Technical Outlook
Bullish Scenario:
Stability above 23440 will keep bullish momentum intact, targeting the All-Time High (ATH) at 23690, with further potential toward 23870.
Bearish Scenario:
A 1H close below 23430 would shift the bias to bearish, targeting 23295, and possibly lower.
Resistance: 23570 – 23690 – 23870
Support: 23295 – 23180 – 23045
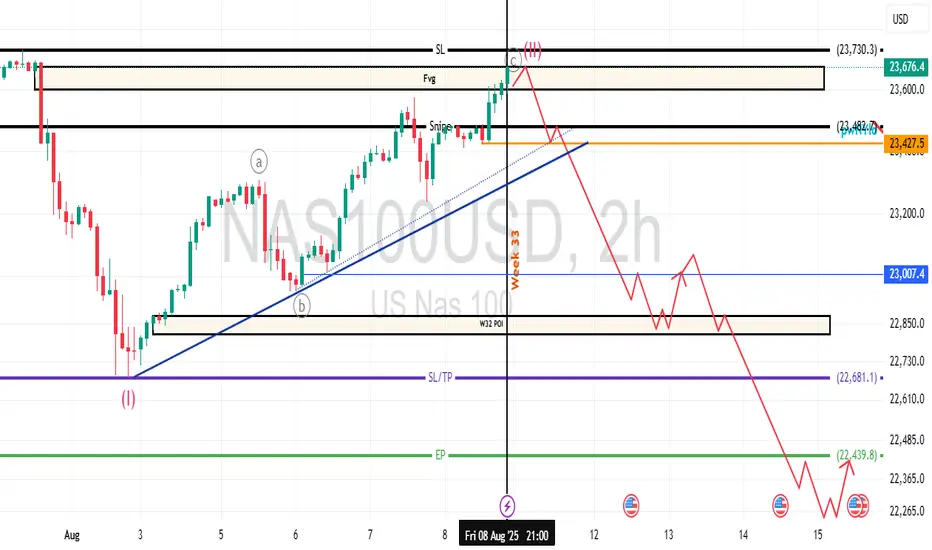
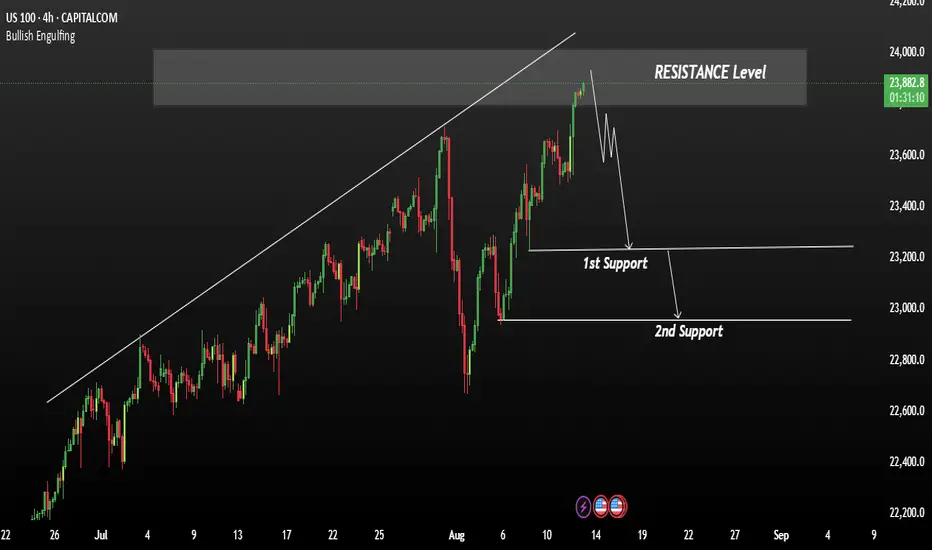
Nasdaq Week 33 Possible OutlookAre we ready to drop this coming week? Lookout for reversal/continuation pattern under smaller TF.
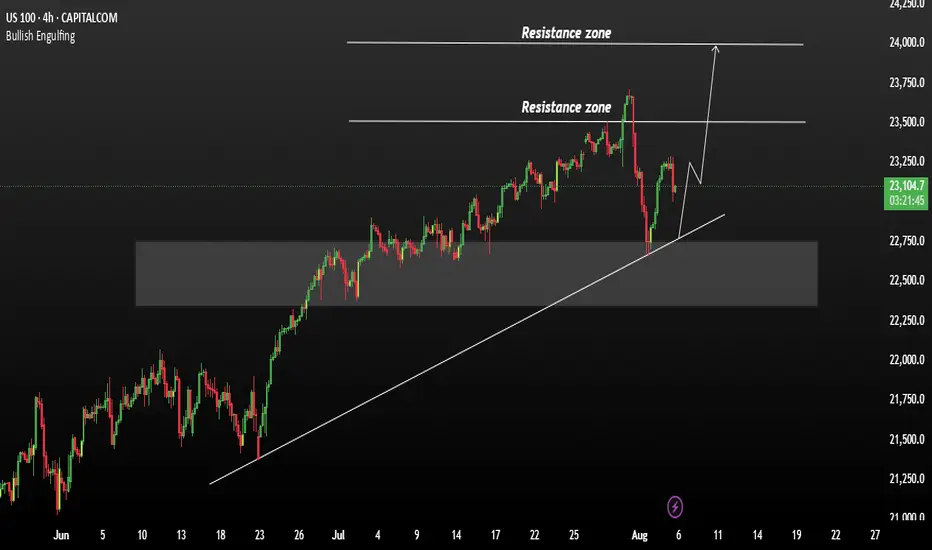
US100 Technically Move Up HeadThe US100 has seen multiple pullbacks of around 3.5% to 4% over the past week. However, each dip has been met with strong buying interest, leading to quick recoveries — indicating that these were bullish pullbacks, not trend reversals.
This kind of price action typically reflects underlying market strength, where investors view corrections as buying opportunities rather than signals of weakness.
Key Technical Observations:
Each drop has been bought aggressively, suggesting a firm support base in the 22,700–23,000 region If this bullish momentum persists, US100 could retest recent highs and potentially break through, opening the path towards 23,500 and 2: 24,500
You May find more details in the chart.
Trade wisely best of Luck Buddies.
Ps: Support with like and comments for better analysis Thanks for understating.
US 100 – US CPI in Focus, Could this Be Moving Day? Technology stocks in the US 100 have been leading the resurgence of US assets back up from their April lows for a while now, driven higher by fresh demand for magnificent 7 stocks, artificial intelligence capital expenditure and increased expectations for Federal Reserve (Fed) interest rate cuts, which its hoped by traders will restart again when the Fed have their next rate decision meeting on September 17th.
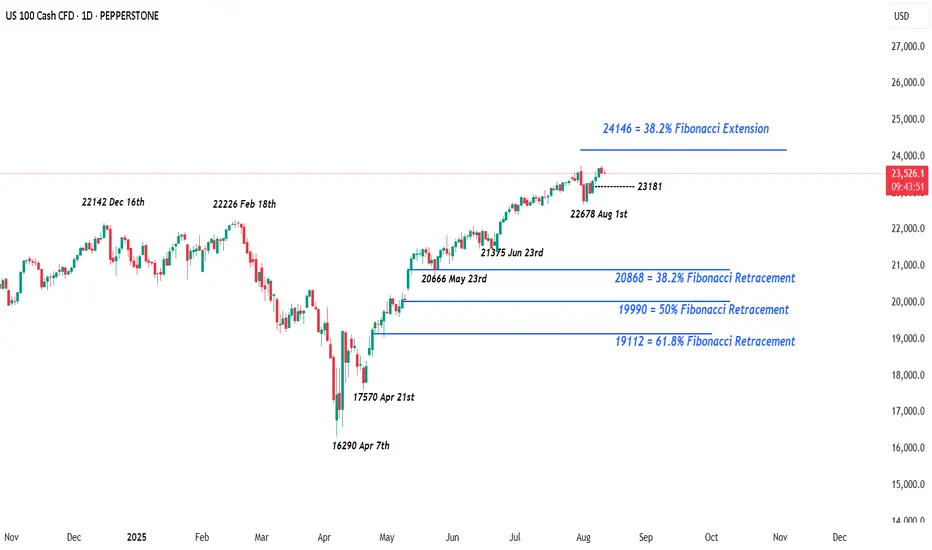
Dips in the US 100 have remained shallow, with the latest blip lower, caused by a weaker than expected US Non-farm payrolls report, causing a sell off from the record high set on July 31st at 23730 down to a low at 22678 (Payrolls Friday August 1st) before the uptrend resumed again, setting a new record closing high at 23660 on Friday since when prices have consolidated so far this week between 23500 and 23716.
Today could potentially be moving day for US 100 stocks with the latest US CPI release due at 1330 BST. Traders are very sensitive to US inflation updates right now as they await the effects of President Trump’s trade tariffs to feed through into higher consumer prices. US corporates initially absorbed the higher tariff costs which has helped to shield US consumers but there has been signs that this trend may be starting to change.
Any deviation in today’s US CPI release from market expectations may alter the current pricing for Fed rate cuts across the next 6 months, which could have an outsized impact on US 100 volatility across the remainder of this week.
Technical Update: Is the Trend Still Your Friend?
When an asset gains fresh buying support and approaches a previous all-time price high, it can be a very important period for both price action and traders. It can lead to the question being asked.
Will buying pressure be strong enough to break above this important resistance and extend the bullish trend, or will sellers re-emerge at the all-time high, triggering a potential reversal in price?
This appears to be the backdrop unfolding for the US 100 index, and as the chart above shows, having seen price weakness briefly post the August 1st low at 22678, the latest price strength since that dip is currently testing 23730 again, the all-time high registered on July 31st.
This 23730 resistance level could be an important focus for traders this week, as successful closing breaks above the all-time high are required to suggest potential for a more sustained phase of price strength, while failure to close above this 23730 resistance level, may lead to increased possibilities for deeper declines in price.
Potential Upside If a Closing Break Develops Above 23730:
If, and it could still be argued it is a big ‘if’, a successful closing break develops above 23730, it could open potential for further price strength towards the next resistance at 24146, which is equal to the 38.2% Fibonacci extension of the July 31st to August 1st price weakness, may be even further.
Potential downside If the Resistance at 23730 Holds:
It is equally possible, the resistance at 23730 can cap the current strength, even prompt fresh selling pressure to turn price activity lower for a phase of weakness.
While 23730 continues to limit current price strength, the focus may shift to possible support at 23181, which is equal to half the August price strength. Closing breaks below 23181 could potentially be a catalyst for further declines to test 22678, the August 1st low, and even lower if this level in turn gives way.
The material provided here has not been prepared accordance with legal requirements designed to promote the independence of investment research and as such is considered to be a marketing communication. Whilst it is not subject to any prohibition on dealing ahead of the dissemination of investment research, we will not seek to take any advantage before providing it to our clients.
Pepperstone doesn’t represent that the material provided here is accurate, current or complete, and therefore shouldn’t be relied upon as such. The information, whether from a third party or not, isn’t to be considered as a recommendation; or an offer to buy or sell; or the solicitation of an offer to buy or sell any security, financial product or instrument; or to participate in any particular trading strategy. It does not take into account readers’ financial situation or investment objectives. We advise any readers of this content to seek their own advice. Without the approval of Pepperstone, reproduction or redistribution of this information isn’t permitted.
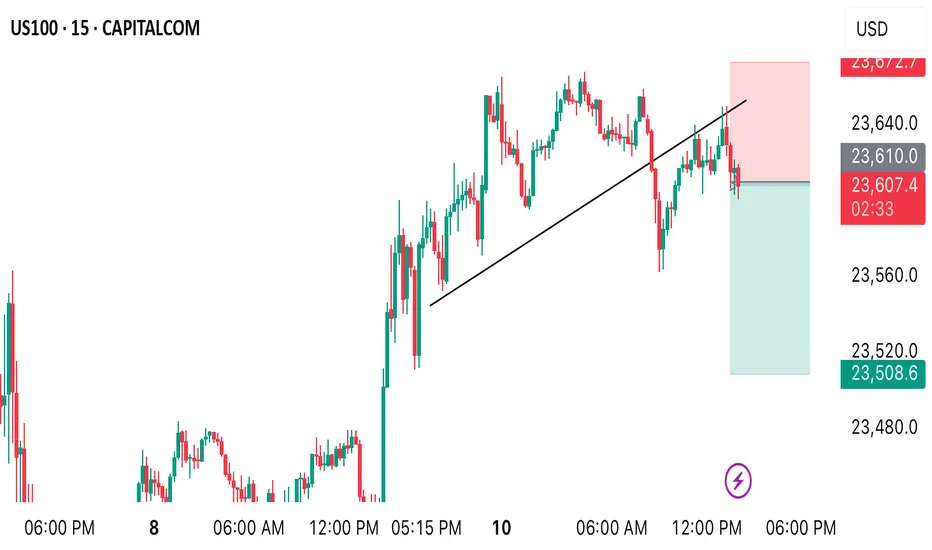
US100 SHORT-TERM SELLPrice formed a triple top reversal pattern which signal’s possible correction from the high. Therefore, a sell opportunity is envisaged from the current market price. Target profit is 23508
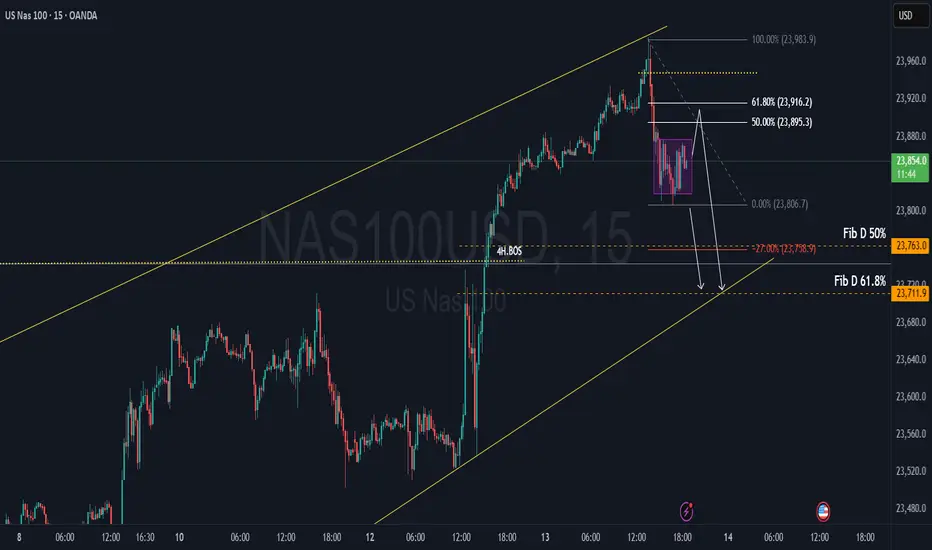
NAS100 SELL ANALYSISThis is an idea of the sale given that we have Reversal confirmed by structure and FIb measurements, looking for short sells to the Daily Fib then will look for Buys for a possible reversal to the Upside.
US100 Price Action InsightUS100 Price Action Insight
In recent analysis, we’ve seen the US100 drop multiple times last month by around 3.5% to 4%, but each time it quickly bounced back, showing that these moves were simply buying opportunities during deep pullbacks.
This time, the index fell by about 4.3% due to fears over new tariffs on August 1st, but it's already recovering, which suggests that the bullish trend remains intact.
If momentum continues, US100 could retest the highs near 23,680, and potentially break above to 24,000 or even 24,500.
You may find more details in the chart!
Thank you and Good Luck!
PS: Please support with a like or comment if you find this analysis useful for your trading day

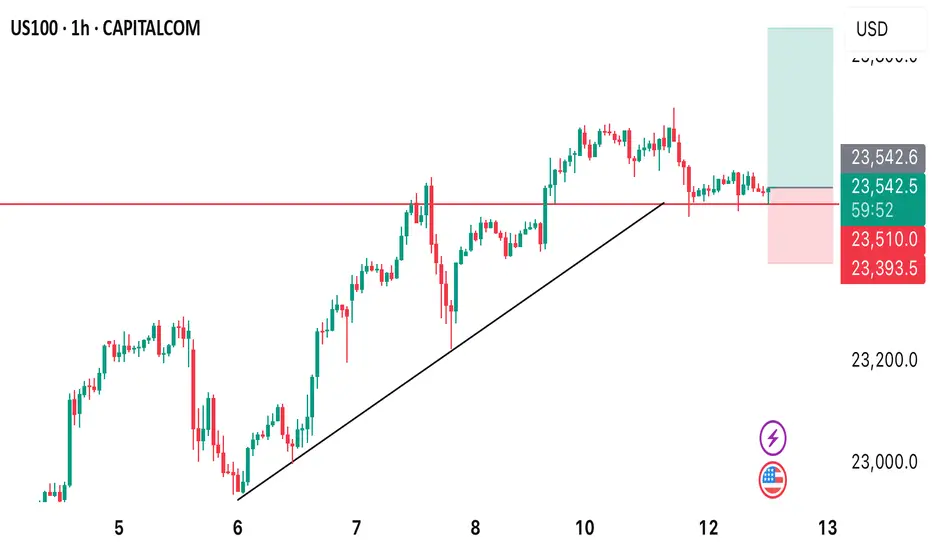
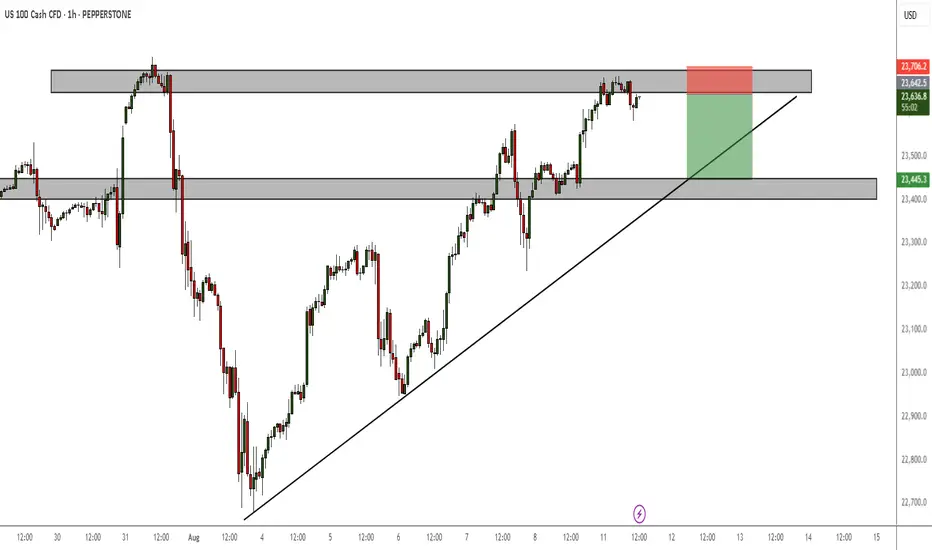
US100 BUY OPPORTUNITY Price is trading at a pullback support. From the technical standpoint, I anticipate bullish price action to develop away from that level. Couple of hours ago, we’ve seen a consolidation around that area. Therefore, a buy opportunity is envisaged from the current market price.
US100 A Waiting Reject from resistanceThe market is currently watching for a rejection from the top resistance zone. Sentiment improved after the US and China extended their tariff truce until November 10, avoiding triple-digit duties on each other’s goods.
2.8% or higher reading likely supports a bearish move toward 23,250 and then 23,950mBelow 2.8% reading → could fuel bullish momentum toward a new ATH at 23,900.
You may find more details in the chart.
Trade wisely best of Luck Buddies.
Ps; Support wit like and comments for better analysis Thanks.
NASDAQ at Record Highs after US CPI report, but can it last?In today’s video, we break down the major market moves triggered by the July US CPI report. Headline CPI rose 0.2% month-over-month—right in line with expectations and a slowdown from the previous month. Year-over-year, headline inflation came in at 2.7%, just under the 2.8% forecast, while Core CPI rose 0.3% MoM (matching forecasts) but was a bit hotter at 3.1% YoY (vs. 3.0% expected).
These “not as bad as feared” inflation numbers kept hopes alive for a September Fed rate cut, pushing the odds of a cut to 96%. Markets responded strongly: the NASDAQ 100 closed at a record high, just shy of the 24K handle, with broad gains in tech and communication stocks, as traders bet on a more dovish Fed.
We also cover the technical setup for the NASDAQ 100 and key risk factors heading into the second part of August.
This content is not directed to residents of the EU or UK. Any opinions, news, research, analyses, prices or other information contained on this website is provided as general market commentary and does not constitute investment advice. ThinkMarkets will not accept liability for any loss or damage including, without limitation, to any loss of profit which may arise directly or indirectly from use of or reliance on such information.

NAS100 Bearish Correction/Third touch of Support trendlineA correction to the downside and a third touch of the trendline will provide more opportunities to go long. However, confirmations to short are looking strong right now.
NAS100 Reversal Confirmed: Is the Rally Over?The NASDAQ 100 (NAS100) may have just hit its ceiling. In this video, I break down the technical evidence pointing to a confirmed reversal—including key candlestick formations and indicator signals that suggest the recent rally is losing steam.
The bearish engulfing candle on both the daily and weekly, along the monthly RSI divergence is signaling a deeper correction. Our initial target for this week is the previous high with a bounce for a much deeper correction which will be analyzed next week so stay tuned to all my updates and new publications. Thank you and have a great trading week. Cheers!!

Behold the grand NAS100 short expeditionBehold the grand NAS100 short expedition, unleashed by my top-secret pyramidal formula (concealed in golden tombs and guarded by laser-eyed sphinxes):
Pharaoh’s Pivot Points
– We superimpose recent NAS100 peaks onto the Great Pyramid’s four secret chambers. When price breaches the “Upper Antechamber Zone” near 23,300, the ibis-headed guardian squawks—our signal to draw the short sword.
Oracular Sphinx Sentiment
– We feed Fed minutes hieroglyphs and mega-cap earnings scrolls into the Sphinx’s riddle engine. If the answer murmurs “overheating” or “tech fatigue,” it confirms our bearish quest.
Ra’s Wall-Street Candle Filter
– Only candles closing between 09:30–16:00 ET count as true “New York sun-blessed bars.” Any rogue moves in the witching hour? Mirage dust—ignored.
Anubis’ Volume Veil
– Volume spikes are weighed in pharaoh-ounces of pure gold. When daily turnover eclipses 30,000 pharaoh-ounces, the Underworld Flush ritual begins—time to tighten our longs… er, shorts.
Tomb-Run Trend Confirmation
– Trendlines aren’t drawn from ordinary swing highs; we connect the three sacred glyph-points carved into the sarcophagus walls. Once that “Tomb-Run Downtrend” appears, we descend into the dark.

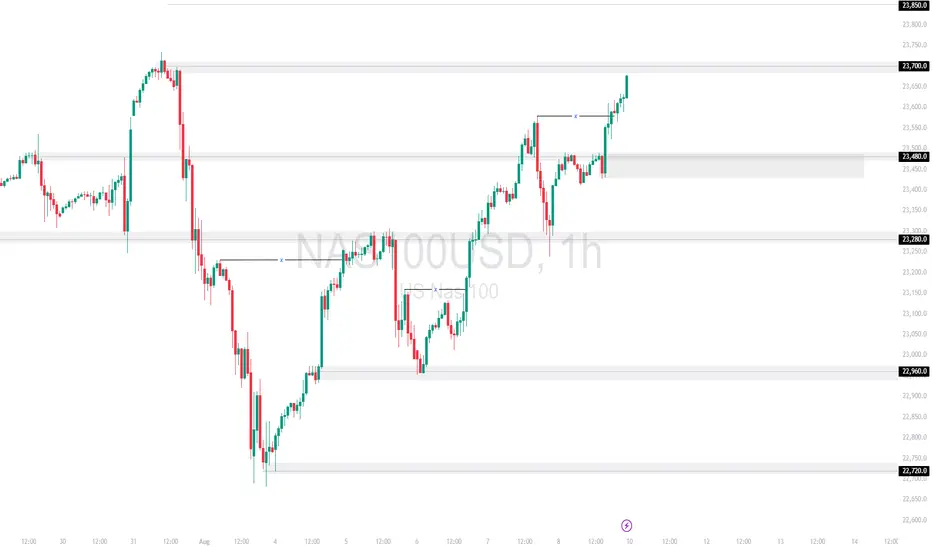
NAS100 – Eyeing 23,700.0 ResistanceNAS100 continues its bullish momentum, breaking above the 23,480.0 zone after a strong rally. Price is now approaching the 23,700.0 resistance, with short-term support building near 23,480.0. A retest of support before another push higher remains likely.
Support at: 23,480.0 🔽 | 23,280.0 | 22,960.0 | 22,720.0
Resistance at: 23,700.0 🔼 | 23,850.0
🔎 Bias:
🔼 Bullish: Holding above 23,480.0 and breaking 23,700.0 could extend gains toward 23,850.0.
🔽 Bearish: Failure to hold 23,480.0 may lead to a deeper pullback toward 23,280.0.
📛 Disclaimer: This is not financial advice. Trade at your own risk.
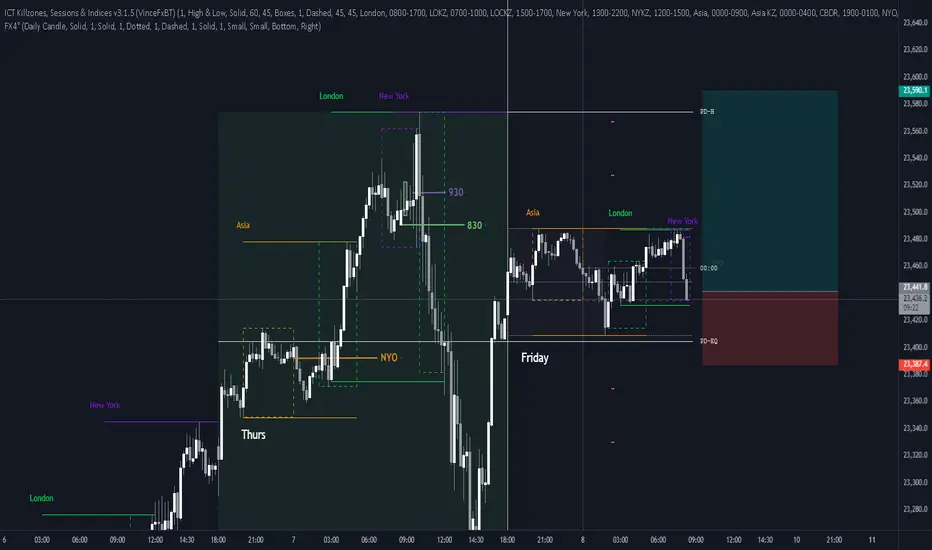
Long NQFriday so be ware
Asia and London left clean highs
We are on a down leg at OTE but it just looks to clean to sell
US100 Bullish Breakout!
HI,Traders !
#US100 is trading in a strong
Uptrend and the price made a
Bullish breakout of the key
Horizontal level of 23660.2
So we are bullish biased
And we will be expecting a
Further bullish move up !
Comment and subscribe to help us grow !
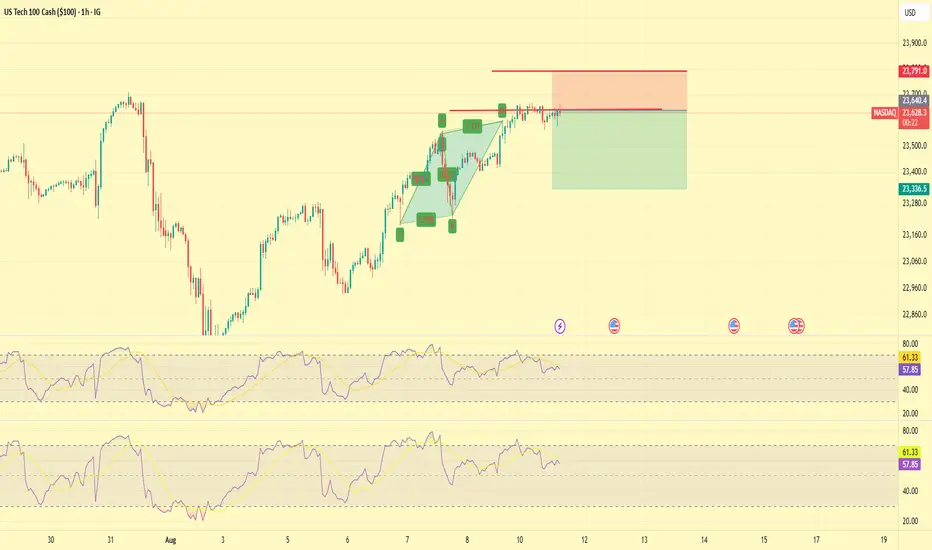
NASDAQ Short This is at the all-time high, showing a lot of resistance
There is an AABCD pattern on H1
All timeframes are overbought
There are multiple tops on M15 and M30 with divergence
Stop loss of 150 pips
USNAS100Preferably suitable for scalping and accurate as long as you watch carefully the price action with the drawn areas.
With your likes and comments, you give me enough energy to provide the best analysis on an ongoing basis.
And if you needed any analysis that was not on the page, you can ask me with a comment or a personal message.
Enjoy Trading ;)

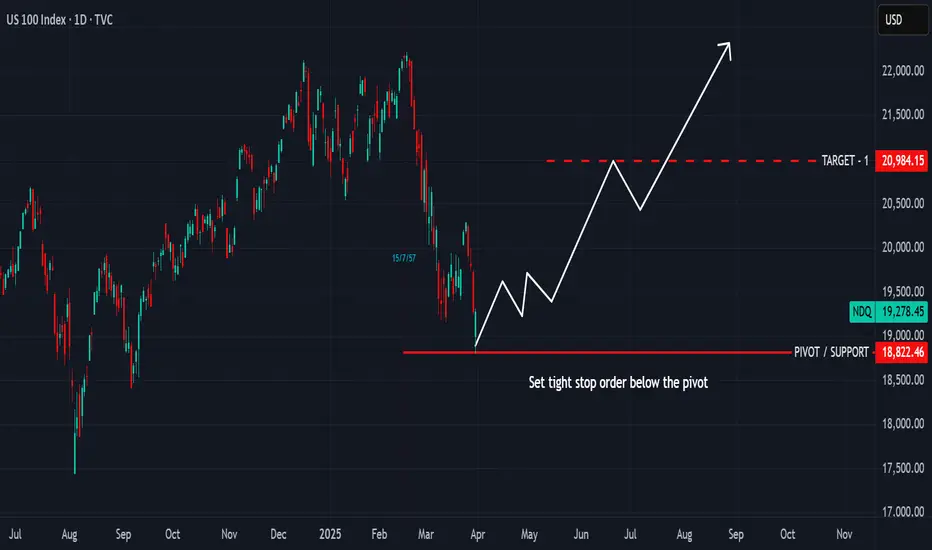
BUY EVERY BIG TECH, BUY AND HOLD UNTIL OCTOBERBuy the pivot level. hold for the last 7-month bull run until October 2025.
Price and time cycles suggest that price will peak in October 2025 and a second swing high in March 2026 for the midcycle correction. We would look for the top at 26k
Buy every big tech, buy the major stocks, buy, buy......
The 7-month cycle from March to October 2025 will be the second largest swing within the 5-year bull run from 2020 crash low
Trade safe, good luck.
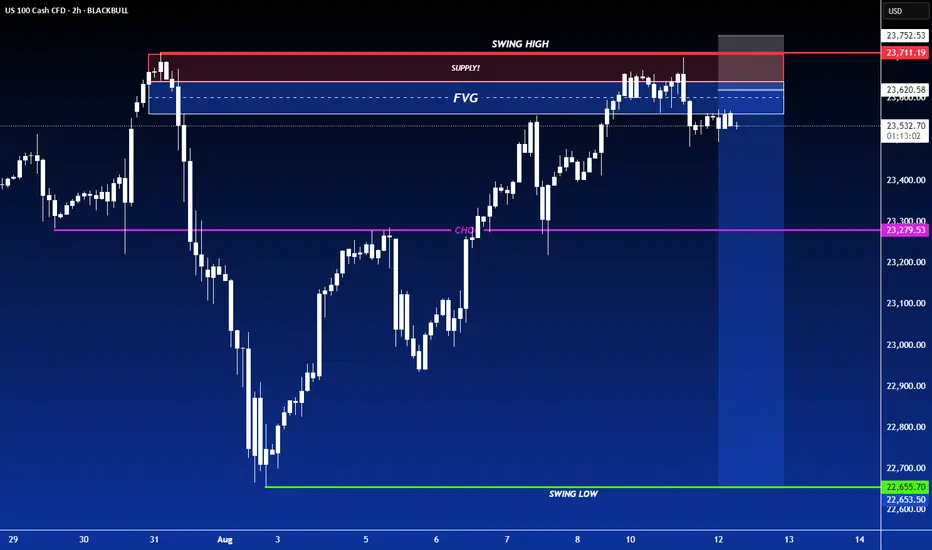
SHORT ON NAS100NAS has retested a major supply zone after a nice CHOC (Change Of Character)
I will be selling NAS looking to catch over 800-100 points.
DXY (USD) CPI economic news will also be a catalyst to more this trade this morning after 8:30am.
Nasdaq: End of Bullish Wave, 10%+ Downside in Sight?Hey Realistic Traders!
Has CAPITALCOM:US100 (Nasdaq) Finally Peaked? A Reversal Signal Just Flashed. Is This the Turning Point Toward a Deeper Pullback?
Let’s dive into the technicals to see what the chart is really telling us.
Technical Analysis
On the daily chart, the Nasdaq is starting to show signs of weakness. A bearish divergence has formed between the MACD and price movement , which is a classic signal that bullish momentum may be fading. This often indicates the potential for a trend reversal or a deeper correction.
A recent drop, confirmed by a strong bearish full-body candlestick, suggests that selling pressure is increasing. If this continues, we expect a breakdown from the current bullish channel.
In this scenario, the extended Wave 3 may have reached its peak. A correction could follow, with the first target at 21484, which lines up with the 0.382 Fibonacci retracement level. If the decline continues, the next downside target would be around 20067, where a previous gap may be filled.
This bearish outlook remains valid as long as the price stays below 23800 . A move above that level would invalidate the setup and return the outlook to neutral.
Support the channel by engaging with the content, using the rocket button, and sharing your opinions in the comments below.
Disclaimer: "Please note that this analysis is solely for educational purposes and should not be considered a recommendation to take a long or short position on Nasdaq.
