NAS100 - Update Dear Friends in Trading,
How I see it,
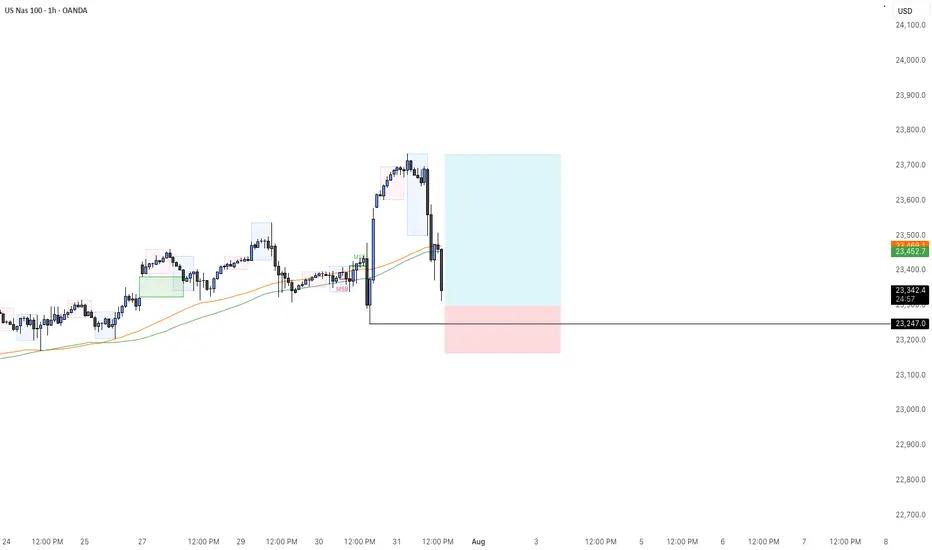
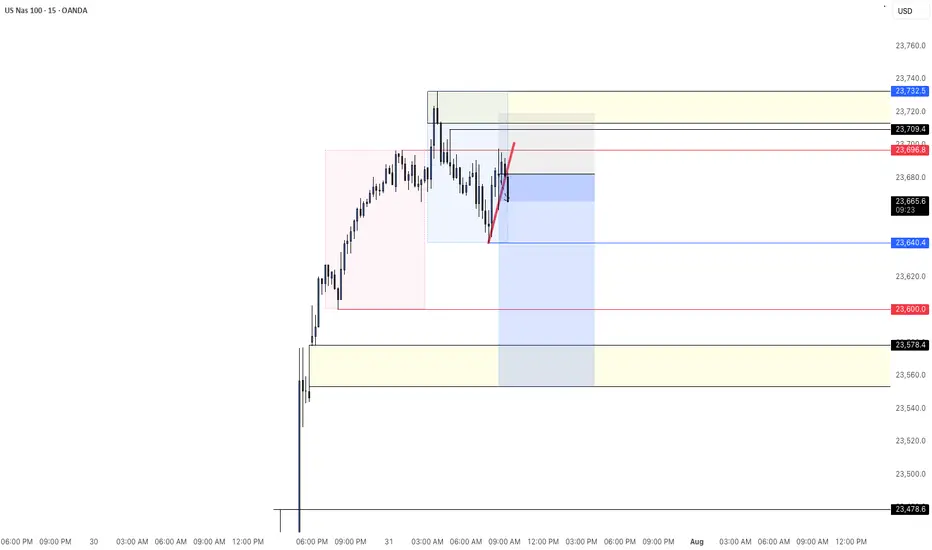
I will be waiting for a clear and decisive break below the PIVOT.
Keynote:
I am not trading NASDAQ at all...just monitoring patiently!!
I will keep you in the loop as the stock market progress...
I sincerely hope my point of view offers a valued insight
Thank you for taking the time study my analysis.
USTECFU trade ideas
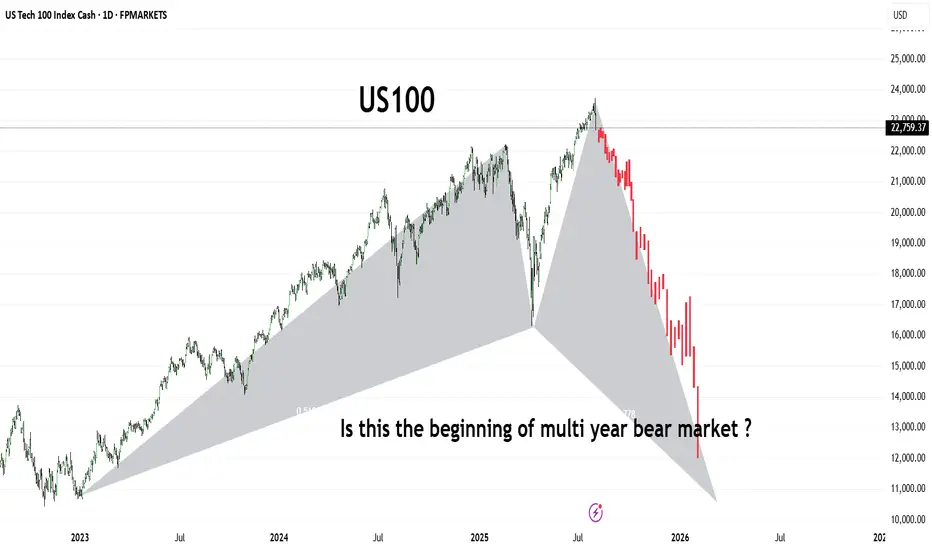
US100The US100 (Nasdaq 100) has shown a dramatic shift in trend, forming what appears to be a large-scale bearish harmonic pattern or potential M-top structure. After reaching its peak in mid-2025, the index has entered a sharp downward trajectory, shedding significant value in a short span.
This chart raises a critical question for long-term investors and traders:
Are we witnessing the early phase of a prolonged bear market that could stretch into 2026 and beyond?
🔻 Key Observations:
Bearish structure developing with aggressive selling pressure.
Potential breakdown from long-term support trendlines.
Momentum suggests institutional risk-off behavior.
Stay alert for macroeconomic cues, interest rate policy, and earnings season signals. A break below 13,000 could confirm a deeper bear cycle
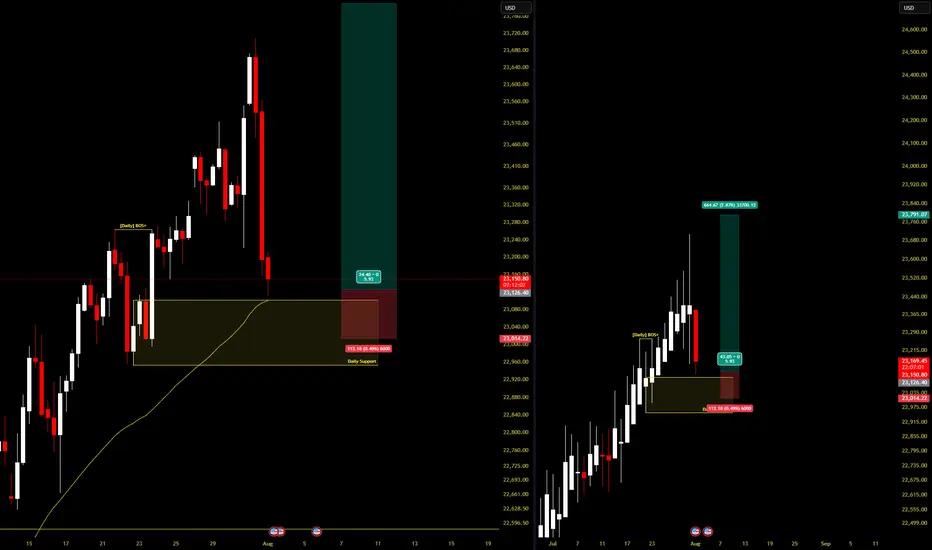
NASDAQ LONG NOWDaily break of structure provided me a view of the daily support at 22,960.
My entry is also supported by the 50-MA at the left chart. Im targeting 23,800 with 1:6 risk reward.
NAS100 - BUYHuge drop as expected today. Now that we are reaching its key level of interest, I will wait for a buy confirmation to take our last nights highs.
Fibonacci Retrace Strategy NAS100 Trade Idea📈 NASDAQ 100 (NAS100) is holding a strong bullish trend 🚀. After a weekend gap-up 🕳️➡️📈, price retraced back into the gap zone—exactly what you'd expect in a healthy trending market.
🔍 I'm applying my Fibonacci Expansion + Retrace Strategy 🔢, watching closely for a pullback into equilibrium ⚖️ within the previous price swing. That’s where I’ll be waiting for a bullish market structure break 🔓📊 to confirm my long bias.
🧠 Patience is key here—let the setup come to you.
📌 As always, this is not financial advice!
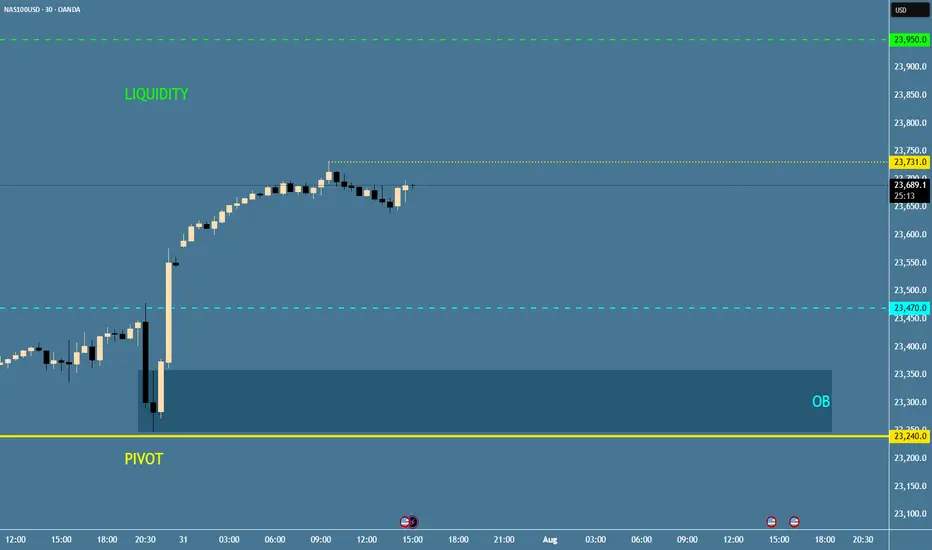
US100 Index – Potential Bearish Reversal in Key Resistance Zone🧠 US100 Index – Potential Bearish Reversal in Key Resistance Zone
Timeframe: 30-Minute | Chart Published: July 24, 2025
---
🔍 Overview
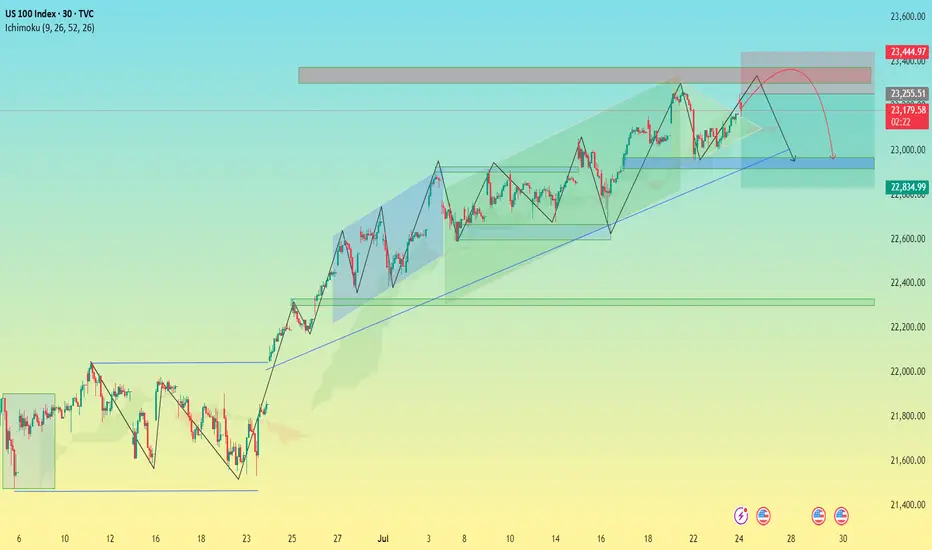
The US100 (NASDAQ) has been trading in a well-structured ascending channel, forming higher highs and higher lows. However, recent price action suggests that the index is testing a critical supply zone near 23,400, with signs of weakening bullish momentum. This may signal a potential corrective phase or bearish reversal.
---
📈 Technical Analysis Breakdown
🔵 Trend Structure:
Price is respecting a clear ascending trendline (blue), connecting multiple higher lows.
Multiple bullish flag/channel formations have been completed within the uptrend, showing healthy momentum until the current point.
🟥 Resistance Zone:
Strong supply zone marked between 23,250 – 23,450.
Price action shows stalling candles and rejection wicks within this zone, indicating buyer exhaustion.
⚠ Bearish Patterns:
The red path projection suggests a head and shoulders-like structure forming at the top of the channel.
This, along with divergence in wave strength and shrinking momentum, supports a potential reversal.
🔵 Key Support:
First support lies around 23,000 — aligning with the ascending trendline and previous consolidation.
If broken, next demand zone is around 22,835 – 22,900, where historical consolidation took place.
---
🔁 Projected Scenario (as per visual path)
1. Price may attempt one last push into the 23,400–23,450 zone (possible false breakout).
2. Rejection from this level could trigger a fall toward the ascending trendline support.
3. A confirmed break of the trendline can lead to a larger correction toward the 22,800 zone.
---
🧠 Unique Insight
This chart combines multi-timeframe structure recognition with a real-time reversal formation inside a long-standing bullish trend. The analysis doesn’t just rely on textbook patterns—it recognizes real-time price behavior shifts, which makes it valuable for proactive traders.
---
📌 Conclusion
While the trend remains bullish overall, caution is warranted as the US100 approaches a historically significant resistance zone. The setup offers a compelling risk-reward short opportunity for aggressive traders, especially if the price confirms a break below trendline support.
---
🔧 Next Steps for Viewers
> “Watch for a clean rejection candle or lower high at resistance before entering short. If trendline breaks cleanly, 22,835 could be the next target zone.”
NAS - TIME FOR JUICYTeam, hope you all making a killing on SHORT tonight.
as we expected. Thank you for asking and be patience
TIME TO MAKE NAS100 GREAT AGAIN.
Sorry my entry was 23240, but now the market is 23332
you should entry small volume at the current price 23332 - if a little pull back below 23300 add more
STOP LOSS at 23230-50
TARGET 1 at 23385-23400
TARGET 2 at 23475-23515
LETS go - time to make ACTIVE TRADER ROOM GREAT AGAIN.!
NAS100 - SHORTPrice hit TP after yesterday's long position. Created new all time highs into the asian/London session. We have a nice gap I will target as my potential full TP.
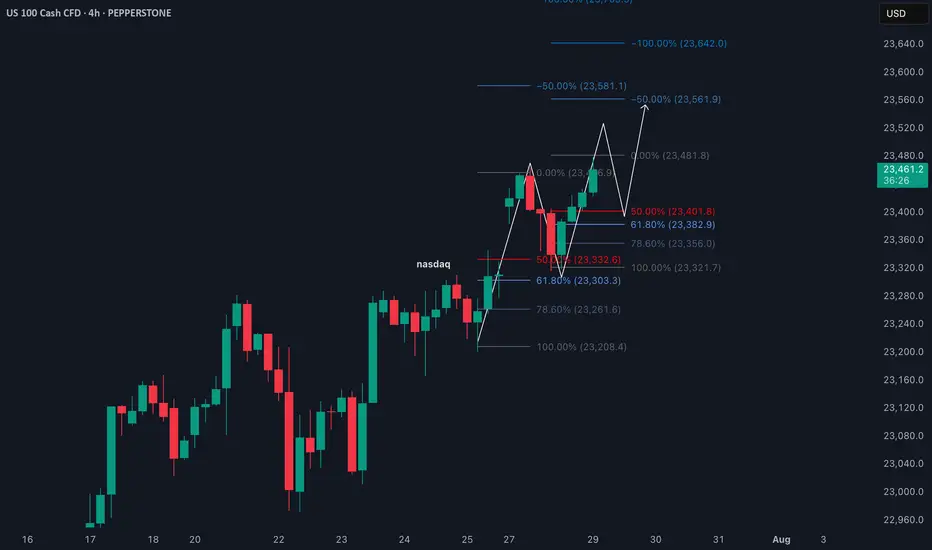
Nasdaq Short: multiple reasonsOver here, I present to you the Nasdaq short idea again. For my previous idea, it was stopped out at 23500. This time, I changed the wave counts again, mainly merging the previous wave 5 into wave 3, allowing for the new high to be a wave 5.
On top of that, here are the few other reasons for the short:
1. Fibonacci extension levels: Wave 5 is slightly more than Wave 1.
2. RSI overbought for the 3rd time on the hourly timeframe.
3. Rising wedge false breakout.
4. Head-and-shoulders on the 1-min timeframe.
As usual, the stop for this idea is slightly above the recent high, around 23700.
Thank you.

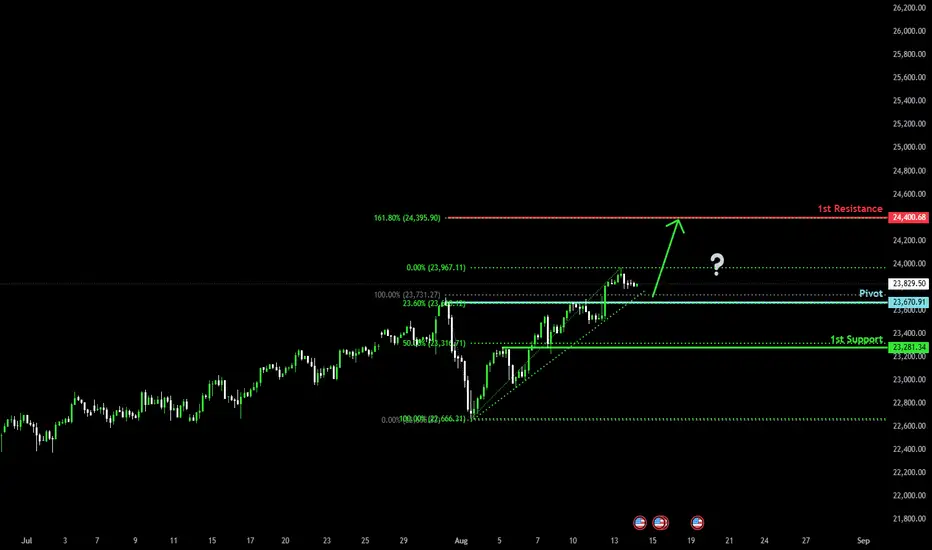
Bullish continuation?USTEC is falling towards the pivot which has been identified as a pullback support and could bounce to the 1st resistance.
Pivot: 23,670.91
1st Support: 23,281.34
1st Resistance: 24,400.68
Risk Warning:
Trading Forex and CFDs carries a high level of risk to your capital and you should only trade with money you can afford to lose. Trading Forex and CFDs may not be suitable for all investors, so please ensure that you fully understand the risks involved and seek independent advice if necessary.
Disclaimer:
The above opinions given constitute general market commentary, and do not constitute the opinion or advice of IC Markets or any form of personal or investment advice.
Any opinions, news, research, analyses, prices, other information, or links to third-party sites contained on this website are provided on an "as-is" basis, are intended only to be informative, is not an advice nor a recommendation, nor research, or a record of our trading prices, or an offer of, or solicitation for a transaction in any financial instrument and thus should not be treated as such. The information provided does not involve any specific investment objectives, financial situation and needs of any specific person who may receive it. Please be aware, that past performance is not a reliable indicator of future performance and/or results. Past Performance or Forward-looking scenarios based upon the reasonable beliefs of the third-party provider are not a guarantee of future performance. Actual results may differ materially from those anticipated in forward-looking or past performance statements. IC Markets makes no representation or warranty and assumes no liability as to the accuracy or completeness of the information provided, nor any loss arising from any investment based on a recommendation, forecast or any information supplied by any third-party.
NASDAQ H1 BUYING CHANNEL Buy Nasdaq Channel ?
Buy Gold At Nasdaq FVG
Buying Structre #NASDAQ
Buy At FVG
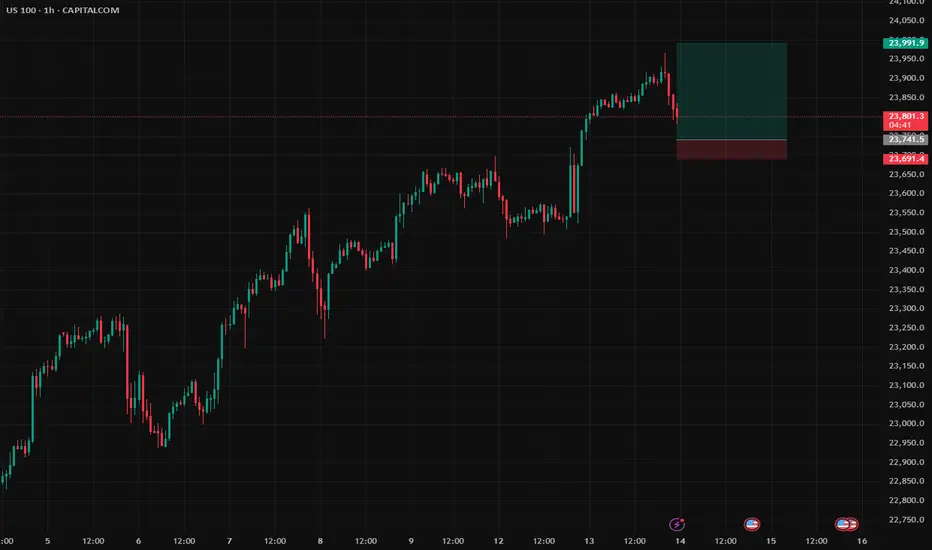
US100 Trade Idea – Risking 1% for Potential 5% Gain 13/8/2025
I trade with a fixed 1:5 risk–reward ratio, focusing on setups that offer asymmetric profit potential. My approach emphasizes precise entries, strict risk management, and the patience to let trades reach their full potential.
This method allows me to risk small while aiming for meaningful gains, keeping my results consistent and sustainable over time. Trading, for me, is as much about mindset as it is about method — staying calm, following the plan, and letting probabilities work in my favor.
Disclaimer: This is purely an idea shared for educational purposes. I take no responsibility for any financial decisions you make. Please assess it carefully and adapt it to your own trading plan before acting.

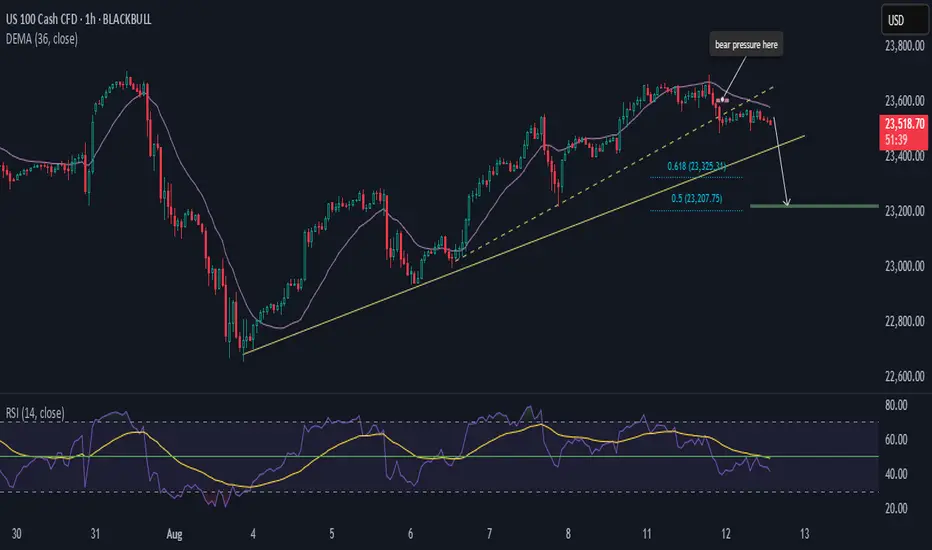
NAS100 Building Up On Bearish PressureHi there,
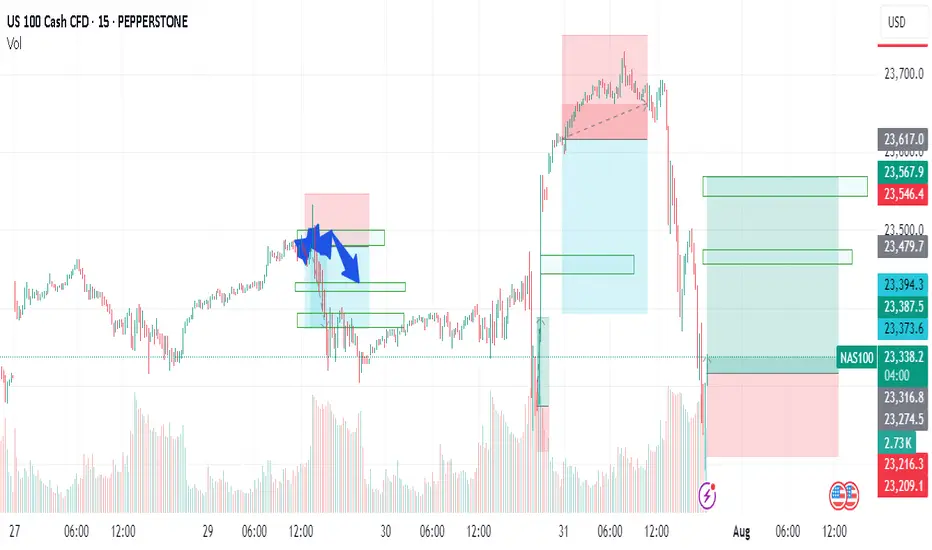
NAS100 has been very surprising for us recently, with increased bullishness that appears to be giving a bearish bias.
🦉 We'll use RSI and DEMA to coordinate price movements.
🎙️The price is bearish from the 23,600 area and has broken a minor dashed trendline. As long as the price remains below the purple 36 DEMA, below the RSI 50 level, and below the yellow RSI EMA, we remain bearish toward the solid trendline. This outlook points to two target support areas: 23,325 and 23,207.
🧩 Note: the bearish momentum is driven by the 3-hour chart. If it changes there, the setup will be invalidated.
Happy Trading,
K.
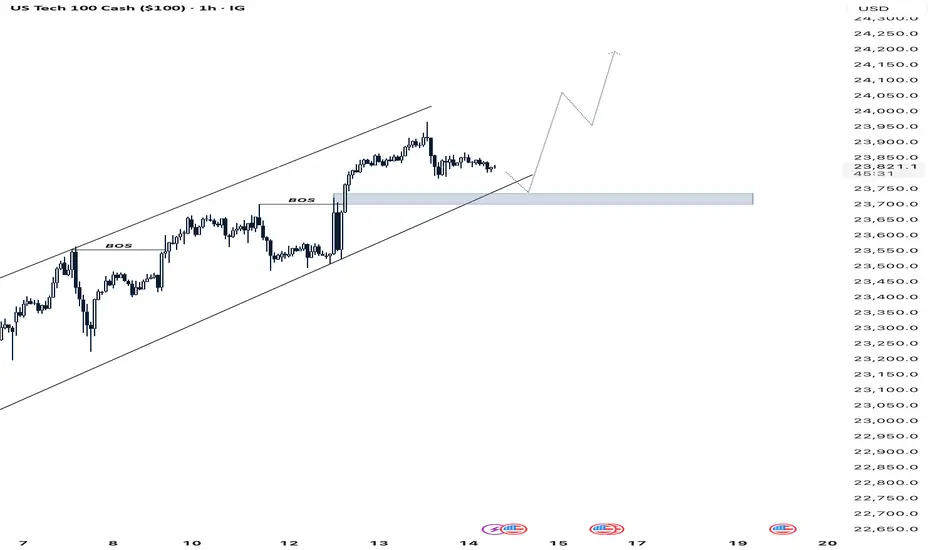
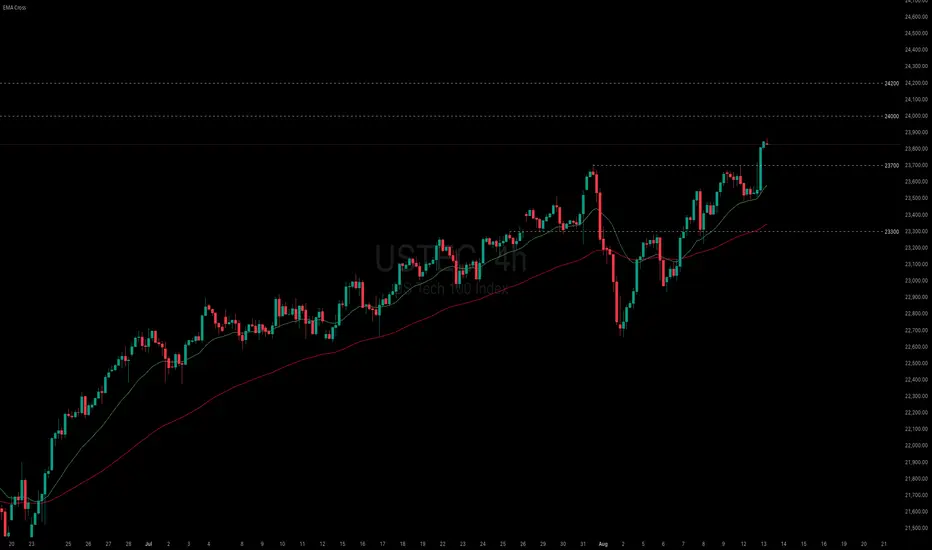
Rate-cut optimism fueled risk-on mood, lifting US equities
July CPI showed little inflationary impact from tariffs, amplifying expectations for a September Fed cut. Optimism also returned for small-cap firms, previously seen as most vulnerable to tariff pressures. Headline CPI rose 2.7% YoY in July, 0.1% lower than a year earlier, with a 1.1% MoM drop in energy prices contributing to the overall decline.
BlackRock CIO Rick Rieder noted that shelter costs, the largest CPI component, slowed to their lowest since 2021, significantly boosting the odds of a September cut. He added that the Fed could take a more aggressive approach, with a 50bp cut at the September FOMC.
USTEC extended its sharp uptrend after breaching above the 23700 high. The widening gap between both EMAs indicates the potential continuation of bullish momentum. If USTEC holds above 23700, the index may gain upward momentum toward the psychological resistance at 24000. Conversely, if USTEC breaks below 23700, the index could retreat toward 23300.
NasdaqNasdaq is showing bearish signals based on COT data with large traders adding shorts. Price is currently at a confirmed supply zone, increasing the likelihood of a downward reversal.

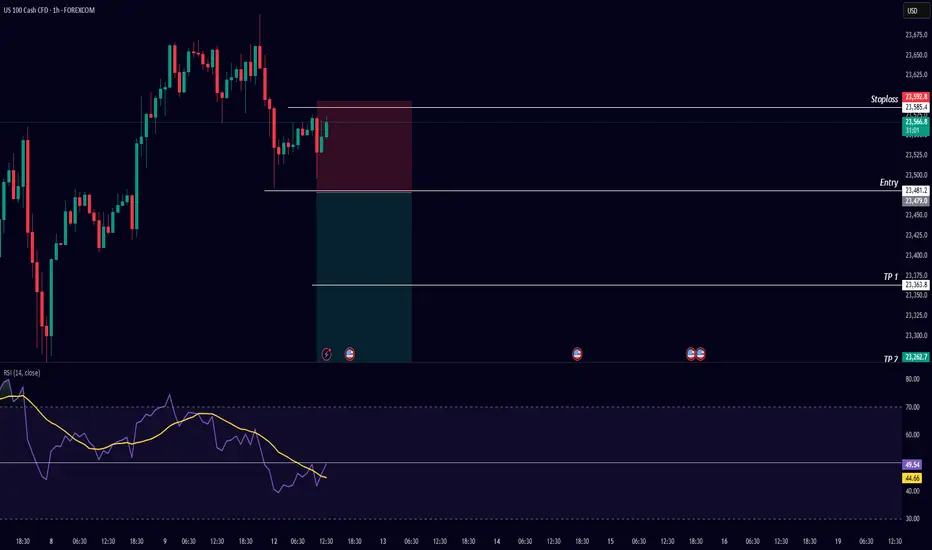
NAS100 Sell Trade PlanThe market is showing a lower high formation on the 1H chart, indicating potential bearish continuation. Entry is planned at 23,481.2, with a stop loss at 23,584.6 to protect against upside breakouts. The first target (TP1) is set at 23,363.8 to secure partial profits, and the second target (TP2) is at 23,275.0 for extended downside potential. RSI is currently below the 50 level (44.70), supporting bearish momentum. Risk-to-reward ratio favors the setup, aligning with the recent downtrend structure.
NAS100 at mjaor resistance area Fib 0.5Price has reached the 0.5–0.382 Fibonacci retracement zone of the recent swing. If the bears are strong, we may see a rejection toward the trendline support. However, if this resistance is broken, a bullish continuation is also possible. Let's see how it plays out.

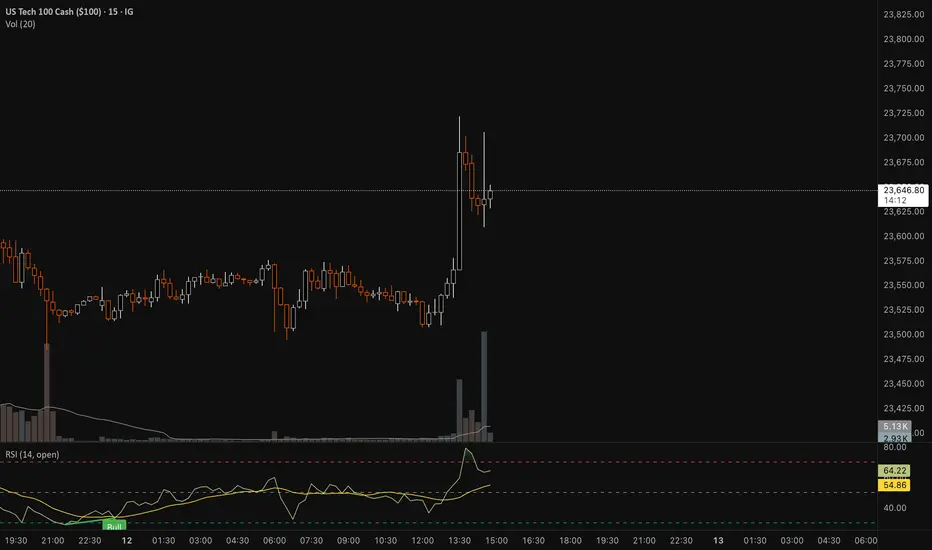
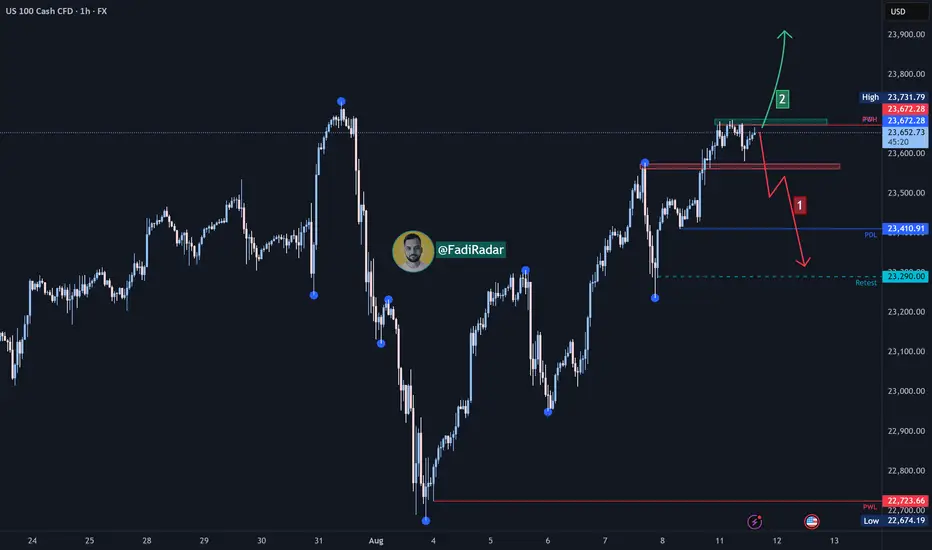
Nasdaq Index Analysis (US100 / NASDAQ)The index is currently trading near $23,670, a pivotal zone between two possible scenarios:
🔻 Bearish Scenario:
If the support at $23,570 is broken and the price holds below it, we may see a decline first toward $23,400, followed by an extended move toward $23,290 as a test area. A break below this level could open the door for further downside corrections.
🔺 Bullish Scenario:
If the price successfully breaks and holds above $23,680, this could support a continuation of the uptrend toward $23,800, and with sustained momentum, a new high could be targeted.
⚠️ Disclaimer:
This analysis is not financial advice. Please monitor market behavior and analyze data carefully before making any investment decisions.
US100 Bullish Momentum Targets AheadThe US100 shows strong bullish structure after completing an ABCD correction, with price eyeing a potential move towards the 1st target at 23,791 and possibly the 2nd target at 24,053. A brief pullback may precede the continuation towards these key resistance levels.
1. Current Structure
The chart follows an ABCD pattern after a strong bullish impulse from the early August lows.
Points A–B–C–D suggest a completed correction phase, with momentum now shifting upward.
Price is currently around 23,629, approaching the first resistance zone.
2. Key Levels
Immediate Support: ~23,500 (recent swing low, short-term demand zone)
1st Target: 23,791 (minor resistance, potential profit-taking zone)
2nd Target: 24,053 (major resistance, psychological round area)
Major Support: 23,200 (break below here could invalidate bullish momentum)
3. Price Action Expectation
Short term:
A small pullback toward 23,500–23,550 is possible before continuing upward (healthy retracement to build buying pressure).

NAS100 Trend following tradeNas100 has been on a bullish run and already had a trade running which is already trailing. looking to add a new position after that engulfing on 1hour candle.

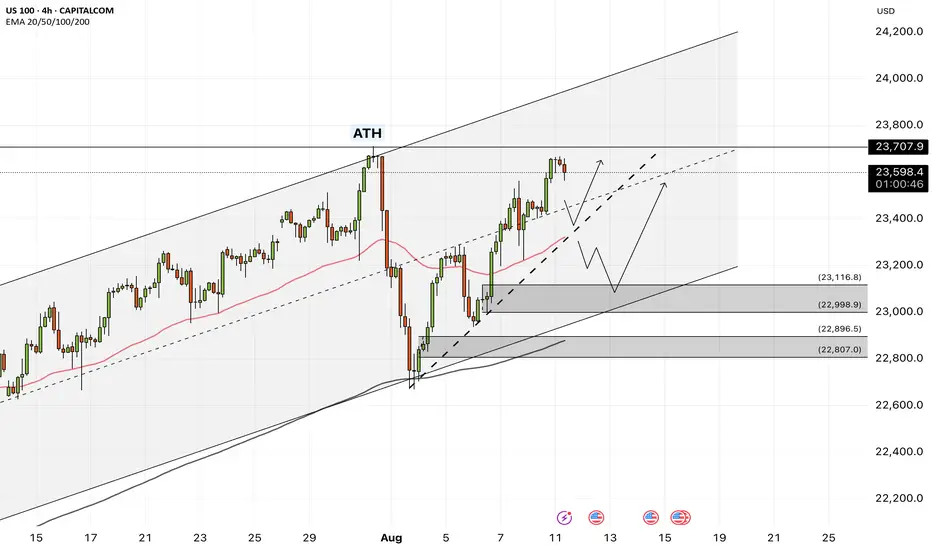
NAS100 - Stock market awaits an important week!The index is above the EMA200 and EMA50 on the four-hour timeframe and is trading in its ascending channel. If the index corrects downwards towards the drawn trend line or the specified demand zone, you can buy Nasdaq with better reward for risk.
Many Federal Reserve officials believe that tariffs could weaken the U.S. economy and push inflation higher—a dilemma that forces policymakers to choose between cutting interest rates to support growth or keeping them unchanged to control prices.
However, Miran—the economic adviser President Donald Trump intends to nominate to the Fed’s Board of Governors—rejects this view. He argues that tariffs will ultimately benefit the economy and will not significantly impact prices, allowing the Fed to resume the rate-cutting cycle it halted earlier this year.
The key question now is whether Miran’s arguments will be persuasive enough to sway the broader thinking of the central bank’s policy committee, or whether concerns over labor market weakness might prompt rate cuts regardless, rendering his arguments unnecessary.
According to analysis from The Wall Street Journal, beyond the policy disagreements, Miran has also challenged the institutional legitimacy of the Federal Reserve. He has accused Fed officials of having political motivations and criticized them for what he calls the “tariff disruption syndrome.” In a paper published last year, he argued that all senior Fed officials should be subject to dismissal at the White House’s discretion. If appointed, he would give Trump a loyal ally inside the Fed’s boardroom—someone capable of promoting the president’s views and challenging the institution’s consensus-driven culture and influential research staff.
Meanwhile, JPMorgan has revised its monetary policy forecast for 2025, now expecting the Fed to deliver three 25-basis-point rate cuts starting in September 2025, compared to its earlier projection of just one cut in December.
Miran, who holds a Ph.D. in economics from Harvard University, currently serves as Chairman of the White House Council of Economic Advisers. On Thursday, Trump announced his intention to nominate him for a newly vacant Fed board seat. This position became available unexpectedly after Adriana Kugler’s resignation last week and will expire in January. Trump also revealed plans to nominate another individual to fill this seat, who could potentially replace Jerome Powell as Fed Chair in the spring. Miran’s appointment would give Trump additional time to evaluate how candidates—whether Miran himself or Christopher Waller, whom he appointed during his first term—align with his policy views and vote on interest rates.
This week’s economic calendar is once again crowded, with a series of key inflation reports and consumer-related indicators in the spotlight.
Early Tuesday, the Reserve Bank of Australia will announce its interest rate decision, with markets expecting a 25-basis-point cut from 3.85% to 3.60%. Shortly after, traders’ attention will shift to the U.S. Consumer Price Index (CPI) for July, where core inflation is expected to rise from 0.2% in June to 0.3%.
Wednesday will be relatively quiet, with the main highlight being speeches from Fed officials Austan Goolsbee and Raphael Bostic. On Thursday, focus will return to major data releases, including the U.S. Producer Price Index (PPI), which is projected to see its core measure increase by 0.2% after holding steady in June. Weekly jobless claims figures will also be released that day.
The week will conclude with a broader look at U.S. consumer activity. July retail sales are forecast to slow from 0.6% to 0.5%, while core retail sales are expected to drop from 0.6% to 0.3%. Hours later, the preliminary August reading of the University of Michigan Consumer Sentiment Index will be released, providing insights into consumer expectations and confidence.
According to ISM data, pricing pressures have eased in the manufacturing sector but have jumped sharply in the services sector, which makes up a much larger share of the U.S. economy. This suggests that upcoming CPI and PPI reports carry an upside risk relative to forecasts. Inflation readings above expectations—even before fully factoring in the impact of retaliatory tariffs—could erase part of the market’s anticipated rate-cut outlook.