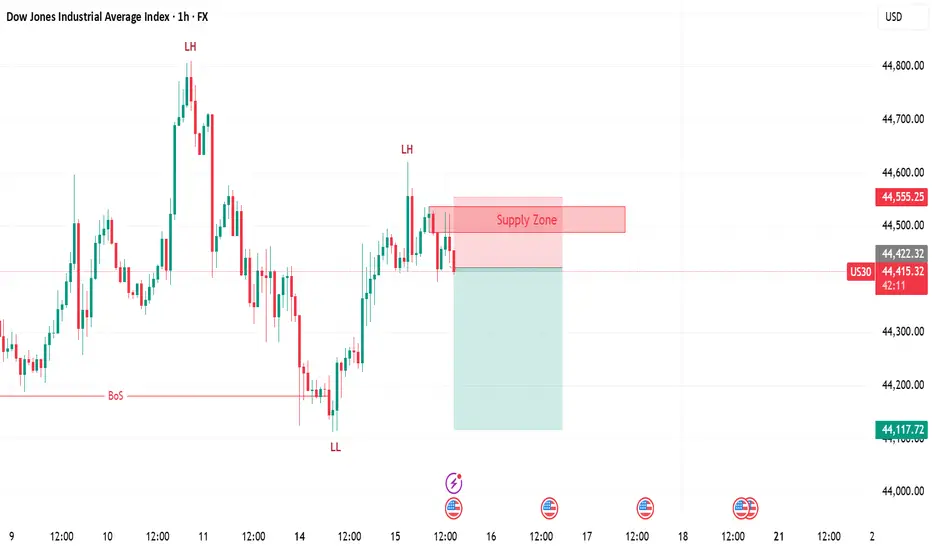
US30 | SELLConfirmation from 15 minute timeframe.
General trend in 1H is downward.
Trading with impulse.
US30 trade ideas
US30 - LONGPrice has retraced and tapped into its 4 hour key level. Looking for buyers to take back control and take liquidity at the previous asian session highs.
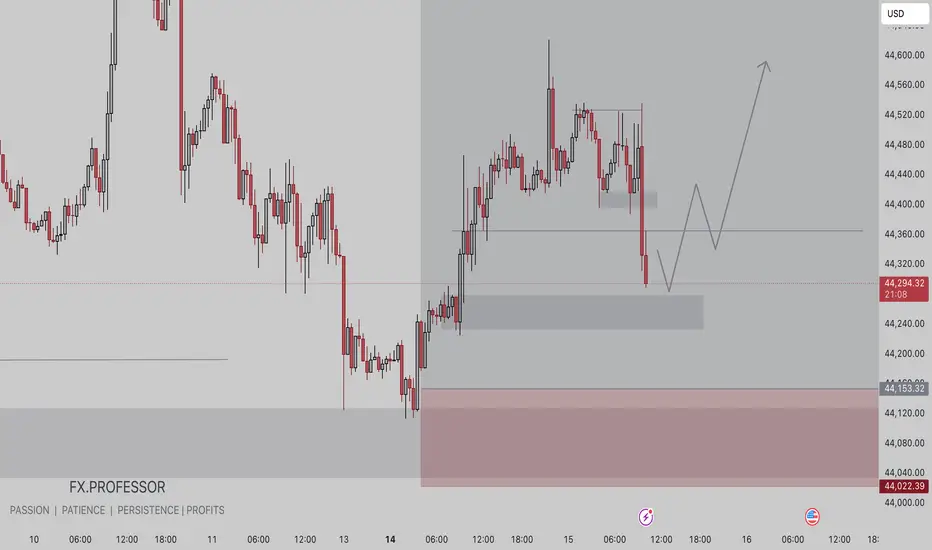
US30 SCALING OPPORTUNITYThere could be a potential scaling opportunity on US30. I have secured partials on this instrument so scaling up will have to be done very carefully with little risk.
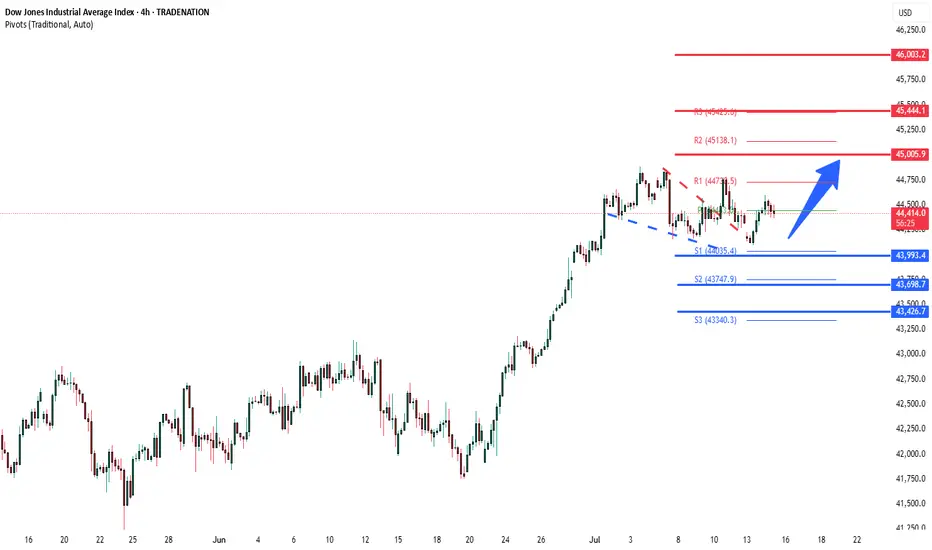
DowJones bullish continuation breakout supported at 43990Key Support and Resistance Levels
Resistance Level 1: 45000
Resistance Level 2: 45440
Resistance Level 3: 46000
Support Level 1: 43990
Support Level 2: 43700
Support Level 3: 43420
This communication is for informational purposes only and should not be viewed as any form of recommendation as to a particular course of action or as investment advice. It is not intended as an offer or solicitation for the purchase or sale of any financial instrument or as an official confirmation of any transaction. Opinions, estimates and assumptions expressed herein are made as of the date of this communication and are subject to change without notice. This communication has been prepared based upon information, including market prices, data and other information, believed to be reliable; however, Trade Nation does not warrant its completeness or accuracy. All market prices and market data contained in or attached to this communication are indicative and subject to change without notice.
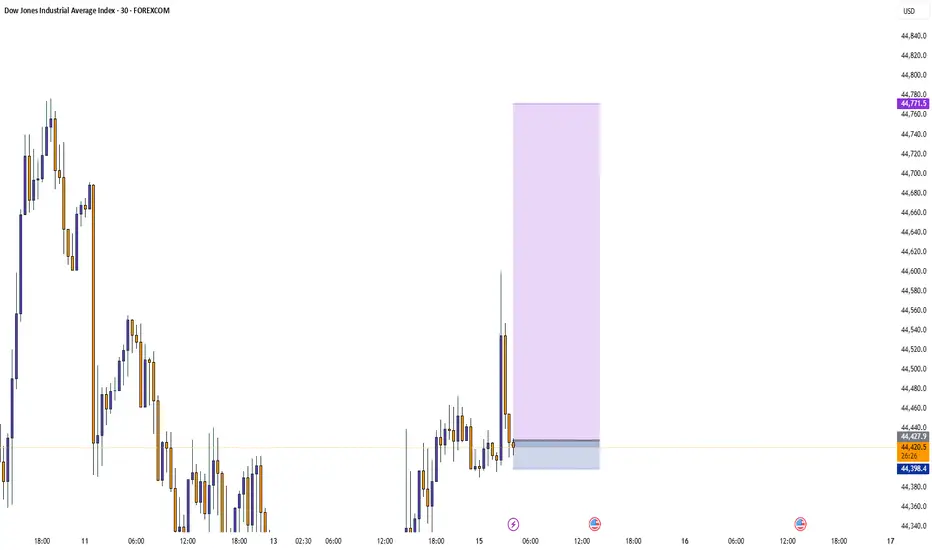
US30: Bears Are Winning! Short!
My dear friends,
Today we will analyse US30 together☺️
The price is near a wide key level
and the pair is approaching a significant decision level of 44,420.7 Therefore, a strong bearish reaction here could determine the next move down.We will watch for a confirmation candle, and then target the next key level of 44,379.6..Recommend Stop-loss is beyond the current level.
❤️Sending you lots of Love and Hugs❤️
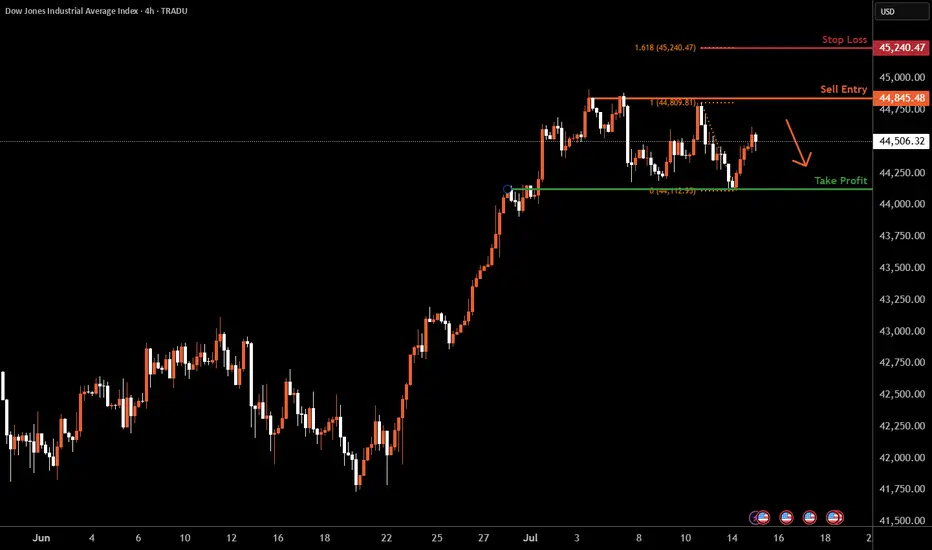
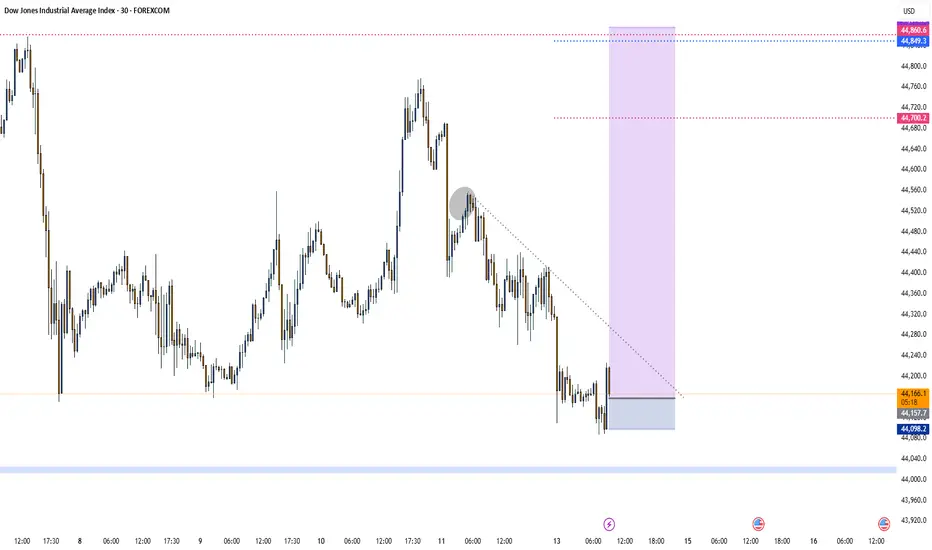
Dow Jones H4 | Rising into a multi-swing-high resistanceThe Dow Jones (US30) is rising towards a multi-swing-high resistance and could potentially reverse off this level to drop lower.
Sell entry is at 44,845.48 which is a multi-swing-high resistance.
Stop loss is at 45,240.47 which is a level that aligns with the 127.2% Fibonacci extension.
Take profit is at 44,124.85 which is an overlap support.
High Risk Investment Warning
Trading Forex/CFDs on margin carries a high level of risk and may not be suitable for all investors. Leverage can work against you.
Stratos Markets Limited (tradu.com ):
CFDs are complex instruments and come with a high risk of losing money rapidly due to leverage. 63% of retail investor accounts lose money when trading CFDs with this provider. You should consider whether you understand how CFDs work and whether you can afford to take the high risk of losing your money.
Stratos Europe Ltd (tradu.com ):
CFDs are complex instruments and come with a high risk of losing money rapidly due to leverage. 63% of retail investor accounts lose money when trading CFDs with this provider. You should consider whether you understand how CFDs work and whether you can afford to take the high risk of losing your money.
Stratos Global LLC (tradu.com ):
Losses can exceed deposits.
Please be advised that the information presented on TradingView is provided to Tradu (‘Company’, ‘we’) by a third-party provider (‘TFA Global Pte Ltd’). Please be reminded that you are solely responsible for the trading decisions on your account. There is a very high degree of risk involved in trading. Any information and/or content is intended entirely for research, educational and informational purposes only and does not constitute investment or consultation advice or investment strategy. The information is not tailored to the investment needs of any specific person and therefore does not involve a consideration of any of the investment objectives, financial situation or needs of any viewer that may receive it. Kindly also note that past performance is not a reliable indicator of future results. Actual results may differ materially from those anticipated in forward-looking or past performance statements. We assume no liability as to the accuracy or completeness of any of the information and/or content provided herein and the Company cannot be held responsible for any omission, mistake nor for any loss or damage including without limitation to any loss of profit which may arise from reliance on any information supplied by TFA Global Pte Ltd.
The speaker(s) is neither an employee, agent nor representative of Tradu and is therefore acting independently. The opinions given are their own, constitute general market commentary, and do not constitute the opinion or advice of Tradu or any form of personal or investment advice. Tradu neither endorses nor guarantees offerings of third-party speakers, nor is Tradu responsible for the content, veracity or opinions of third-party speakers, presenters or participants.
US30 (SHORT)
US30 bearish momentum has reached major resistance Level.
Trendline resistance has been consistant for months/years.
DXY bullish (support level) which means indicies drop

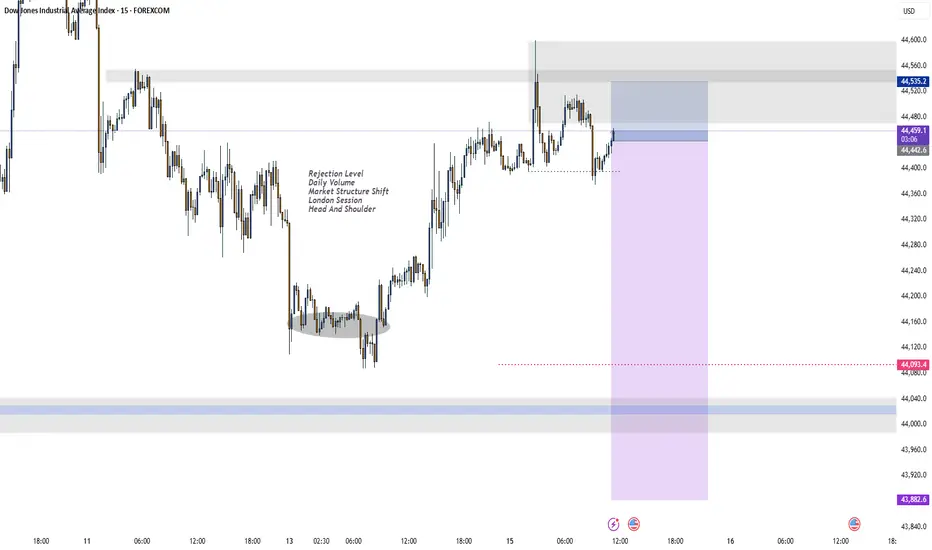
BUYTrend Line Break
Previous Day Volume
Rejection Point
Untapped Order Point
Asian Session
High Structure Swing
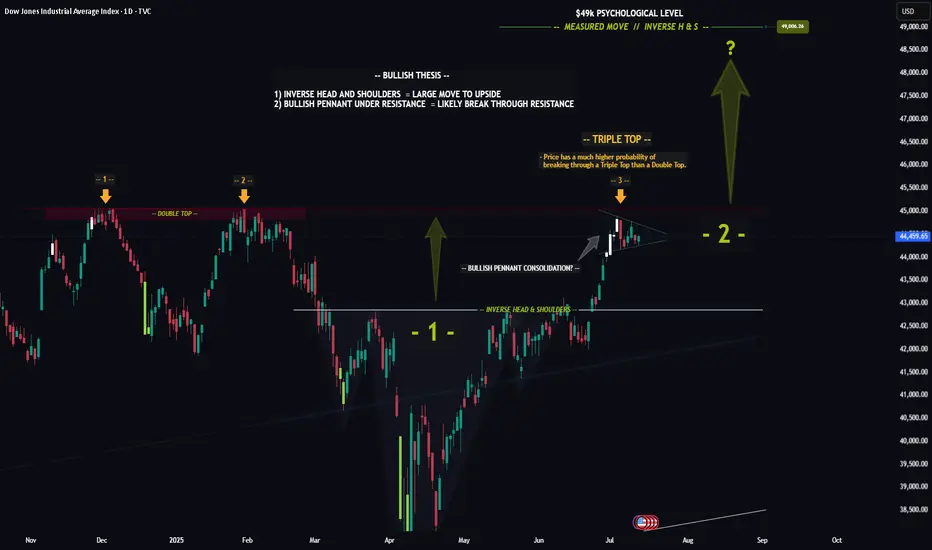
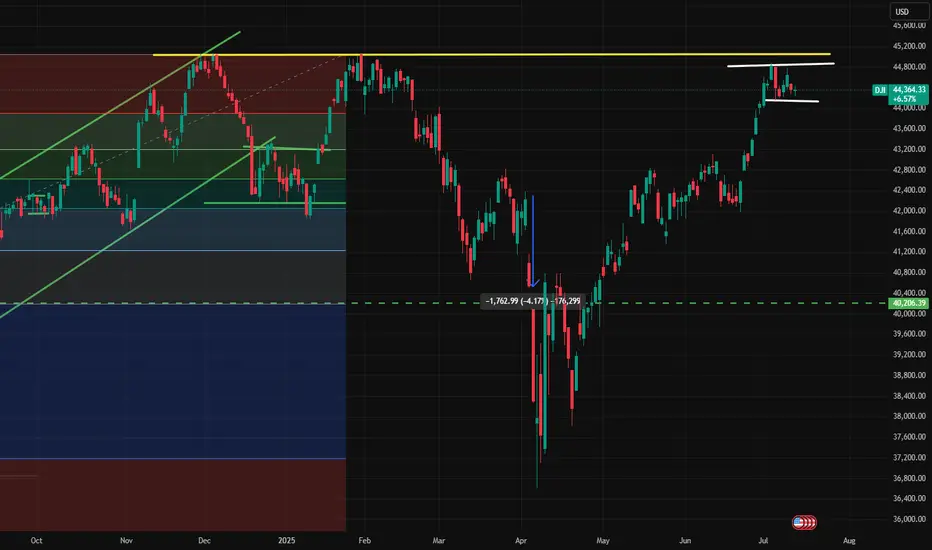
DOW (DJI) -- Preparing For The Next Big Move?Hello Traders!
The chart of the DOW is really quite incredible... Recently price formed a textbook Inverse Head & Shoulders pattern, which led to a nice nearly to the all time high. Furthermore price looks to be consolidating in a Bullish Pennant just below the all time high resistance level.
The reason the Pennant below resistance is so significant is because this signals that investors are likely preparing to drive price higher to new highs. Think about it like a fighter resting before the next big fight.
Triple Top: In addition to the pennant price has now hit this resistance level for the 3rd time. The more times price hits a level typically the weaker it gets. After the 3rd hit the chance of a breakout increases dramatically.
In Summary: The "Triple Top" in conjunction with the "Bullish Pennant" means that there is undoubtedly a very high probability that price will breakout and make new all time highs.
This post is primarily meant to be educational vs a trade idea. Its charts like this that invigorate my technical analysis side and I hope it does for you as well.
Best of luck on your trading journey!
US30 SELLWe've seen a shift on the H4
Confirmation for a swing sell
Proper risk management is advised
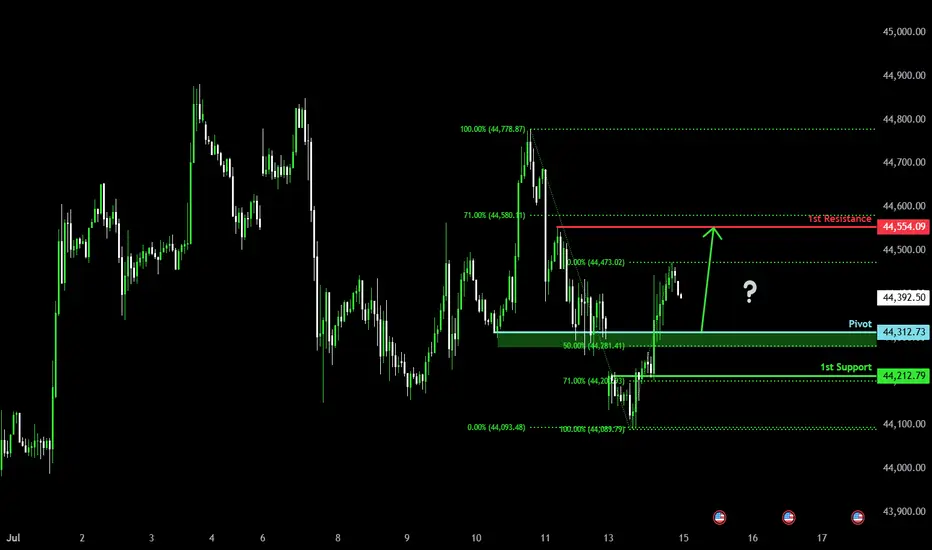
Bullish bounce off pullback resistance?Dow Jones (US30) is falling towards the pivot and could bounce to the 1st resistance.
Pivot: 44,312.73
1st Support: 44,212.79
1st Resistance: 44,554.09
Risk Warning:
Trading Forex and CFDs carries a high level of risk to your capital and you should only trade with money you can afford to lose. Trading Forex and CFDs may not be suitable for all investors, so please ensure that you fully understand the risks involved and seek independent advice if necessary.
Disclaimer:
The above opinions given constitute general market commentary, and do not constitute the opinion or advice of IC Markets or any form of personal or investment advice.
Any opinions, news, research, analyses, prices, other information, or links to third-party sites contained on this website are provided on an "as-is" basis, are intended only to be informative, is not an advice nor a recommendation, nor research, or a record of our trading prices, or an offer of, or solicitation for a transaction in any financial instrument and thus should not be treated as such. The information provided does not involve any specific investment objectives, financial situation and needs of any specific person who may receive it. Please be aware, that past performance is not a reliable indicator of future performance and/or results. Past Performance or Forward-looking scenarios based upon the reasonable beliefs of the third-party provider are not a guarantee of future performance. Actual results may differ materially from those anticipated in forward-looking or past performance statements. IC Markets makes no representation or warranty and assumes no liability as to the accuracy or completeness of the information provided, nor any loss arising from any investment based on a recommendation, forecast or any information supplied by any third-party.
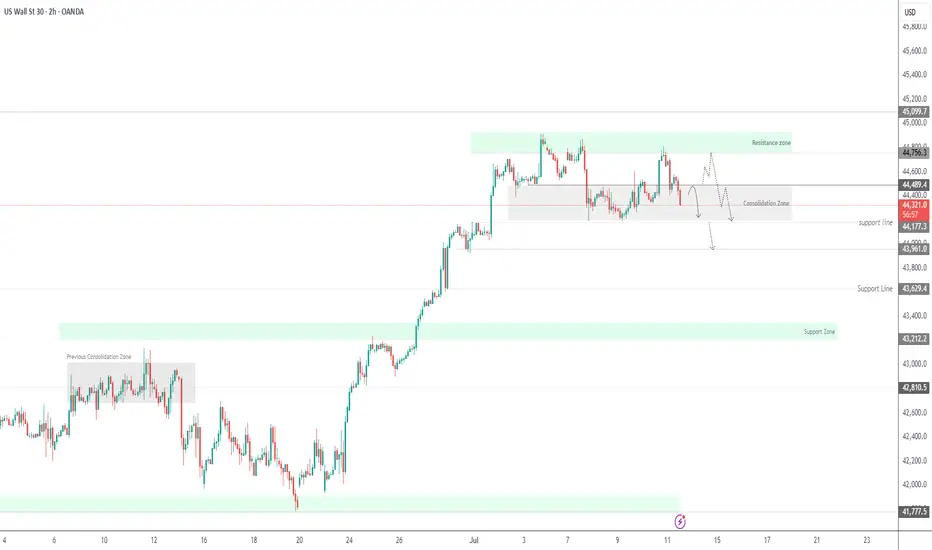
Dow Jones Technical Outlook – July 2025The Dow Jones is currently trading in a tight consolidation range just below its major resistance zone near 45,200.
After a strong bullish rally, the index is showing signs of exhaustion with lower volatility and sideways price action — forming a potential rectangle pattern. This type of structure typically signals a continuation or reversal, depending on the breakout direction.
📌 Key Levels to Watch:
Resistance: 45,200 – A breakout above this level may trigger a strong upside rally toward
Support: 44,050 – A breakdown below this can open the door for a retest of 43,200 or even 42,000.
Price is coiling — the market is waiting. The next breakout could set the tone for weeks to come.
US30 Bearish Below 44490 – Watching 44180 US30 Analysis
US30 remains bearish below 44490, with downside targets at 44180 and 43960.
A 1H close below 44180 would confirm continuation toward 43630.
To turn bullish, price must break above 44490.
Pivot: 44430
Resistance: 44460, 44550, 44760
Support: 44180, 43960, 43630
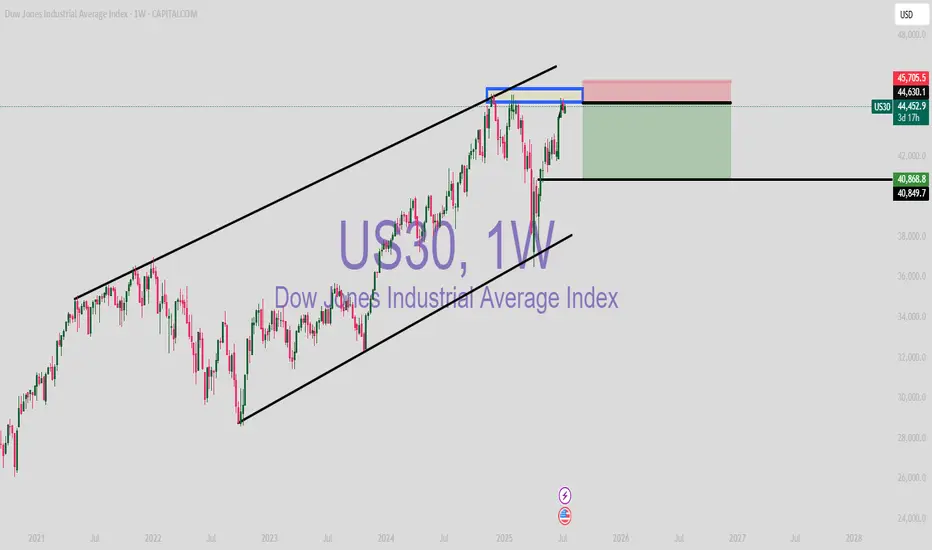
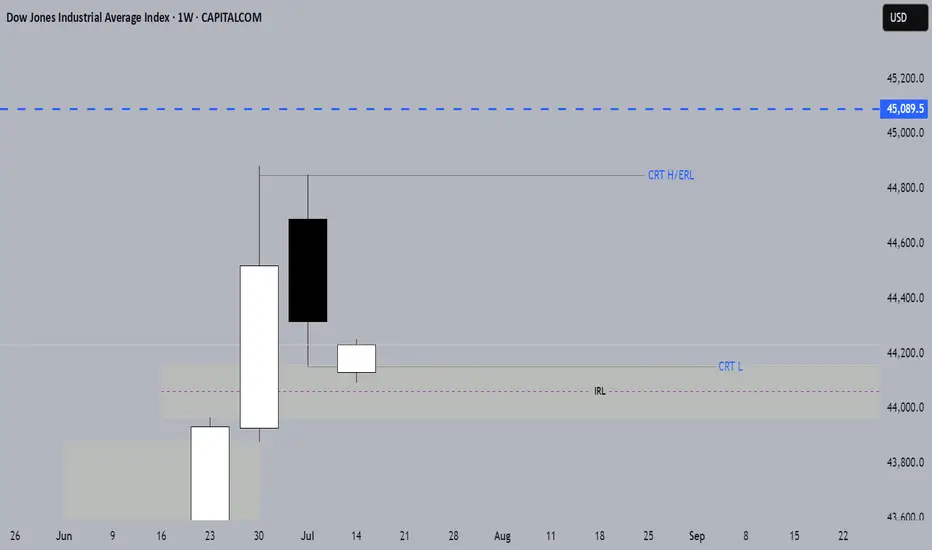
US30 BULLISH/ CRT, ERL&IRL CONFIRMATIONUS30 TO 45089.5
July is historically one of the Dow’s best-performing months.
WEEKLY CRT
IRL TO ERL
BUYTrend Line Break
Previous Day Volume
Rejection Point
Untapped Order Point
London Session
High Structure Swing
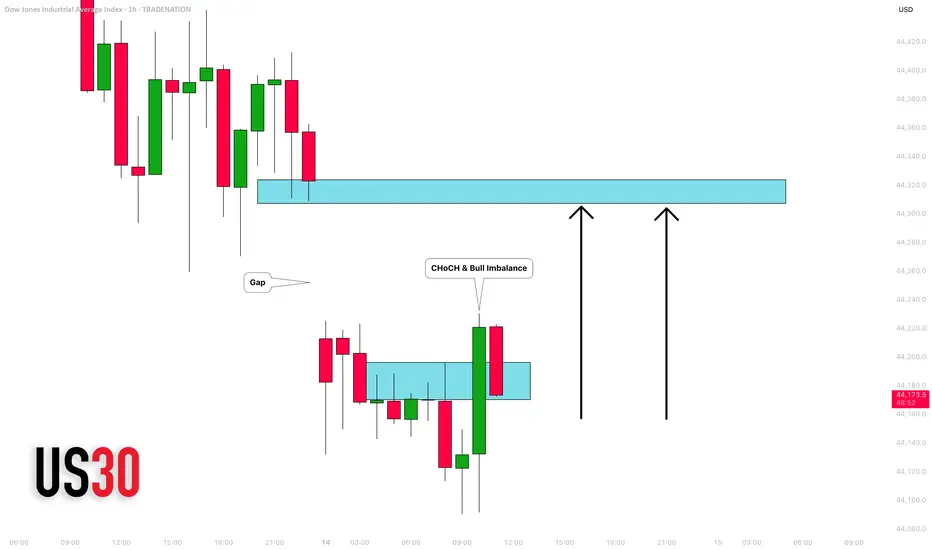
DOW JONES INDEX (US30): Classic Gap Trade
I see a gap down opening on US30 index.
As always, there is a high chance that this gap is going to be filled.
A bullish imbalance candle and a local change of character CHoCH
indicate a highly probable rise to a gap opening level.
Target - 44300
❤️Please, support my work with like, thank you!❤️
I am part of Trade Nation's Influencer program and receive a monthly fee for using their TradingView charts in my analysis.
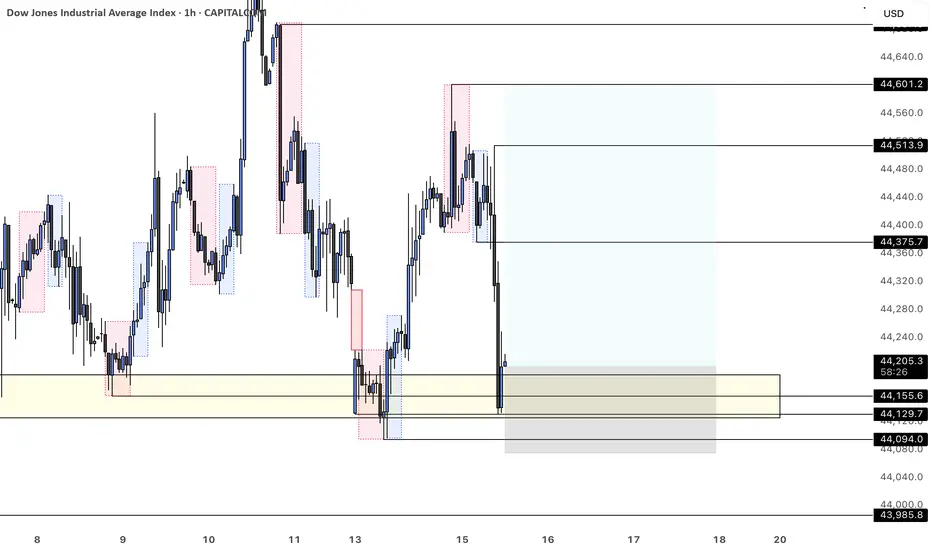
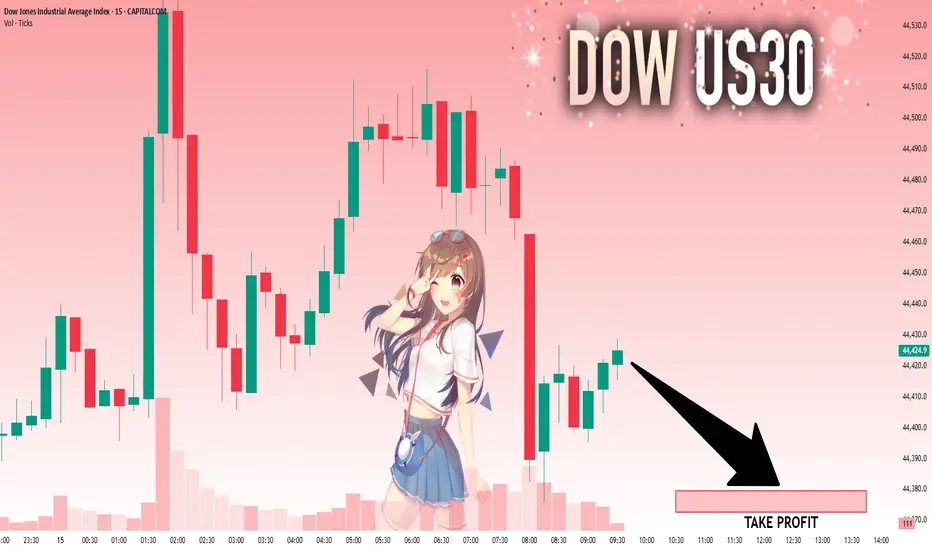
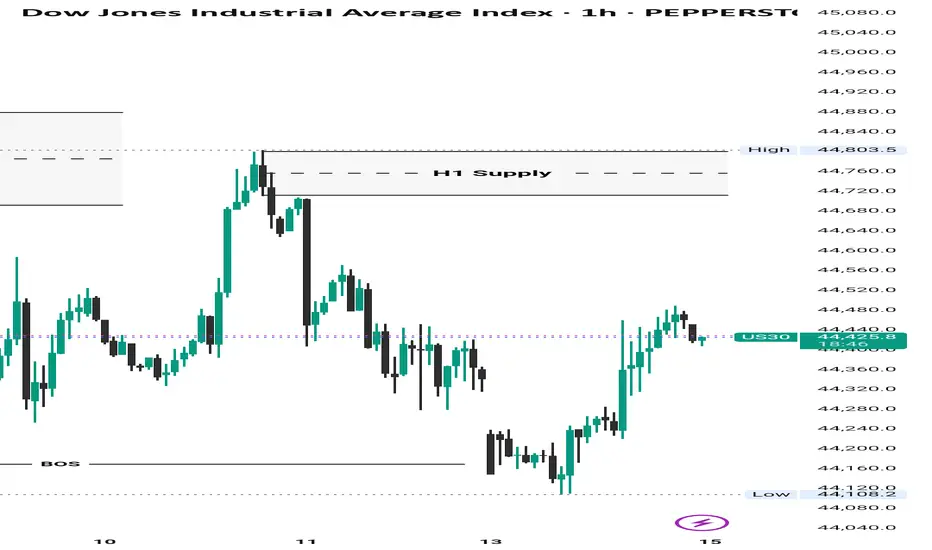
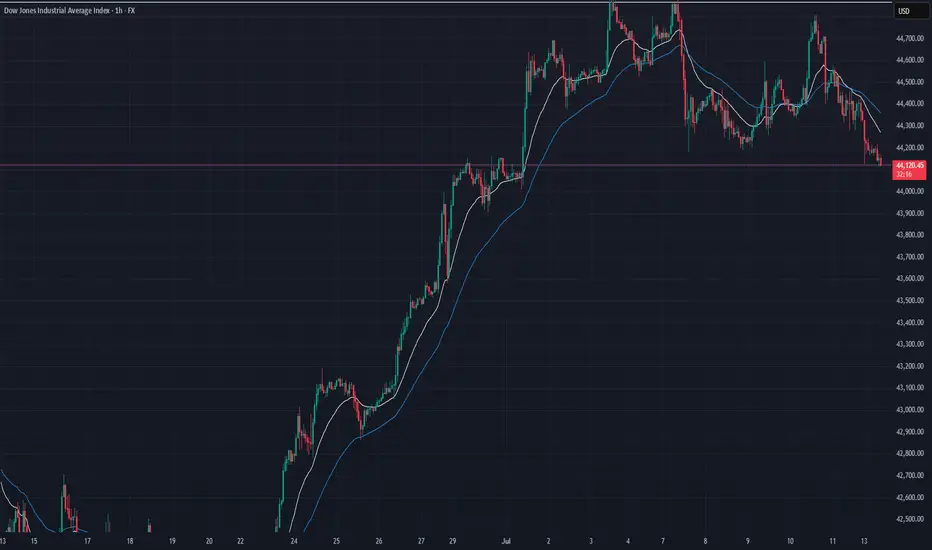
US30 Market Recap – 07/14/2025📍 US30 Market Recap – 07/14/2025
We’ve officially broken down out of the consolidation range between 44,220–44,867 📉
The structure is now shifting bearish, with price printing a series of lower highs and lower lows, and EMAs flipping to the downside. Sellers are in control heading into the week.
📊 Current Structure:
Bearish market shift confirmed below 44,220
EMAs (20 & 50) now angled downward and acting as dynamic resistance
Trendline support from June rally is broken
Last bounce attempt from 44,260 was weak and quickly faded
🔑 Key Levels:
🔽 Support: 43,800 → 43,600 → 43,300
🔼 Resistance: 44,220 → 44,400 zone
🧭 Pivot zone: Watch 44,000 psychological level for reactions
💡 Trade Setup Ideas:
🔻 Short Setup (Trend Continuation):
Entry: Retest + rejection near 44,220 or descending EMAs
TP1: 43,800
TP2: 43,600
SL: Above 44,300
⚠️ Avoid longing unless we reclaim and hold above 44,400 with strong momentum.
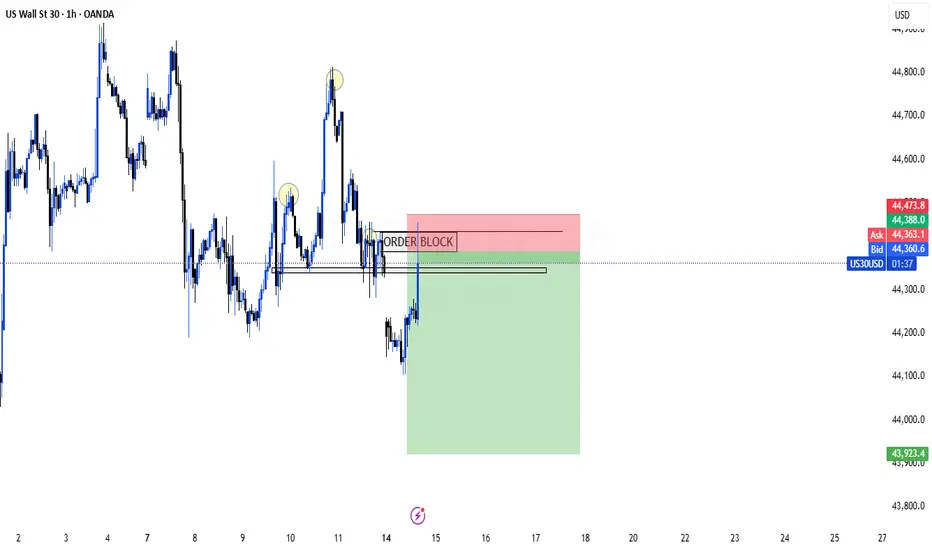
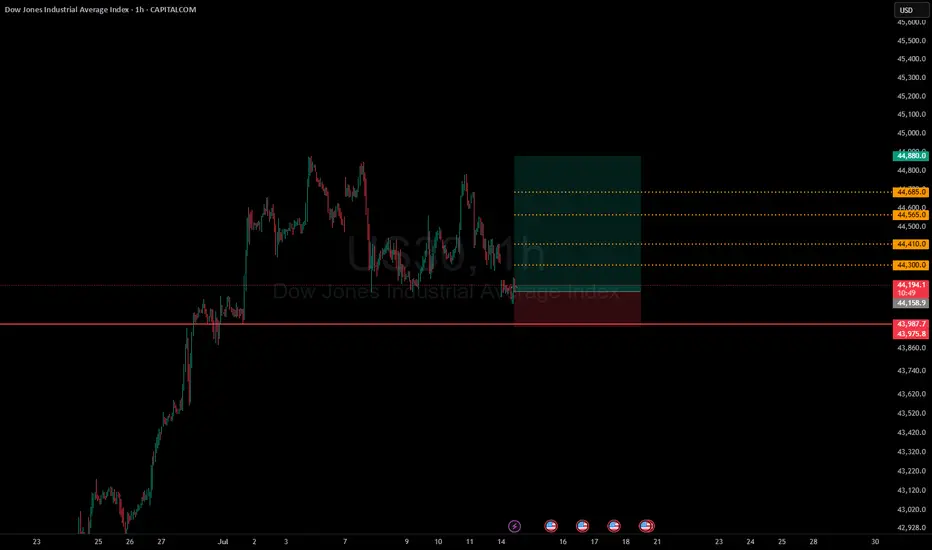
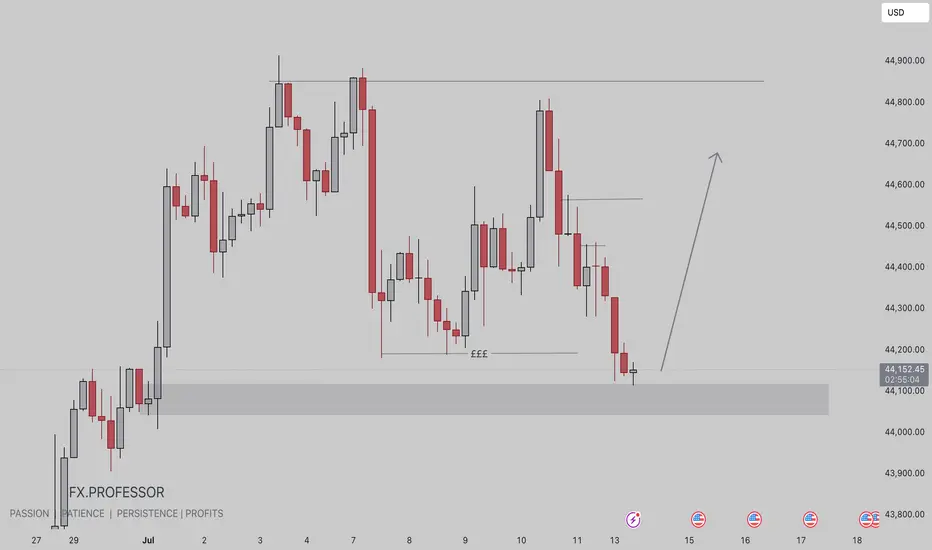
US30 BUY IDEA • Extreme Demand Zone Entry:
Price has cleanly tapped into a refined demand zone between ~44,050 to 43,994, a prime area for institutional entries. This aligns with a previous accumulation zone from late June.
• Triple Equal Lows (₤₤₤) Swept:
Clear liquidity grab beneath the equal lows, suggesting SMC-style inducement to fuel bullish orders.
• High R:R Setup in Play:
The long setup offers an expansive upside toward the 44,851 level — representing a premium retracement zone, inefficiency fill, and possible internal BOS confirmation.
14.07.25 Morning ForecastPairs on Watch -
FX:NZDCAD
FX:USDJPY
FX:EURUSD
OANDA:US30USD
A short overview of the instruments I am looking at for today, multi-timeframe analysis down to what I will be looking at for an entry. Enjoy!
