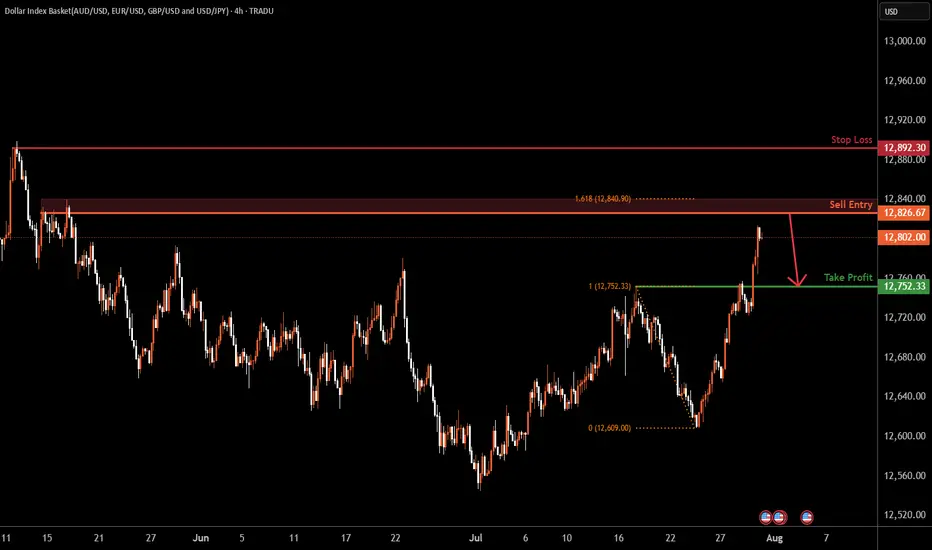
USDOLLAR H4 | Bearish reversalBased on H4 chart analysis, we can see the price rising towards the sell entry at 12,826.67, which is a swing high resistance.
Stop loss is at 12,892.30, which is a swing high resistance.
Our take profit will be at 12,752.33, which is a pullback support.
High Risk Investment Warning
Trading Forex/CFDs on margin carries a high level of risk and may not be suitable for all investors. Leverage can work against you.
Stratos Markets Limited (tradu.com ):
CFDs are complex instruments and come with a high risk of losing money rapidly due to leverage. 65% of retail investor accounts lose money when trading CFDs with this provider. You should consider whether you understand how CFDs work and whether you can afford to take the high risk of losing your money.
Stratos Europe Ltd (tradu.com ):
CFDs are complex instruments and come with a high risk of losing money rapidly due to leverage. 66% of retail investor accounts lose money when trading CFDs with this provider. You should consider whether you understand how CFDs work and whether you can afford to take the high risk of losing your money.
Stratos Global LLC (tradu.com ):
Losses can exceed deposits.
Please be advised that the information presented on TradingView is provided to Tradu (‘Company’, ‘we’) by a third-party provider (‘TFA Global Pte Ltd’). Please be reminded that you are solely responsible for the trading decisions on your account. There is a very high degree of risk involved in trading. Any information and/or content is intended entirely for research, educational and informational purposes only and does not constitute investment or consultation advice or investment strategy. The information is not tailored to the investment needs of any specific person and therefore does not involve a consideration of any of the investment objectives, financial situation or needs of any viewer that may receive it. Kindly also note that past performance is not a reliable indicator of future results. Actual results may differ materially from those anticipated in forward-looking or past performance statements. We assume no liability as to the accuracy or completeness of any of the information and/or content provided herein and the Company cannot be held responsible for any omission, mistake nor for any loss or damage including without limitation to any loss of profit which may arise from reliance on any information supplied by TFA Global Pte Ltd.
The speaker(s) is neither an employee, agent nor representative of Tradu and is therefore acting independently. The opinions given are their own, constitute general market commentary, and do not constitute the opinion or advice of Tradu or any form of personal or investment advice. Tradu neither endorses nor guarantees offerings of third-party speakers, nor is Tradu responsible for the content, veracity or opinions of third-party speakers, presenters or participants.
USDOLLAR trade ideas
DXY DOLLAONLY looking for bullish price action..
we already have a plan paitence wins the race as per 😃
USDOLLARGrounds are ready to sell USD Uh further 12 600 That's why I have posted idea to buy Euro USD pattern is same need to follow the pattern.

USD finna DROP like Crazy!!Since we have clearly rejected this resistance area, there will likely be more downward movement for the USD. search for BUYS ON EURUSD. GBPUSD. ETC..

bullish isea pf EURCHFI'm using support and resistance and the market shift structure and Order blocks and handle shoulder and the Candlestick confirmation to confirm if that the price have probability to go higher from my support

usdollarUS Dollar made a cup handle. It is currently retesting this area. It may reach the points I marked.
Dollar Index(DXY) Rebounds from Key Support–Is a New High Cominghello guys.
Let's see what happened for us index and what will happen:
Uptrend Support:
The price has been respecting a long-term ascending trendline since 2011, indicating a strong bullish structure.
Recent price action suggests that the index retested this trendline and bounced off it.
Key Resistance & Breakout Potential:
The index is in a consolidation phase after reaching a local high.
If the price holds above the trendline and breaks the previous high (~13,250-13,400), it could trigger further upside movement.
The next potential target is near 13,500-13,800 based on historical price action and Fibonacci extensions.
-------------------------------------------------
Possible Scenario:
Bullish Case: If the price holds above the trendline and breaks the current range resistance, it could continue toward new highs.
Bearish Case: A breakdown below the 12,800 support level could lead to a deeper correction toward 12,400-12,000.
-------------------------------------------------
Consequences of This Move:
For USD Strength:
A bullish continuation in the Dollar Index means a stronger USD, which could negatively impact commodities (gold, oil) and emerging market currencies.
Forex pairs like EUR/USD and GBP/USD could decline as the USD gains strength.
For Global Markets:
A weaker DXY (if the support breaks) would typically support equity markets and commodities like gold and Bitcoin, as a weaker dollar makes them more attractive.
-------------------------------------------------
Conclusion:
The chart suggests bullish momentum, but confirmation is needed with a breakout above 13,250-13,400.
As long as the price respects the trendline and Fibonacci support, the uptrend remains intact.
Keep an eye on macroeconomic events (e.g., Fed rate decisions, inflation data), as they can impact this movement significantly.


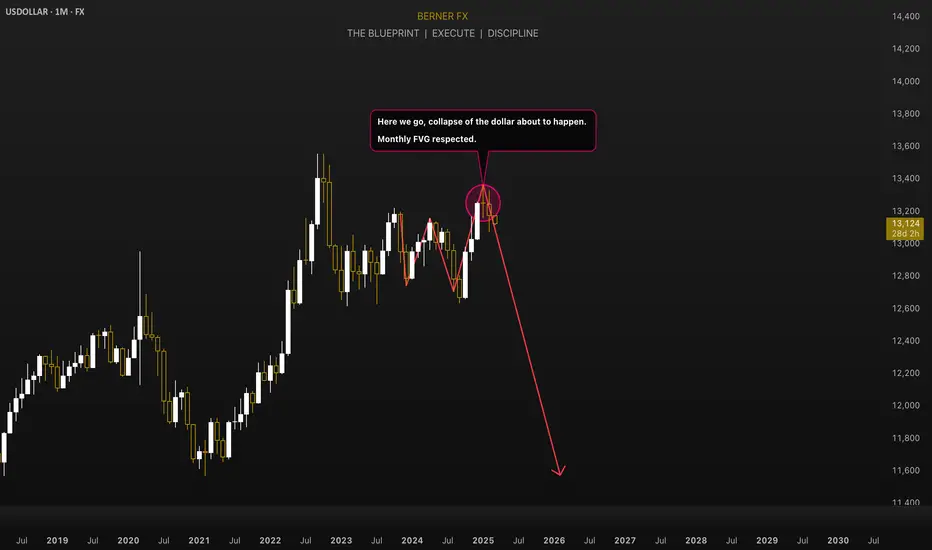
GLOBAL RECESSION IS COMING!The chart provided depicts the **US Dollar Index (USDOLLAR)** on a monthly timeframe, highlighting a bearish outlook. The analysis suggests a significant downturn in the value of the US dollar, which could have profound implications for the global economy. Here's a breakdown of how this scenario could lead to a global recession:
Key Observations:
1. Lower High Formation : The chart shows a lower high forming after a previous peak, signaling potential weakness in the dollar's long-term trend. This aligns with bearish market structure, indicating that sellers are gaining control.
2. Fair Value Gap (FVG) : The annotation mentions that a "Monthly FVG" has been respected. FVGs are imbalances in price action often revisited before continuing the prevailing trend. In this case, the FVG rejection reinforces the bearish continuation.
3. Projected Downtrend: The red arrow projects a steep decline in the US dollar's value, suggesting a collapse or sharp devaluation over the coming months or years.
Implications for a Global Recession:
1. Weaker Dollar and Global Trade : As the world's primary reserve currency, a collapse in the US dollar would disrupt global trade and financial systems. Countries heavily reliant on dollar-denominated trade or debt would face increased costs and financial instability.
2. Debt Crisis in Emerging Markets: Many emerging economies hold significant amounts of US dollar-denominated debt. A devalued dollar could lead to capital flight, higher borrowing costs, and defaults, triggering financial crises in these regions.
3. Commodity Price Volatility : Since commodities like oil and gold are priced in dollars, a sharp decline in its value could lead to extreme volatility in commodity markets, further destabilizing economies dependent on imports or exports of these goods.
4. Investor Panic and Market Sell-Offs : A collapsing dollar would likely trigger panic in global financial markets. Investors may flee to other safe-haven assets like gold or cryptocurrencies, leading to sharp declines in equity markets worldwide.
5. Global Economic Contraction: With trade disruptions, financial instability, and market volatility, global economic growth would slow significantly. Central banks might struggle to stabilize their economies due to reduced policy effectiveness amid currency turmoil.
Conclusion:
The chart's bearish projection for the US dollar suggests that its collapse could act as a catalyst for widespread economic instability, potentially leading to a global recession. This scenario underscores the interconnectedness of currencies, trade, and financial markets in shaping economic outcomes worldwide.
Dollar Index Basket Quote | Chart & Forecast SummaryKey Indicators On Trade Set Up In General
1. Push Set Up
2. Range Set up
3. Break & Retest Set Up
Notes On Session
# Dollar Index Basket Quote
- Double Formation
* 012345 | Wave Count & Entry Feature | Subdivision 1
* (Consolidation Argument)) | Uptrend Bias
- Triple Formation
* ABC Flat | Completed Survey | Subdivision 2
* Numbered Retracement | Bias On Hold | Subdivision 3
* Daily Time Frame | Trend Settings Condition
Active Sessions On Relevant Range & Elemented Probabilities;
European Session(Upwards) - US-Session(Downwards) - Asian Session(Ranging)
Conclusion | Trade Plan Execution & Risk Management On Demand;
Overall Consensus | Buy

DOLLAR INDEX BullishA good change to get long on Dollar index after breakout. Lookout for bullish entries.

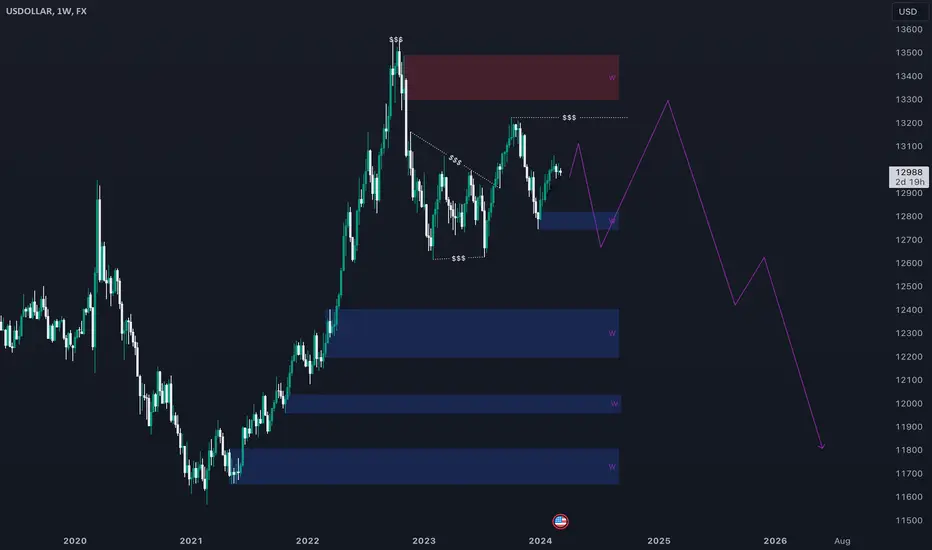
USDOLLAR, Weekly viewWeekly overview of USDOLLAR. Two liquidity zones are the next targets. I think the top one will be first filled and then the bottom one.
Dollar continued strength Not much analysis just pure price action, looks like we are going to be seeing dollar strength coming into this week

DOLLAR INDEXMy view on Dollar Index i literally see Bearish trend market had MSS it couldn't a tied bullish trend somehow the structure decided to take another route, Hopefully will do impossible.
#GOD_BLESS_YALL

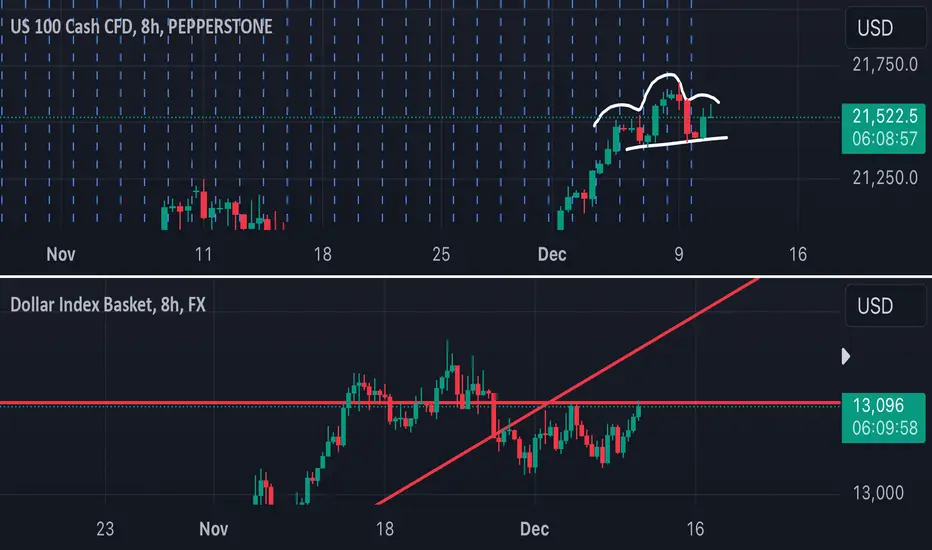
Potential Bad CPI Data recent reports have suggested that inflation is moderating but remains sticky in key areas like services. If the data shows stronger-than-expected inflation, markets could respond negatively, with expectations of prolonged restrictive monetary policy. Conversely, a softer reading could boost market optimism and ease pressure on bond yields and the dollar. Ultimately, it hinges on the components driving inflation.
Also Nasdaq looks like a h&s
US DOLLAR INDEXThis instrument has been giving us bulls for a time, now bears are in the play, lets short it in this correction phase, filter out in H4 and H1. Thank you

DXY "DOLLAR INDEX" Bank Bullish Robbery Plan To Steal MoneyHola! My Dear Robbers / Money Makers & Losers, 🤑 💰
This is our master plan to Heist DXY "DOLLAR INDEX" Bank based on Thief Trading style Technical Analysis.. kindly please follow the plan I have mentioned in the chart focus on Long entry. Our target is Red Zone that is High risk Dangerous level, market is overbought / Consolidation / Trend Reversal / Trap at the level Bearish Robbers / Traders gain the strength. Be safe and be careful and Be rich.
Entry : Can be taken Anywhere, What I suggest you to Place Buy Limit Orders in 15mins Timeframe Recent / Nearest Swing Low
Stop Loss 🛑 : Recent Swing Low using 2h timeframe
Attention for Scalpers : If you've got a lot of money you can get out right away otherwise you can join with a swing trade robbers and continue the heist plan, Use Trailing SL to protect our money 💰.
Warning : Fundamental Analysis news 📰 🗞️ comes against our robbery plan. our plan will be ruined smash the Stop Loss. Don't Enter the market at the news update.
Loot and escape on the target 🎯 Swing Traders Plz Book the partial sum of money and wait for next breakout of dynamic level / Order block, Once it is cleared we can continue our heist plan to next new target.
Support our Robbery plan we can easily make money & take money 💰💵 Follow, Like & Share with your friends and Lovers. Make our Robbery Team Very Strong Join Ur hands with US. Loot Everything in this market everyday make money easily with Thief Trading Style.
Stay tuned with me and see you again with another Heist Plan..... 🫂

DXY "DOLLAR INDEX" Bank Money Heist Plan On Bullish SideBonjour My Dear Robbers / Money Makers & Losers, 🤑 💰
This is our master plan to Heist DXY "DOLLAR INDEX" Bank based on Thief Trading style Technical Analysis.. kindly please follow the plan I have mentioned in the chart focus on Long entry. Our target is Red Zone that is High risk Dangerous level, market is overbought / Consolidation / Trend Reversal / Trap at the level Bearish Robbers / Traders gain the strength. Be safe and be careful and Be rich.
Attention for Scalpers : If you've got a lot of money you can get out right away otherwise you can join with a swing trade robbers and continue the heist plan, Use Trailing SL to protect our money 💰.
Note: If you've got a lot of money you can get out right away otherwise you can join with a swing trade robbers and continue the heist plan, Use Trailing SL to protect our money.
Entry : Can be taken Anywhere, What I suggest you to Place Buy Limit Orders in 15mins Timeframe Recent / Nearest Swing Low
Stop Loss 🛑 : Recent Swing Low using 1H timeframe
Warning : Fundamental Analysis news 📰 🗞️ comes against our robbery plan. our plan will be ruined smash the Stop Loss. Don't Enter the market at the news update.
Loot and escape on the target 🎯 Swing Traders Plz Book the partial sum of money and wait for next breakout of dynamic level / Order block, Once it is cleared we can continue our heist plan to next new target.
Support our Robbery plan we can easily make money & take money 💰💵 Follow, Like & Share with your friends and Lovers. Make our Robbery Team Very Strong Join Ur hands with US. Loot Everything in this market everyday make money easily with Thief Trading Style.
Stay tuned with me and see you again with another Heist Plan..... 🫂

Dollar IndexUS Dollar index has broken the range and now is retesting and currently rejecting.
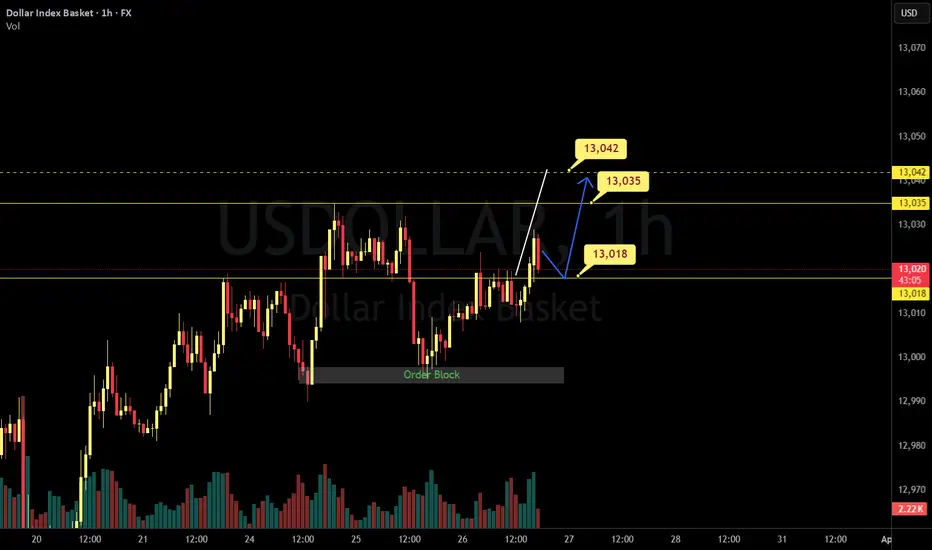
1 Hr Timeframe Dollar Index
4HR Timeframe Dollar Index
Gold 30 minute Timeframe
Gold has rejected off 2,393.72 level I am expecting go to start to move higher and the Dollar index to move lower.
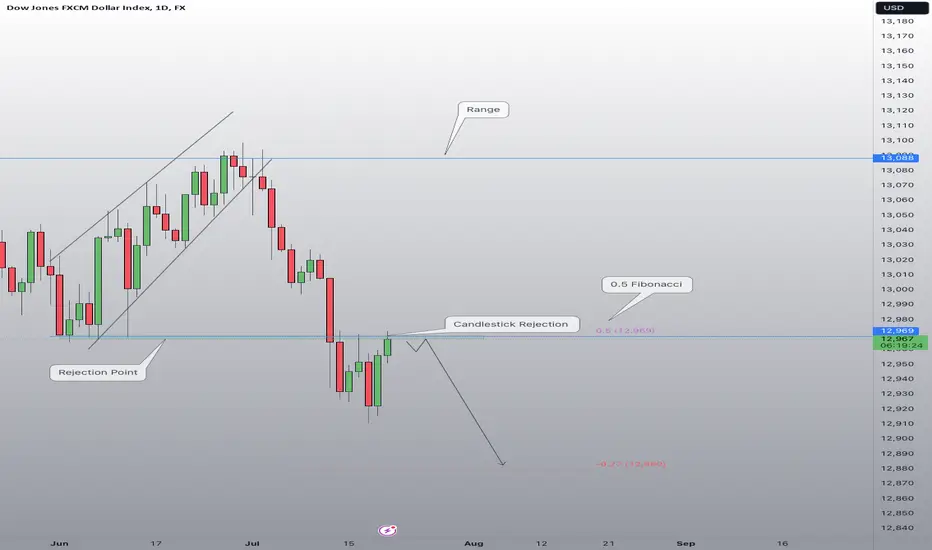
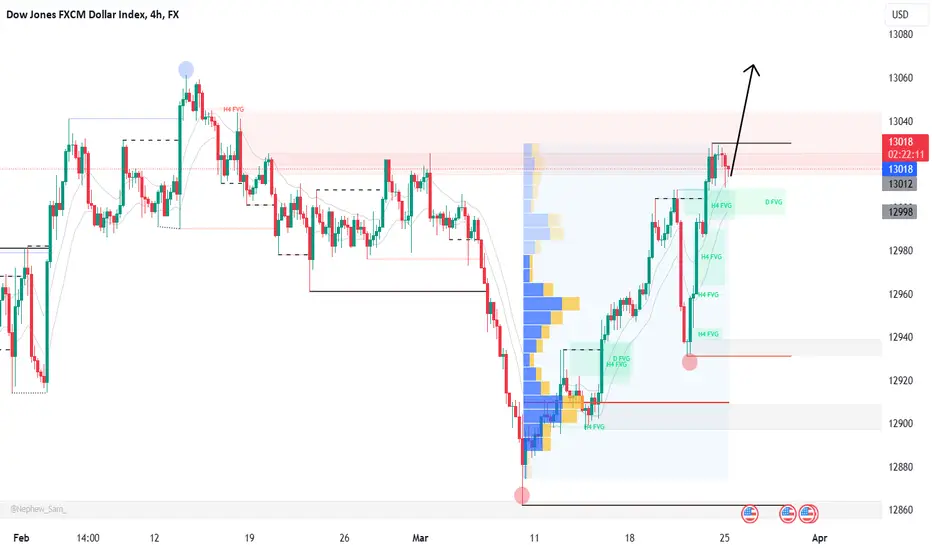
Dow Jones Dollar Index daily TF The Dow Jones has exhibited a bearish trend for the past nine days, following a break from its bullish channel. Historically, during its last two bullish channel periods, the index experienced a bearish phase lasting 7 to 8 days before finding support and moving higher. I anticipate a similar pattern this time, expecting the index to reach one of my areas of interest before initiating a downward swing. Once it undergoes a healthy pullback and begins to decline, a close below 12,963 will signal a significantly bearish outlook.

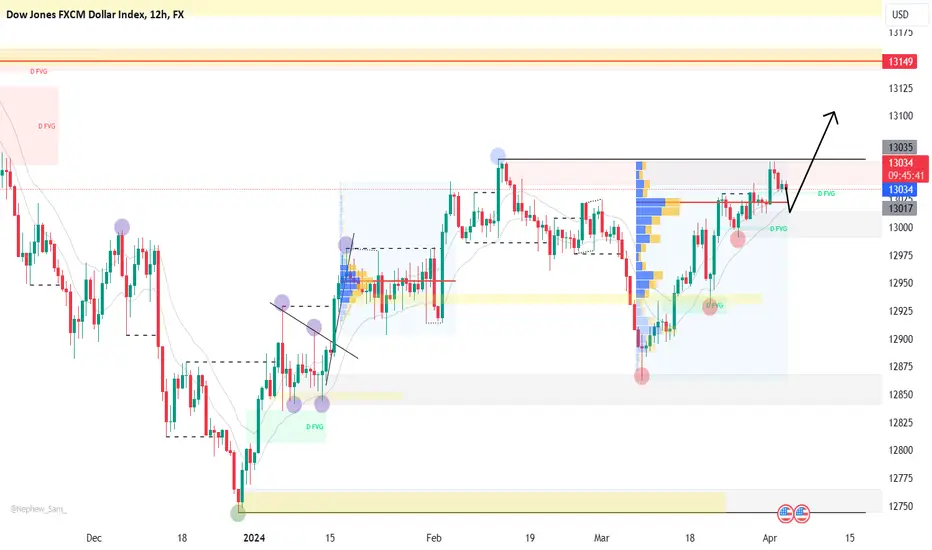
USDOLLARLONG TERM BUYS FMG TO NEXT LEVEL. Taking this position based on the upside bias that it is showing. This is a solid setup that doesn't line up all the time. So now that its hearing its time to go all out and pull the trigger :)

Dollar IndexThe dollar is consolidating today
Long structure
Liquidity selection above the previous High
The idea is still long
Late afternoon news