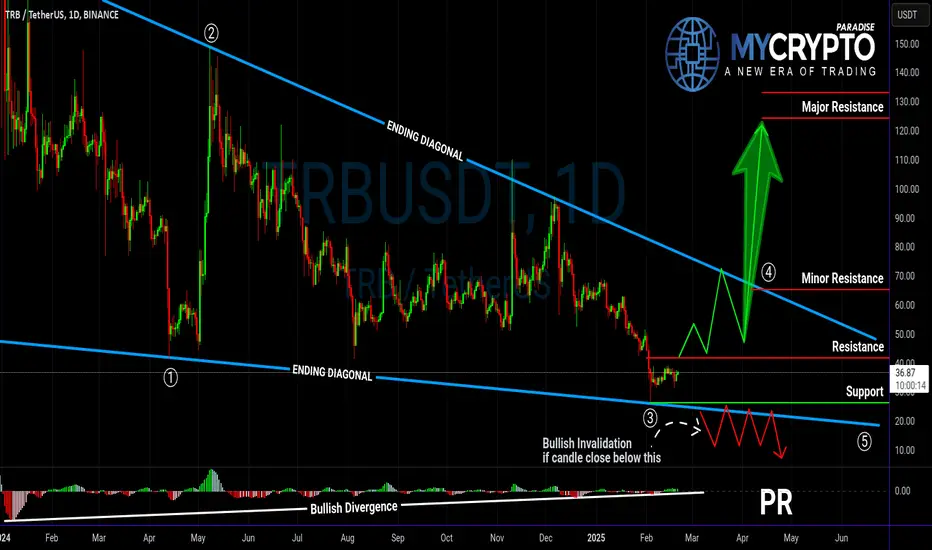
TRBUSDT on the Verge of a Major Move – Breakout or Breakdown?Yello, Paradisers! Is TRBUSDT gearing up for a bullish breakout, or is a deeper retracement coming? Let’s break it down.
💎TRBUSDT is forming an ending diagonal while showing bullish divergence, increasing the probability of an upward move. But for this bullish scenario to play out, we need confirma
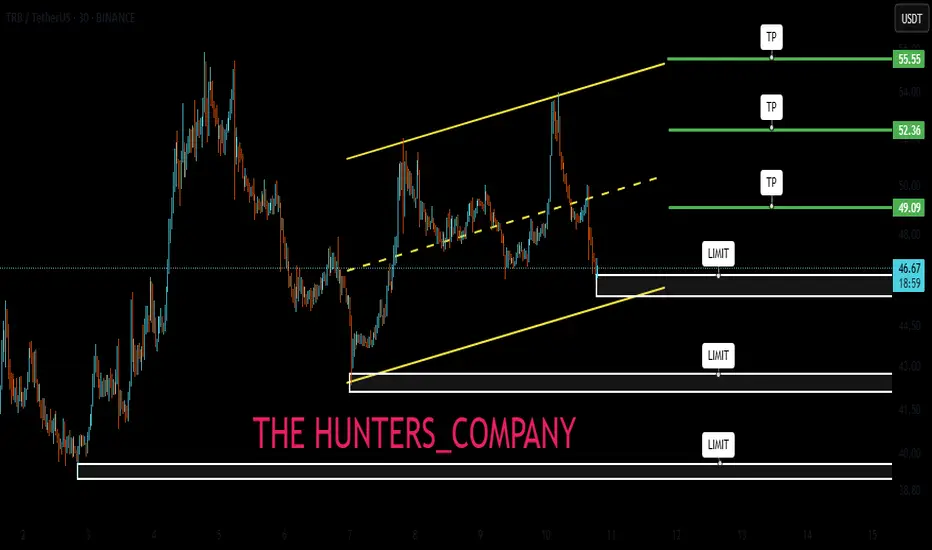
TRBUSDT / LONG / 10.06.25⬆️ Buy TRBUSDT, 10.06.25
💰 Entry: 47.52
🎯 Target: 140.12
⛔️ Stop: 39.12
Reasons for entry:
— 1D
Price in consolidation for more than 1 day
Correction to the discount zone
— 1H
Divergence in long, exit from correction
Decrease in volumes during correction
Predominance of volumes for purchase
— 1

Today's signalHello friends🙌
🔊After the good growth of this currency, you can see that the price has corrected at the top of the channel and now that we are near the bottom of the channel, there is a good opportunity to buy in stages and with capital and risk management and move with it to the specified goals.
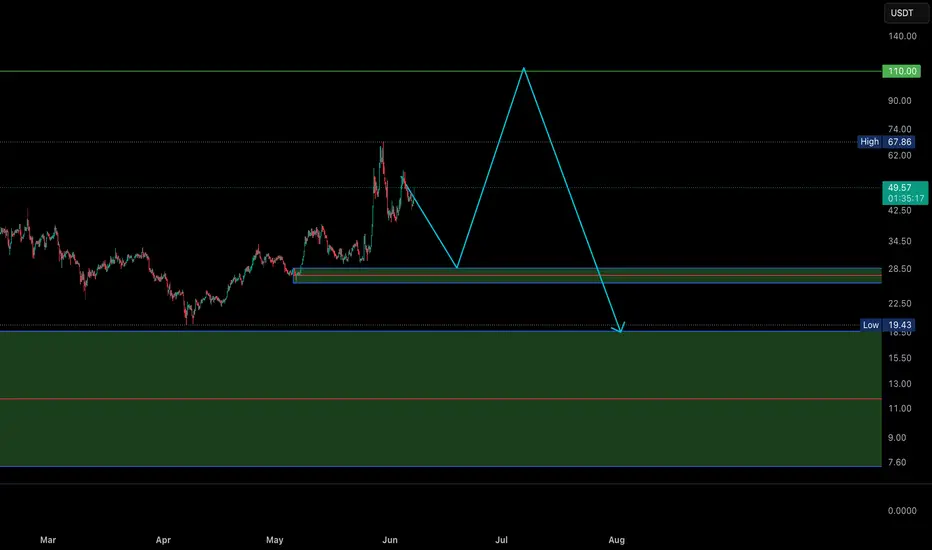
TRBUSDT - Bottom out here? What's next??#TRBUSDT ... market just near to his bottom and looking bottom out here
Keep close and if market holds his current mentioned area than we can expect a bounce from here.
Good luck
Trade wisely
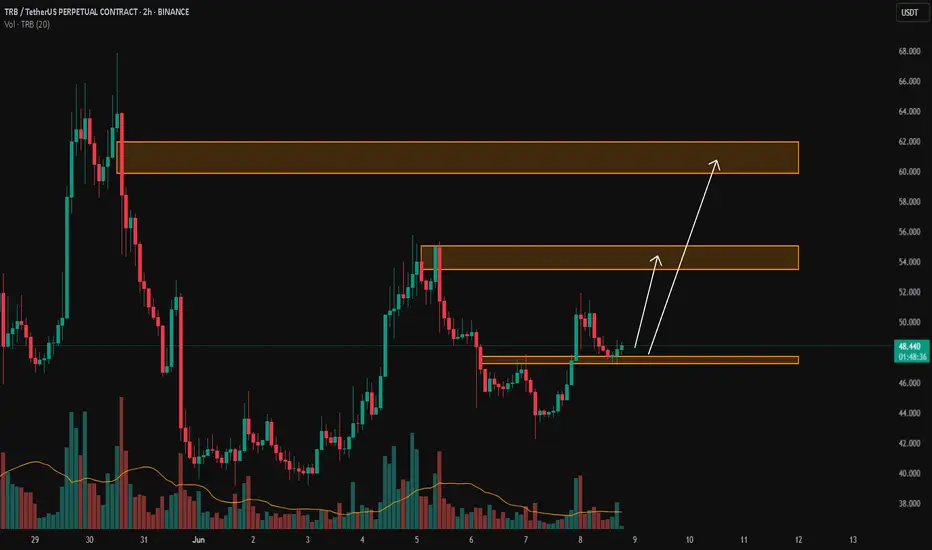
TRB/USDTKey Level Zone: 47.250 - 47.700
The setup looks promising—price previously trended upward with rising volume and momentum, then retested this zone cleanly. This presents an excellent reward-to-risk opportunity if momentum continues to align.
Introducing LMT (Levels & Momentum Trading)
- Over the p
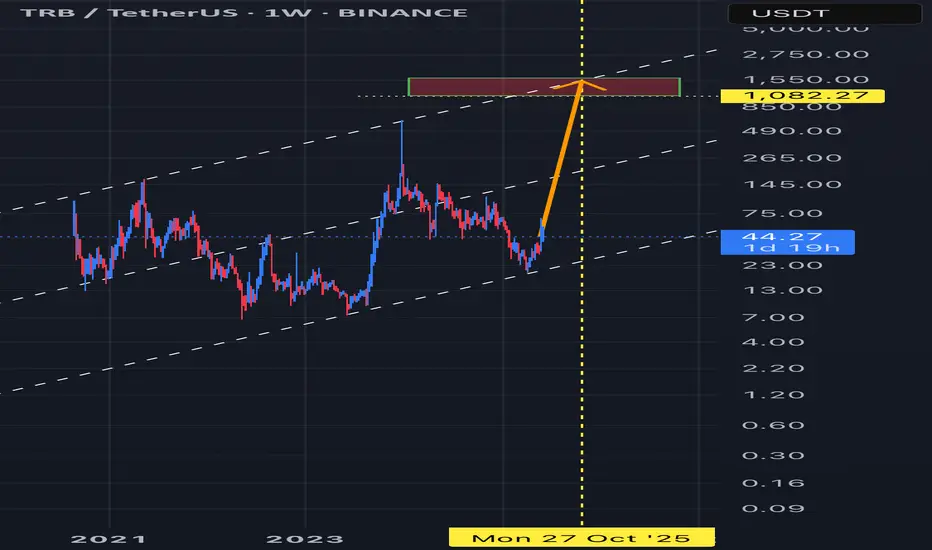
TRBUSDT weekly lookPrice is moving forward into a channel and is expected to touch higher band in few weeks
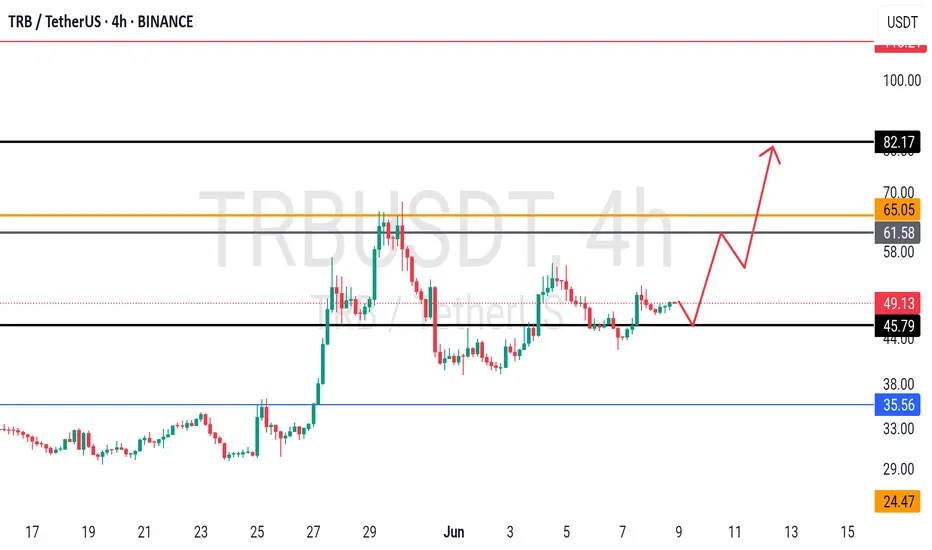
TRB/USDT – Attempting Trendline BreakoutTRB/USDT – Attempting Trendline Breakout
TRB is currently testing a key trendline resistance and attempting a breakout. If the price manages to break and hold above the trendline with strength, it could trigger a bullish move.
A confirmed breakout may lead to a 15–30% bounce in the short term.
Ke

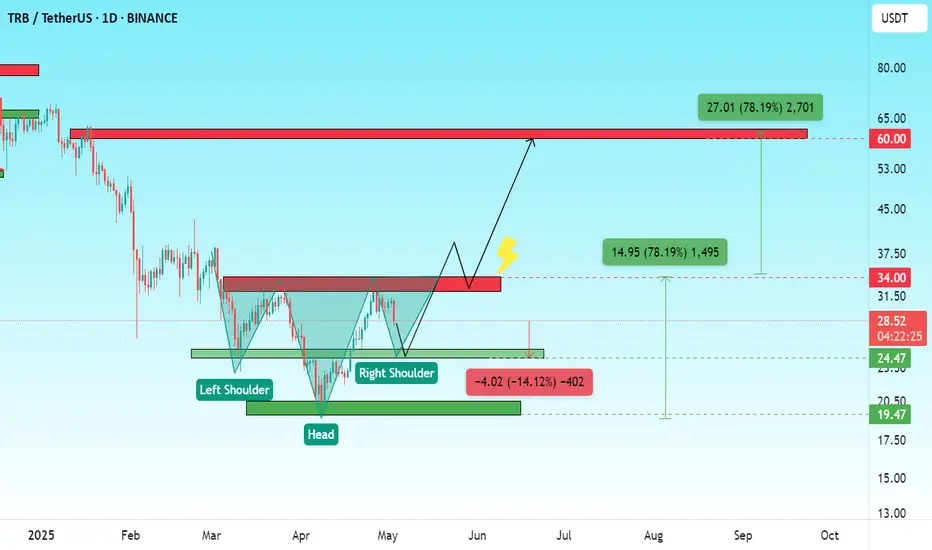
Technical Analysis: TRB/USDT – 1D Timeframe📌 Technical Analysis: TRB/USDT – 1D Timeframe
🟢 Reversal Pattern: Inverse Head and Shoulders
A classic Inverse Head and Shoulders pattern is clearly visible on the chart, which typically signals the end of a downtrend and the beginning of a strong upward movement.
Head: Formed near the strong sup
TRB/USDTKey Level Zone: 43.500 - 43.900
HMT v8.1 detected. The setup looks promising, supported by a previous upward/downward trend with increasing volume and momentum, presenting an excellent reward-to-risk opportunity.
HMT (High Momentum Trending):
HMT is based on trend, momentum, volume, and market str

See all ideas
Summarizing what the indicators are suggesting.
Oscillators
Neutral
SellBuy
Strong sellStrong buy
Strong sellSellNeutralBuyStrong buy
Oscillators
Neutral
SellBuy
Strong sellStrong buy
Strong sellSellNeutralBuyStrong buy
Summary
Neutral
SellBuy
Strong sellStrong buy
Strong sellSellNeutralBuyStrong buy
Summary
Neutral
SellBuy
Strong sellStrong buy
Strong sellSellNeutralBuyStrong buy
Summary
Neutral
SellBuy
Strong sellStrong buy
Strong sellSellNeutralBuyStrong buy
Moving Averages
Neutral
SellBuy
Strong sellStrong buy
Strong sellSellNeutralBuyStrong buy
Moving Averages
Neutral
SellBuy
Strong sellStrong buy
Strong sellSellNeutralBuyStrong buy
Displays a symbol's price movements over previous years to identify recurring trends.