TRB/USDT Analysis: Anticipating a Potential 15-30% Price RecoverIn this Trading View analysis, we explore the outlook for the TRB/USDT trading pair. Please note that the following content does not constitute financial advice; thorough research and personal diligence are essential.
After careful analysis, it appears that TRB/USDT is presenting an optimistic opportunity for a substantial price rebound. With the potential for a 15-30% increase, our analysis highlights key indicators supporting this prediction.
However, it is important to emphasize that this analysis is for informational purposes only and should not be considered as financial advice. We encourage you to conduct your own research (DYOR) and exercise caution in making trading decisions.
Remember, market conditions are subject to change, so it is vital to monitor the pair closely and stay updated on relevant news and developments. Trade responsibly and at your own risk.
TRBUSDT trade ideas
TRBWe stood for the second time at 2990₽ and we can’t go higher.
The patterns of the golden cross and triangles have already been fully worked out, the moving averages are tightening up, there is a local maximum zone again, what next?
On the short-term chart, the asset has almost completely completed the symmetrical triangle pattern, approaching the local resistance level (previous highs), and the rollback from this level is also within normal limits.
I expect a rollback to 2800~2850₽, then go through the local maximum and resistance zone 3 times (I see it at the level of 3017.5₽).
By the end of the year there is a great chance to reach 3100 rubles, and the prospect of growth up to 3300 rubles
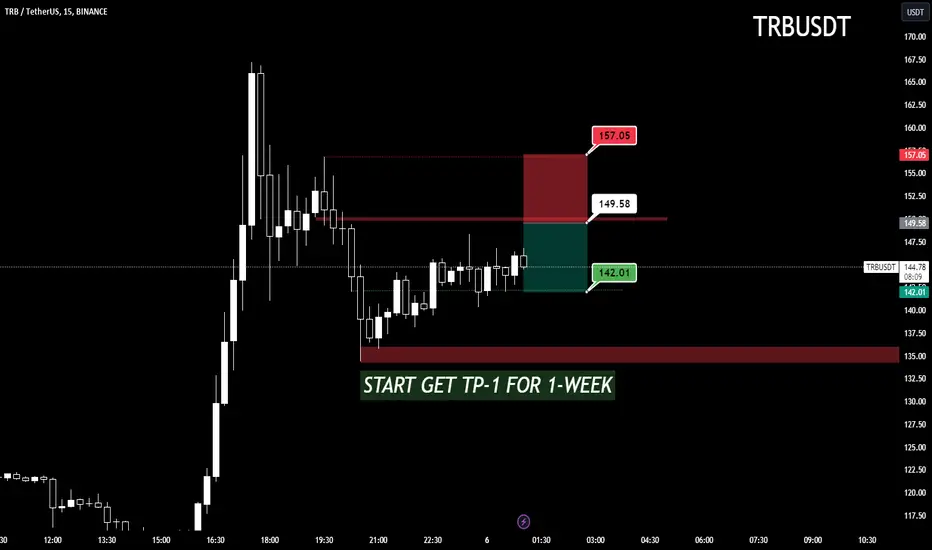
START GET TP-1 FOR 1-WEEK AT (TRB)📊Analysis by AhmadArz:
Back to break in low of bear-candle
🔍Entry:149.58
🛑Stop Loss: 157.05
🎯Take Profit: 142.01
🔗"Uncover new opportunities in the world of cryptocurrencies with AhmadArz.
💡Join us on TradingView and expand your investment knowledge with our five years of experience in financial markets."
🚀Please boost and💬 comment to share your thoughts with us!

Mock Up Price Action for TRBUSDT | Near Term (12HR)Mock Up Price Action for BINANCE:TRBUSDT | Near Term (12HR)
- Watching and waiting for an opportunity to enter short
- Not saying I will, but, if I were to, these are the price points I'd be looking at to re-enter a short position on TRB. Whale addresses have gone down significantly in last pump. It is a much safer proposition now to enter short at normal resistance points IMO.
Personal Approach & Base Chart Setup
- Stacked Parallel Channels for Grid of Confluence Points
- High Time Frame (HTF) Fib Extensions, Retracements, & Time Cycles
- Red Filled Horizontal Rectangles between areas of major Fib level from Extensions and Retracements
- Price Label Callout with Red Circle highlighting points of interest where I'd consider making a trade
- I will consistently monitor and adjust taking into consideration long/mid/near term price action and market conditions/news

Mock Up Price Action for $BINANCE:TRBUSDT | Near Term (2HR)Mock Up Price Action for BINANCE:TRBUSDT | Near Term (2HR)
- Watching and waiting for THE opportunity to enter short
- For TRB, I believe this is our next whale play market manipulation pump and dump. I think that it is going to surprise a lot of people just how quickly, hard, and high this will go (Think BINANCE:GASUSDT from the other month). I am anticipating that all of the whales that accumulated at $15 from 4 months ago, holding 76% of the token supply, and that for these last couple of months have moved large portions back onto exchanges staging their holdings in order to make a big play, are going to perfectly time purchases at key points to create bullish patterns and 'breakout' conditions, climbing up and up, short squeezing stop hunting and liquidation hunting across the board before suddenly rug pulling everything taking profits and causing a massive sell off and dump of TRB.
Personal Approach & Base Chart Setup
- Stacked Parallel Channels for Grid of Confluence Points
- High Time Frame (HTF) Fib Extensions, Retracements, & Time Cycles
- Red Filled Horizontal Rectangles between areas of major Fib level from Extensions and Retracements
- Price Label Callout with Red Circle highlighting points of interest where I'd consider making a trade
- I will consistently monitor and adjust taking into consideration long/mid/near term price action and market conditions/news
Additional Remarks
Still watching and waiting for a movement like this before I consider entry into short. My most likely scenario to play out will be continued BTC ETF approval speculation and hype driven bullish pump for market leading into SEC decision, then upon the news dropping good or bad (IMO likely good and green light ETF approvals), a "buy the rumor sell the news" short term healthy pullback for the market. BTC has run for the past couple months and so in January my anticipated small/normal pullback correction and people taking profits playing to the buy the rumor sell the news.. Which this in my observation would initially present like a panic sell off of everything, but once folks realize BTC isn't going into the dirt and things stabilize out, range and accumulate, then ETH to take a turn in February next, before then the ALTs February into March. Money flowing from Large to Mid to Small to Micro cap as is the natural progression of things. And in March with the market having confirmed recovered and run bullish for all this time, some kind of bullish recovery top and then massive cascading dump leading into the BTC Halving event March through April, pulling back hard recovering, then May the beginning of a steady climb up and true bull cycle. I'm not chasing anything right now, as I believe its too risky to assume one way or the other. I Entered the market and made my trades October through November and essentially pulled out of all short term speculative positions/trading. I am now taking the opportunity to observe the market, watchlist and monitor the winners and price actions, map out potential bullish and bearish targets, and simply patiently wait for whatever this correction / crash / rug pull moment before cherry picking re-entering the market in earnest. Until then I will simply take advantage of quick trades in and out, in parallel to just accumulating my mid to long term bags of things I actually believe in like OKX:CSPRUSDT and BINANCE:XRPUSDT

TRB/USDT Looks Bullish 🚀📈 TRB/USDT Looks Bullish 🚀
👉 TRB/USDT
I am anticipating the price to soar once more from this solid support. 📈 My target range is 50-100% gains. Let's wait and watch how it unfolds. 🧐
⚠️ Please note that this is not financial advice. 🚫 Make sure to do your own research (DYOR) before making any investment decisions. 💼

funny but realli have shown everything you need to know this is not a trading advice ... this is just a my own opinion .....

trbMany people asked questions about this currency. The price must reach an equilibrium state after an increasing state. Therefore, the green box is an important part of the state of excellence that should not be lost, otherwise it can also fall to the bottom line. At the same time, with We have those two resistance boxes that need to be seen if they break or not

TRB - reversalTRB starting to reverse with potential resistance in purple but I think will at least hit $400.00; cant tell what will happen after $400 so play safe!

jeffans: TRBUSDT +46% longTRBUSDT painted such a nice classical cup and handle pattern, with +almost 50% move ahead.
📈 TRB/USDT Trading Signal Alert! 🚀Current Price: $248.39
🎯 Targets:
T1: +4%
T2: +10%
T3: +14%
🛑 Stop Loss: -2%
🔍 I've observed that TRBUSDT is anticipated to increase by 14% in the next few minutes. Here are three targets to keep in mind for this signal.
TRB to reclaim $500 markTRB. The MVP for this bull run w/o a doubt has received a lot of attention considering the big break to $600 before falling back down to $186. Notice momentum has subsided from the sellers and after a massive liquidity sweep into the new year, I expect TRB to settle around $440 before the month ends.

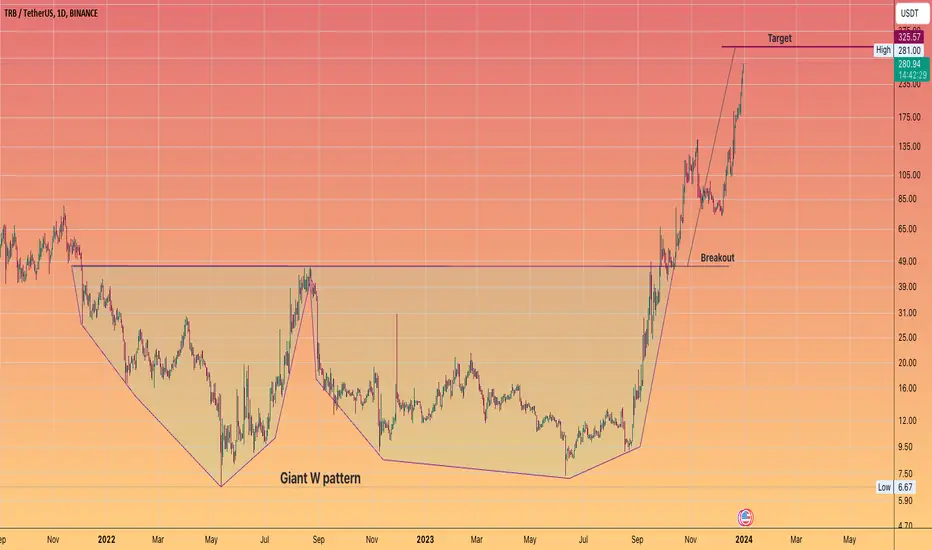
Tellor #TRB is up over 30X straight upCongratulations if you spotted that W pattern and manage to ride this rocket.
I have provided a log target if you are still participating!
If you haven't been winning on this coin...
The risk reward does not favour getting involved IMO
Big D and B formationHuge dick and balls formation on the 15min chart CRYPTOCAP:TRB
Possible green erection coming if we can shoot up past the tip. Keep an eye on it for giant long.

TRB Short Setup[Risky]Here's my Idea about TRB Short. Also be careful with leverage Cause It's too me voletile
Entry - 190-200$
SL - 205-206
Target - 180, 150$

TRB accumulatingAfter going till 500+ TRB ies back on accumulation zone. you can see our three slim lines. And if it stays above the upper line then next resistance is that white line. You may have lost money in crypto but this is a fine opportunity for your risk with reward. DYOR

Mock Up Price Action for TRBUSDT | Mid Term (12HR)Mock Up Price Action for BINANCE:TRBUSDT | Mid Term (12HR)
- Watching and waiting for opportunity to enter short
Personal Approach & Base Chart Setup
- Stacked Parallel Channels for Grid of Confluence Points
- High Time Frame (HTF) Fib Extensions, Retracements, & Time Cycles
- Red Filled Horizontal Rectangles between areas of major Fib level from Extensions and Retracements
- Price Label Callout with Red Circle highlighting points of interest where I'd consider making a trade
- I will consistently monitor and adjust taking into consideration long/mid/near term price action and market conditions / news

Why BITCOIN ain’t going to 100k by 2024Evening fellas, and happy new year.
I figured I’d leave a final post to wrap up the year and throw a cold bucket of water at some people out there.
This right here, is the reason Btc ain’t going to 100k next year or anytime soon.
Impossible.
I didn’t long, I didn’t short this coin I missed out both ways, but check it for your own sake and let me know what you think.
I ain’t god, just a simple trader making his little money here and there but when it comes to trust, I trust myself only. And not the idea that btc and the crypto decentralized market fails to provide.
Trade thirsty.

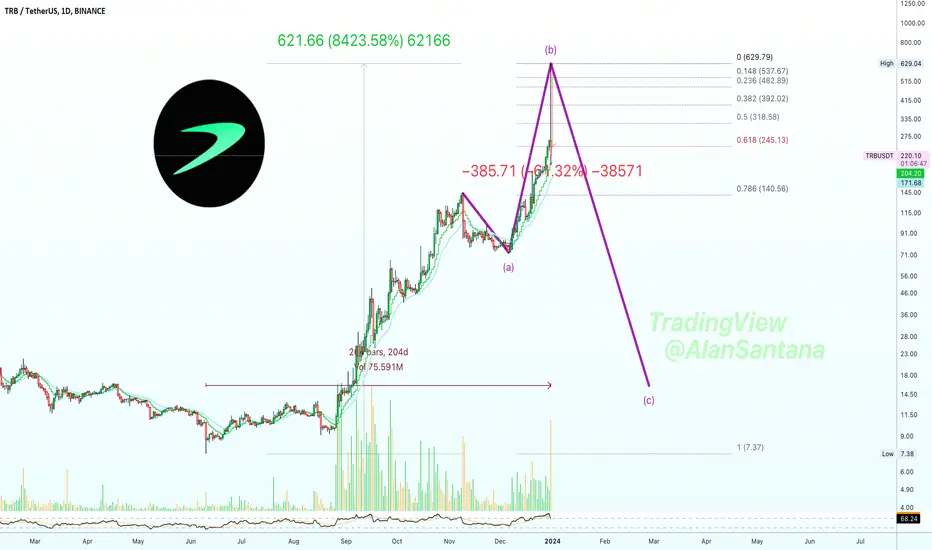
✴️ Tellor Grows 8,423% Within 204 Days...What lessons can we learn from this one?
What information can we extract in preparation for what is coming to the rest of the Cryptocurrency market?
Believe it or not, this new ATH/High/Peak is part of the correction; an irregular correction.
✔️ The first thing to learn is that Cryptocurrencies cannot be underestimated.
✔️ The second thing is that is clear is that this pair is highly manipulated.
It would be really hard to catch the top if not impossible... It's been only 1 hour since the top hit and it is already 60% down... Crazy! (Even more as I write/publish this.)
We know the next Cryptocurrency bull-market is going to be ultra-strong, but we know this even before seeing this chart.
The main lesson we can extract from this one is to aim high!
But planned, because greedy can cause a big win to turn into a nasty loss.
This pair is very likely to start a massive correction... What does this say about the rest of the market?
Namaste.
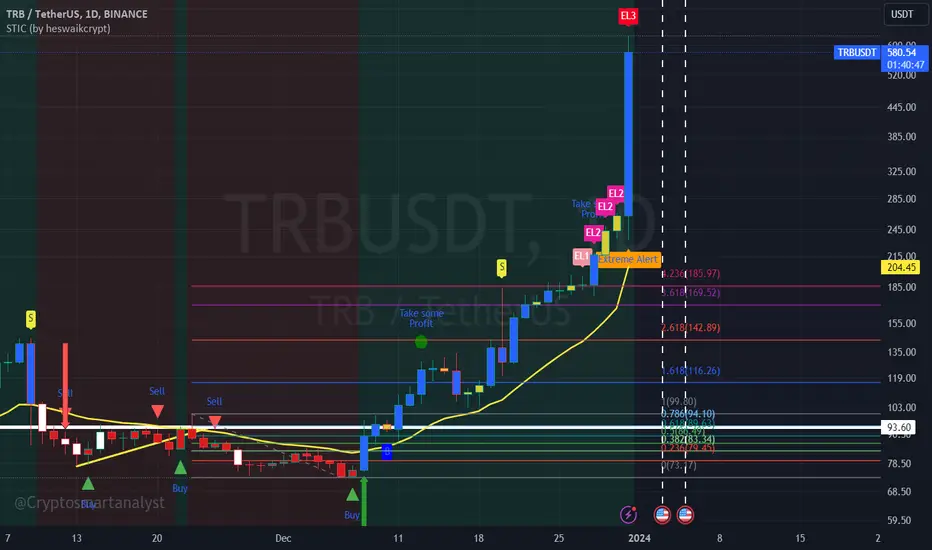
TRB Special extreme alert on STIC indicatorThe STIC indicator is showing Ectrem level 3 and a special extreme alert on the daily timeframe. Even though long-term it is bullish, I will still expect a potential minor or major correction.
Trade smart and wait for a retest of the market flip line before you consider FOMO long again. protect your profit, I will say.
TRBUSDT About To Hit New ATH!TRBUSDT formed a cup and handle pattern on the daily chart, with price nearing the neckline. The $164 level, a previous ATH resistance, awaits above. A breakout could trigger a significant bullish move for TRB.
Buy zone : Below $120
Stop loss : $88
Take Profit 1: $160.00
Take Profit 2: $220.00
Take Profit 3: $400.00
Regards
Hexa

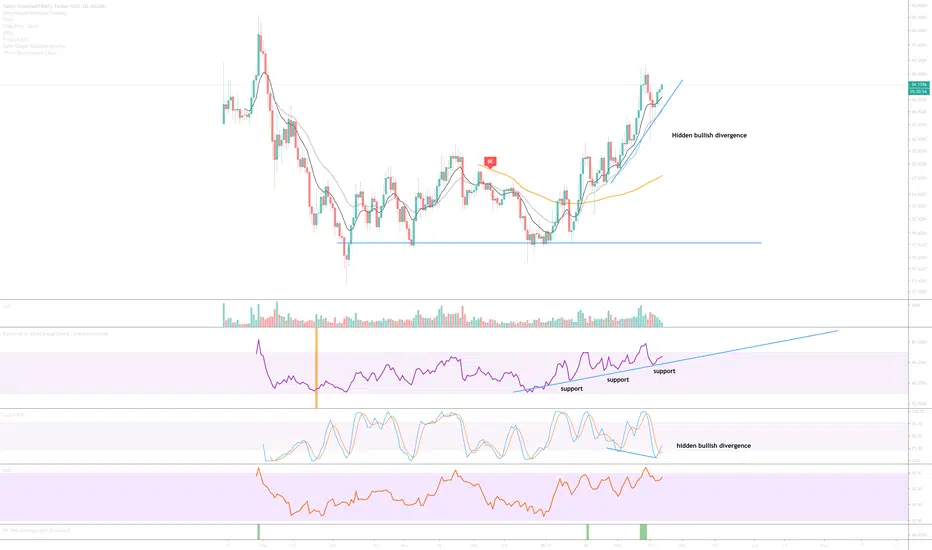
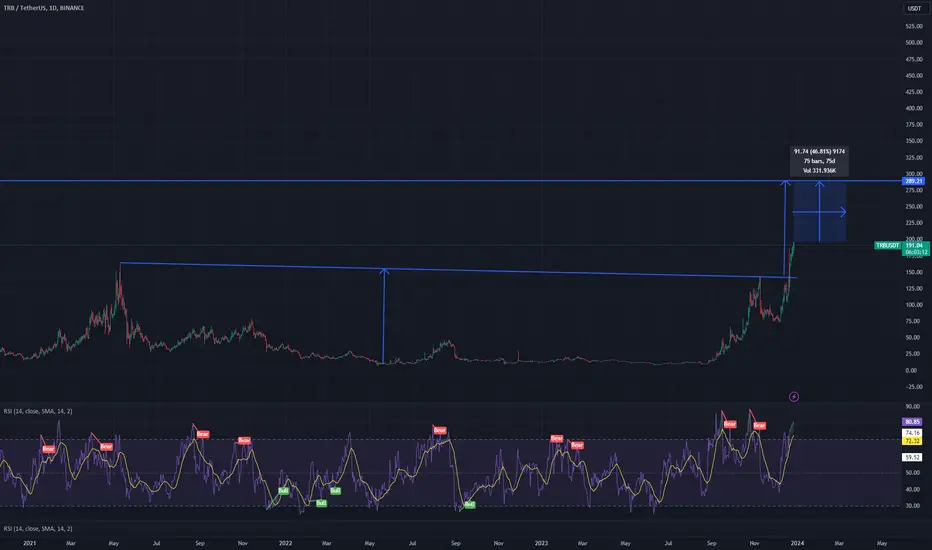
Tellor (TRB) / USD - Hidden bullish divergenceThe market seems to be effervescent all of a sudden. What pops next?
A number alt coins are showing overbought conditions, nothing is oversold at the moment. So what do I do with my profits from something that is knowingly overbought? (Dogecoin I’m thinking of you).
That answer is I move profits into the next most bullish looking position that is yet to become overbought. It is not easy to do, however, if you ignore emotion you can really magnify your overall gains.
On the above daily chart there is a Hidden bullish divergence in price action with the oscillators. A lower low in Stochastic RSI as price action move higher = bullish.
Furthermore RSI support was recently confirmed again for the third time in as many weeks. This support looks set to continue through until the month of May.
On the weekly chart below, still some hours until close, however watch closely - not many alt coins are looking this bullish. Should the weekly candle close such as it looks now with little to no shadow above (wick above candle body) - it suggests to me a strong move to the upside will be next.
1st target $76
2nd target $140