TRBUSDTmy entry on this trade idea is taken from a point of interest BELOW an inducement.. just a trade idea, not financial advise
TRBUSDT trade ideas

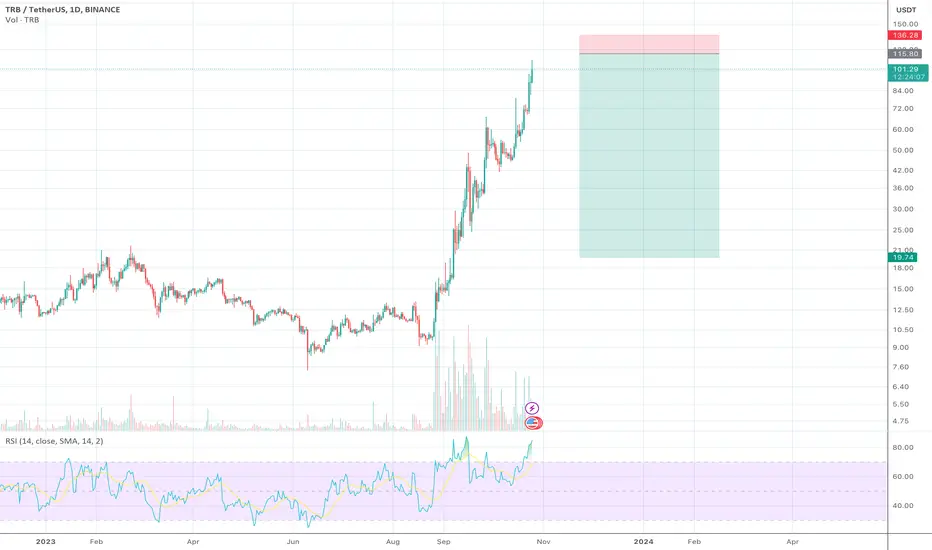
TRB CAN FALL SAME AS SOLANA AND BNX DID.. Below $100Thanks for reading this update, remember that this update is not trading advice, but a chart view of what we expect.
We expect that TRB is going to break down in the coming time, there is nothing riskier in trading than the fomo volume. We have added before about the increased volume since this coin is a t $48 , the most TRB Volumes that are running now are from Bika . And Bika is not a holding platform. Binance was also the top holder of BNX..
By this previous update, we did expect an increase before it happened from $48.
Since today and depending on our study on this coin seems that it has a high chance of falling, we expect that it can fall below $100
The same effect that BNX and Solana have done before, this coin can do similar.
Further, this coin doesn't have a maximum supply, which means there can be added unlimited new coins that can affect the price action, and the exchange that did pump this coin is known to take profit exchange.
Trading TRB is very risky, it can have a time of pumping when the price time frame of increase is over, and it can enter into a fall.
Our study is done with high tools, including the technical view of the coin and the data of whale transactions and volume range study.

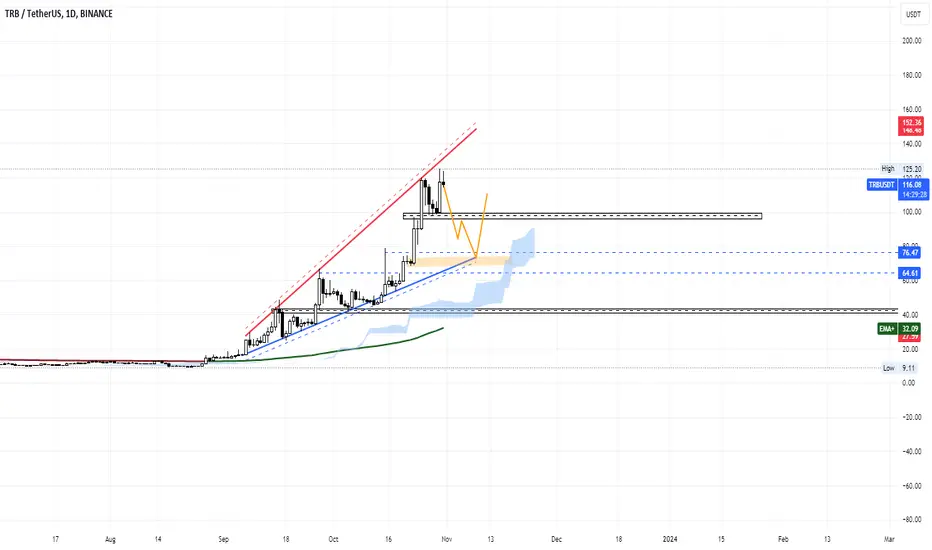
TRB has become dangerousIt looks like a triple rising structure is finished.
The first structure seems to have been a diametric one, the second one a zigzag one, and the third one a diametric one.
If a pullback is made to the red zone, it can be an opportunity for a sell/short option
For risk management, please don't forget stop loss and capital management
Comment if you have any questions
Thank You

TRB please dieTRBUSD has posted a bearish divergence on 4h and daily. This time price has broken above range and deviated back inside the range for a clear short trigger with easy invalidation at the range high. Different to previous breakouts, this one hasn't been so large and makes for a clearer top.
Hoping this finally puts the nail in coffin of this ludicrous liquidation machine, but perhaps not.
Invalidation at marked range high. First target mid then lower range bands and hopefully looking for a break of that also.

TRBUSDT ------> SHORT (40%)Hi Everyone
All I have available is the price chart and that's all I need.
And what I see on the chart is an unconfirmed ( yet unconfirmed ) DOUBLE TOP pattern.
For BINANCE:TRBUSDT As the momentum decreases and the price ceilings approach each other, and the price approaches the ceiling of the ascending channel , Considering the dominance chart of Tether, Bitcoin and Ethereum , for me a general correction in the market and especially in this chart is predictable .
Targets in the order of probability and time
$100
$85
$75
and I consider a possible stop loss around the price of $130 .
TRBUSDTBINANCE:TRBUSDT
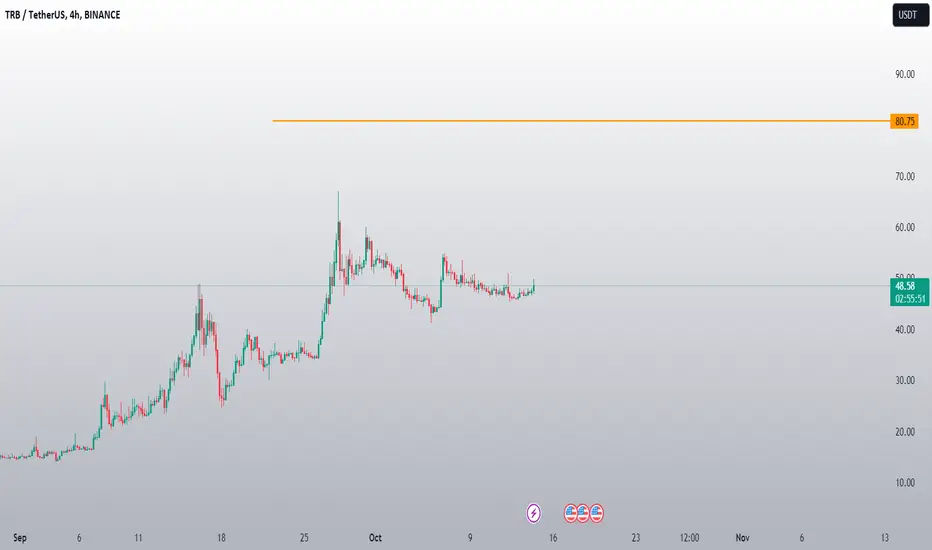
I am not sure, but I am waiting for this movement and the beginning of the downward trend. Currently, the funding fee is still high and there is a possibility of an upward lag, so I want to see if this resistance line will be hit again or not. If this happens, the price can go sharply or gradually up to 70$.
⛔"Daily crypto market analyses I provide are personal opinions & not financial advice. Trading carries risks, so do your own research & seek advisor's help.#DYOR"
Don't forget to like and comment

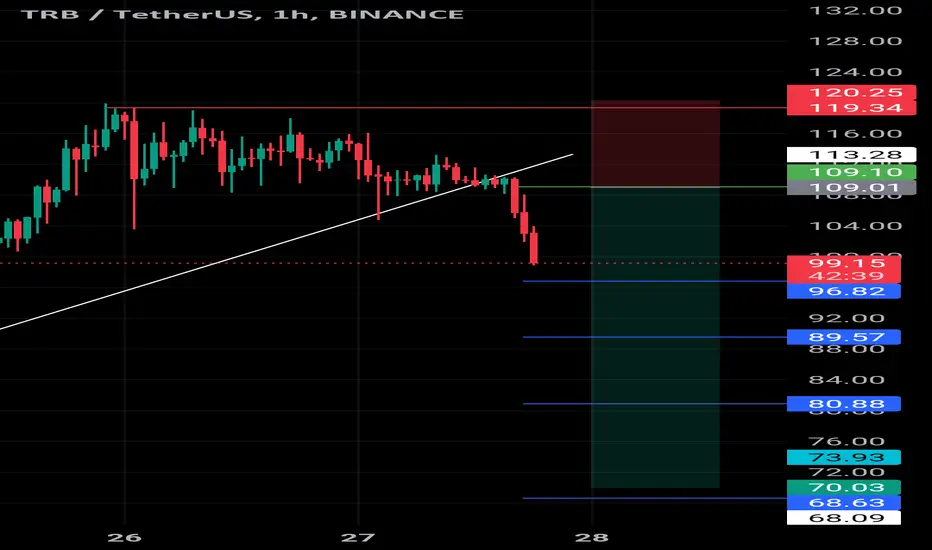
TRBUSDT, short to 103 in near time.Hi friends. I really don't know how many people trade this instrument ... But want to help you don't get caught in a bear's net )) We have bearish accumulation above 100.0. Strong resist level 112.1 (X-Lines 4H level). Target for bears 103.0.

TRB - Tellor coin VCP bullish pattern TRB breaking the 70$ level price, is conducting the price towards 80$ level.
Just breaking the VCP pattern to 139.24 level for a medium term possible target!
Good trading!

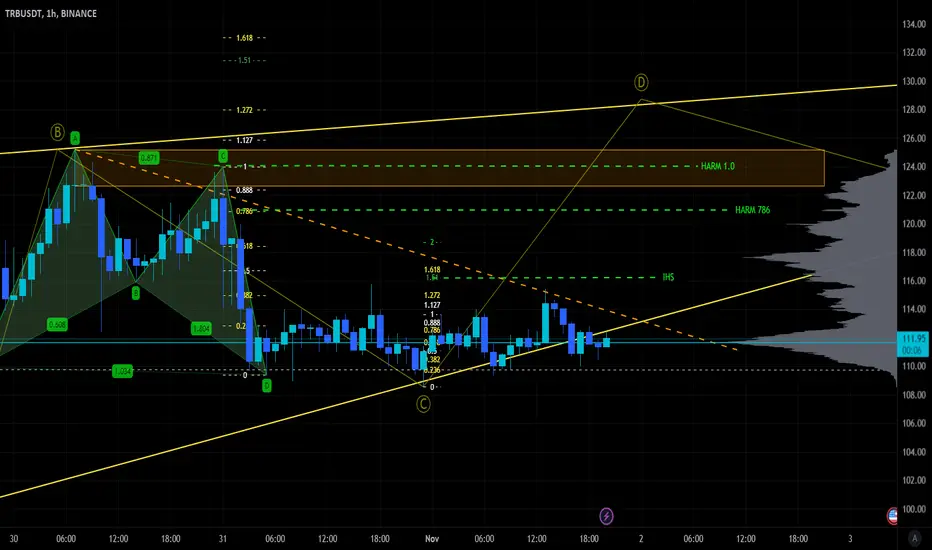
BULLISH H1 HARM & IHS TARGETSTRB has some bullish H1 harmonic and IHS patterns with targets up to about $124, if they play.
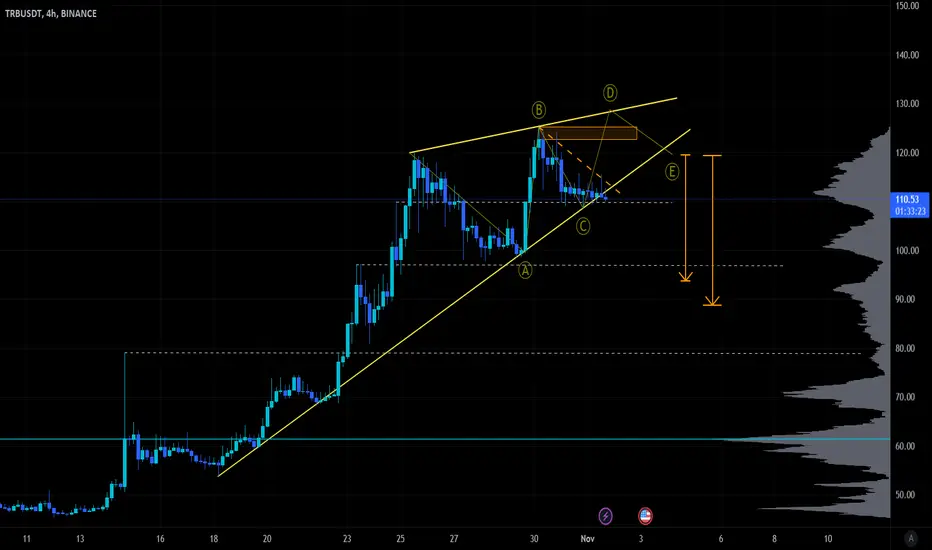
Rising wedgeLooks like an incomplete rising wedge. This is a developing coin, so charting can be unpredictable. As long as it keeps respecting the TL's, patters should play out. The orange arrows are 66% measurements based on 2 different points from the way up that get placed once the breakout lower has happened.
Overall idea is for more up for D leg before down.
TRB │ SHORT │ 29.10.2023BINANCE:TRBUSDT.P
Signals for level breakout
bar/candles closure near the level;
close retest of the level;
the instrument gradually approaches the level;
accumulation of energy for level breakout;
a good approach to the level;
consolidation near the level;
decrease in trading volumes before the level;
no response to a false level breakout;
there is a reserve of calculated ATR;
there is a reserve of technical ATR;
Trade Parameters
Open : 98.0555800;
Stop loss : 98.7776800;
Take profit :
95.8892800;
Disclaimer
Every trader should make their trading decisions based on their own analysis and circumstances. The signals in this channel should be considered as an additional tool for your own consideration.
Follow me and receive high-quality cryptocurrency market analysis!
TRB RED RECOVERY Thanks for reading this update, this update is not trading advice.
TRB seems to have entered a new recovery
We did expect before the increase of TRB from $48
This is the trading world, and every coin comes at a moment of recovery.
The speed of the trend and time frame can be a difference

#Trbusdt.p After the pump we have resistence Zone and wick priceBINANCE:TRBUSDT.P Bearish we can go easily
Using martingale Strategy for this Tarde is good
we have stop loss over the 67$ around 70 or more
And we can hold Bearish until 26$ 21$

TRB - end of story...TRB has grown enough to fall in deep. No fibo, no waves, no analysis, just gettin information from the Universe. New level of trading and new generation of forecasts...
TRB VOLUME INCREASEThank you for reading our update. Please remember that this is not advice for trading.
TRB Looks to have a new uptrend volume
$TRB SOON BREAKOUT LSE:TRB SOON BREAKOUT
How to Trade Breakouts Using Trend Lines, Channels and Triangles
Trend line
As you may know, a trend line is a trading tool.
That’s right.
It’s a trading tool, not some magic line on your chart!
It means that the effectiveness of this tool lies in how well you use it.
But here’s one thing it’s truly good at:
Helping you identify areas of value in a trending market

TRB COIN PRICE ANALYSIS AND NEXT POSSIBLE MOVE!!LSE:TRB Coin Next Possible Moves Near Me !!
• TRB Coin Price almost look overbought too much on tf charts.... Maximum chances Now we see healthy correction in its price.
• Small bounce expected From its Local supports = 92$-76$.
• May Be whales again start accumulate it From 60$-55$.
• In Next few weeks 70%-80% chances we see TRB Coin Price at 60$ or Below From this level.
FOLLOW US FOR MORE FREE ANALYSIS !!

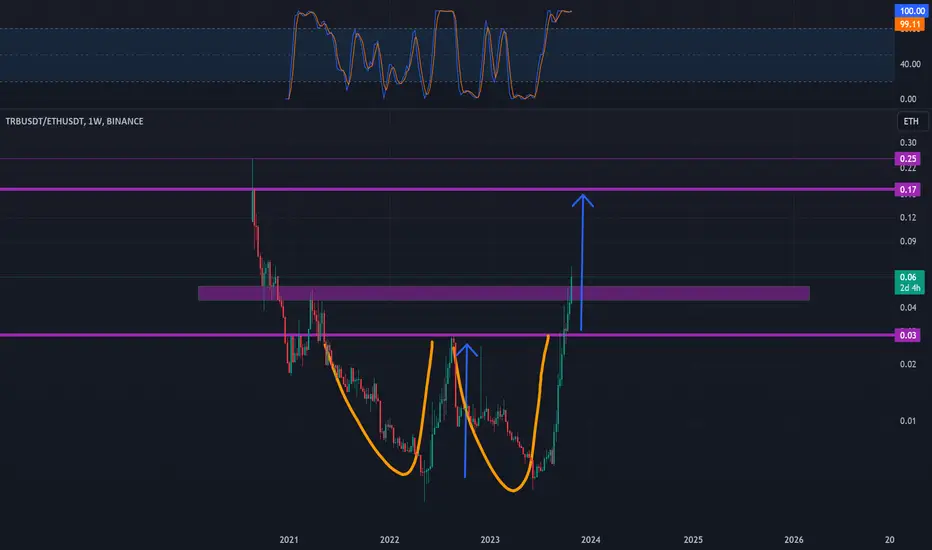
TRBETHAs for TRB, it seems that there is no weakness in the long term, and we will only have a correction in the short term, and then it will attack the ETH pair ATH
🔍 Keep an Eye on Trbusdt! 📉**🔍 Keep an Eye on Trbusdt! 📉**
While it seems like a tough time for TRB, here's a suggestion: let's be patient and await a potential small retest this weekend. The upcoming week might pose a bearish challenge for TRB, so watch out.
🚨 Remember, this is just an idea and not financial advice. Always conduct your own research before making any decisions.
Wishing you the best of luck on your trading journey! 🍀📈
TRB, How to trade such coinTRB, How to trade such coin
best strategy is after big liqudations
watch this video

TRB Decending tyriangleTRB UPDATE: TRB tested the daily and weekly TF resistance and we saw a big rejection from there….. So, what is next to be expected on TRB is the controversial question from most traders now but is easy to say because right now TRB is creating descending triangle on 30mins TF there is two scenarios I will be looking at from here….
First scenario is for TRB to retest the 30mins bearish OB above as indicated in the chart before further downside movements
OR
Second scenario is for TRB to break the support on the descending triangle….
In short, any break of the descending triangle will trigger sellers to come in and pull the price down to 4hrs support…. Watch out for the breakdown and take good short from retest of the resistance…..
Follow for more market update

TRB – Break Support and Down You GoTRB broke below the support trendline of the Rising Broadening Wedge.
The 21D EMA and the weekly S/R level at 46.7 is still holding Tellor’s price. As long as these support levels hold it could still try for higher.
If TRB drops below these supports, it could retrace most or all of its gains.
Wait for a retest of the 21D EMA as resistance before taking the trade (Assuming you are interested).
Look for a break below the RSI support as confluence.
A move down to the 200D EMA, at least, is likely, IMO.
Trade Idea:
• Entry: 45.5 (Retest of the 21D EMA as resistance)
• SL: 51 (ATR)
• Target: 13.5
• TP: TP1: 50D EMA, TP2: 200D EMA.
• R: R: For TP1: 1:1.55. For TP2: 1:4.4. For TP3: 1:5.93

TRB/USDTwho said you cant do 1000% gains on #altcoins?
all you had to do was have your alert for the dashed white line and trade the breakout! LSE:TRB
