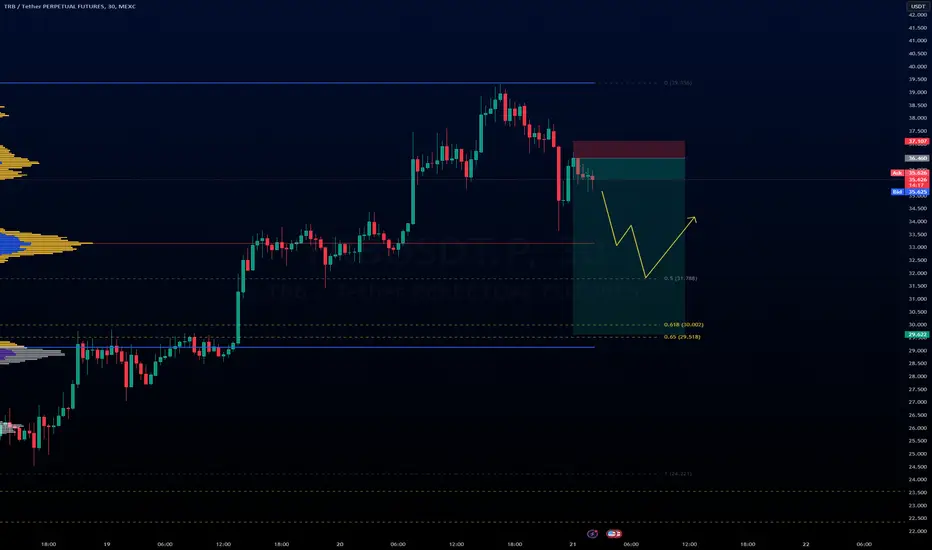
TRB retracing after a run up5 wave structure completed, now maybe a 3 wave corrective structure down.
Caught a short earlier and hoping to ride this down to 32.
FOMC looming in 2 hrs so have moved stop to entry and set TP. Will look to enter a long tomorrow.
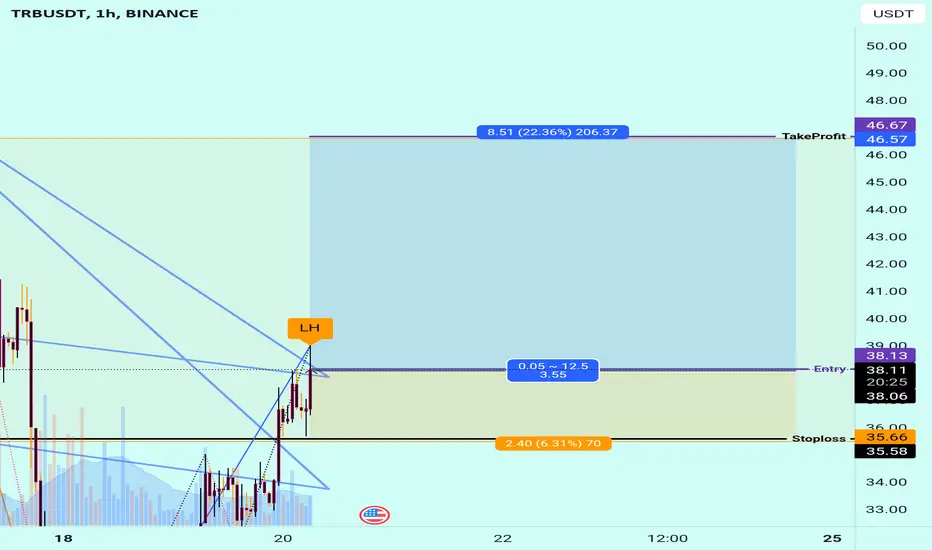
TRBUSDT trade ideas
"Riding the TRB Wave: Buy Low, Ride High! 🌊"Let's embark on a thrilling journey through the intricacies of TRBUSDT! 🚀 Join me as we dissect its price movements, uncover potential patterns, and reveal the hidden gems that could drive your crypto portfolio to new heights. Get ready for an in-depth analysis that's packed with insights and tailored just for you
Welcome to my channel! Dive into the world of cryptocurrency with daily technical analysis, where we explore the latest market trends and uncover potential opportunities. From Bitcoin to a wide range of altcoins, I'm here to provide you with valuable insights and predictions to empower your investment decisions.
Please remember that crypto technical analysis is a powerful tool, but it's not infallible. It's essential to consider a holistic approach to your investments, taking into account factors like overall market trends, economic conditions, and information dissemination. This channel is dedicated to expanding your knowledge and fostering meaningful discussions.
Join me for the most up-to-date analyses, and don't forget to engage in the conversation in the comments section below! Remember, this content is for informational purposes only and should not be considered financial advice. Always use it as a part of your broader investment strategy."
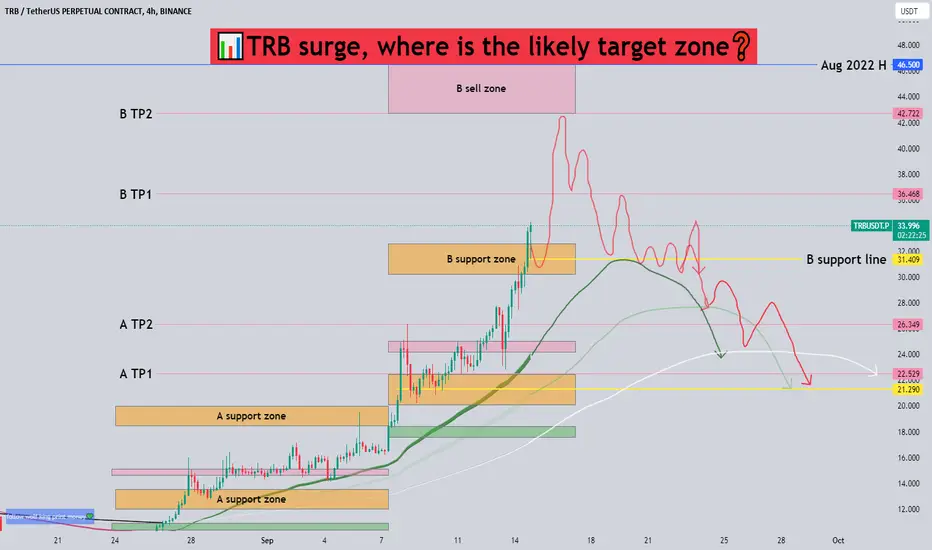
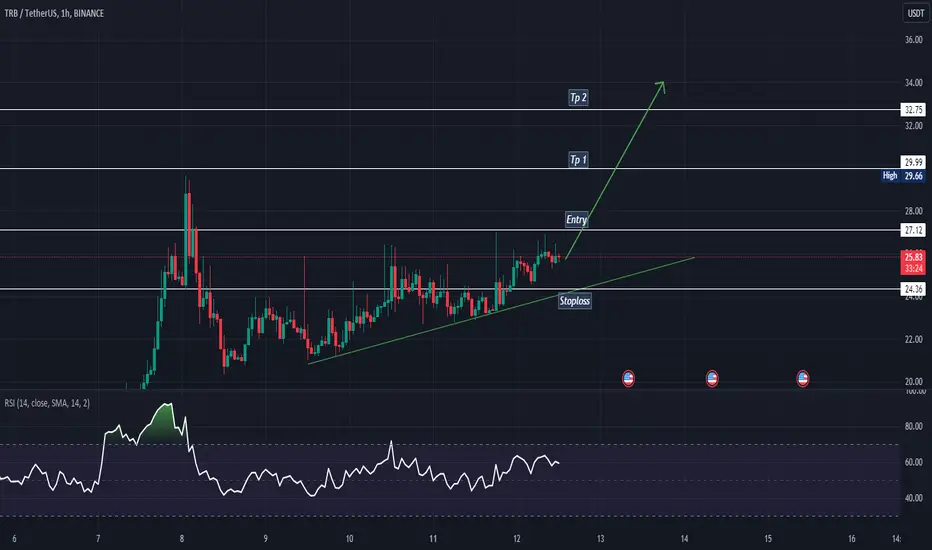
📊TRB surge, where is the likely target zone❓🧐TRB started a 19-day violent rise after returning to the 2022 low again. Many people will regret that they did not seize the opportunity of this rise. But if we enter the market now, there will be countless fears to stop us.
🧠To this end, I have analyzed and sorted out the target areas that may be reached by the rise, and simulated the possible trajectory, hoping to solve everyone's confusion.🍻
‼️Note that if we reach B TP1, then it is possible to go to B TP2. If we stop at TP1, then this simulation trajectory will be invalid. If we break through B SELL ZONE, then this simulation trajectory will also be invalid.❌
let us see👀
👏Welcome everyone’s messages and comments💬
🤜If you like my analysis, please like 💖and share it💬
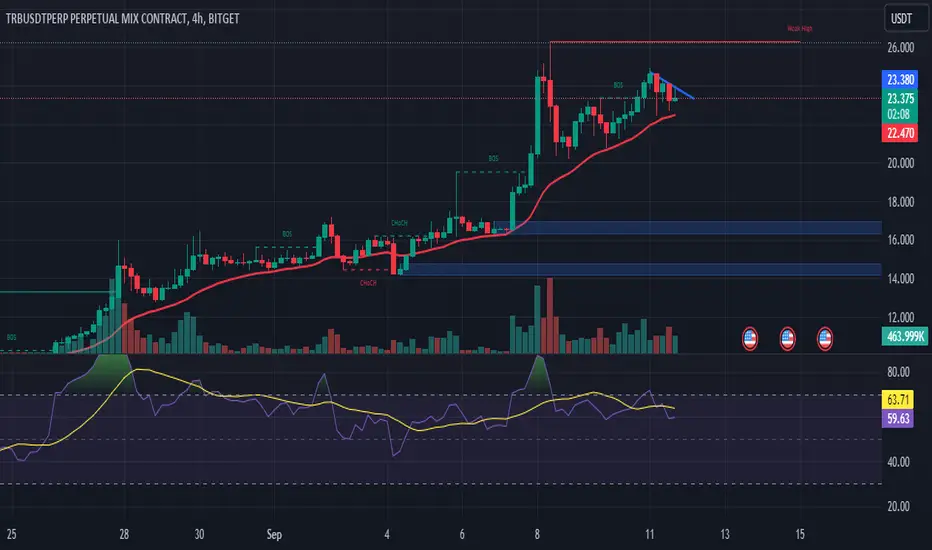
Brief Analysis——TRBTRB’s performance over the past month has been remarkable, with the price rising from an initial price of 10 to nearly 50. But yesterday the price fell by almost 50%. Let’s take a look at how TRB’s whale is moving and whether TRB still has a chance to get closer to the highs.
We have used our WTA indicator many times in brief analysis. The definitions of blue, red, green and gray are as follows:
· Blue column: represents the trading volume of entities, described as a large whale.
· Red column: represents the trading volume of whales, described as a whale.
· Green column: represents the trading volume of large investors, described as fish.
· Gray column: represents the trading volume of retail investors, described by shrimp.
We use three rectangles to distinguish the three phases on the TRB candle chart. In the first two phases we use green rectangles. Both phases correspond to price continuing to rise, but the large whales disappearing. While the red and green columns are still there, the loss of the large whales has a greater impact. At this time, large whales are taking profits and closing positions. Long candles often appear at the end of this phases, and then the trend will decay. As for whether to reverse, it needs to be determined based on the shape of the candle, such as the appearance of a long pin-bar, or the appearance of a long candle in the opposite side.
So after the first green rectangle, the bulls decay, but remain fluctuating. After the second green rectangle, the price reached the August 2022 high, and a long upper pin-bar candle appeared accompanied by increased trading volume. A reversal occurred.
In addition, there is a special point on TRB. In the case of other token reversals, the departure of the large whale has been invisible. But in the red rectangle we can see that the blue columns corresponding to the large whale appears. This illustrates the urgency of Whale’s departure. After losing the support of the large whale, TRB may be in a bearish trend for a long time.
Disclaimer: Nothing in the script constitutes investment advice. The script objectively expounded the market situation and should not be construed as an offer to sell or an invitation to buy any cryptocurrencies.
Any decisions made based on the information contained in the script are your sole responsibility. Any investments made or to be made shall be with your independent analyses based on your financial situation and objectives.

Is TRB in Bull Run?As we can see, TRB has made many climbs and broken many resistances.
By checking the chart, I realized that the serious TRB resistance is where I marked with the red box and there is a possibility of rejection there.
Until the price reaches this price box, sell/short positions are dangerous.
To reduce the risk, we can wait for confirmation after hitting the red box.
The green box is also an important and relatively strong support that can be used for the target.
I specified the invalidation level. Closing a 1-day candle above this level violates the analysis.

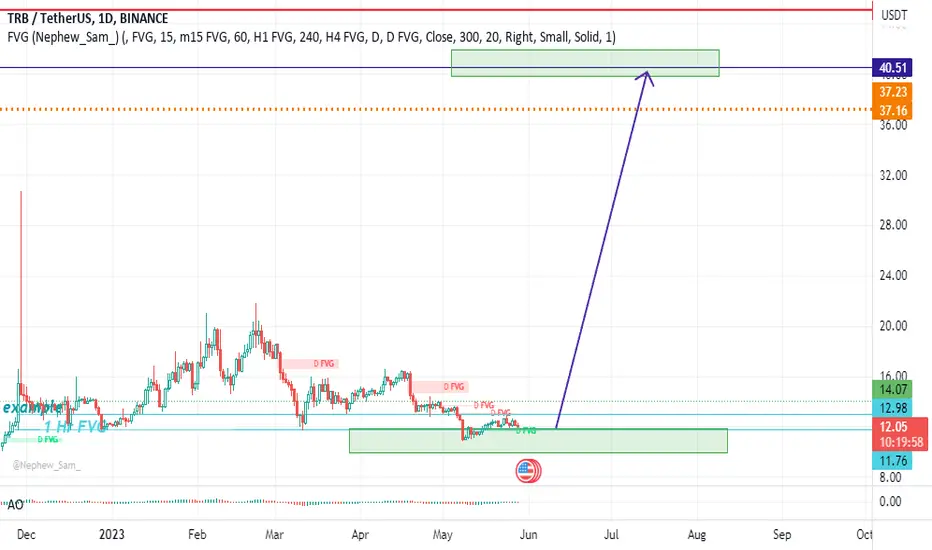
TRB 37-40 $ soon.. #TRB Giving a chance for double trading money#TRBUSDT can pump to 40 dollar. but here is a condition ...it must be holds green box(a full candle never close below green box)...
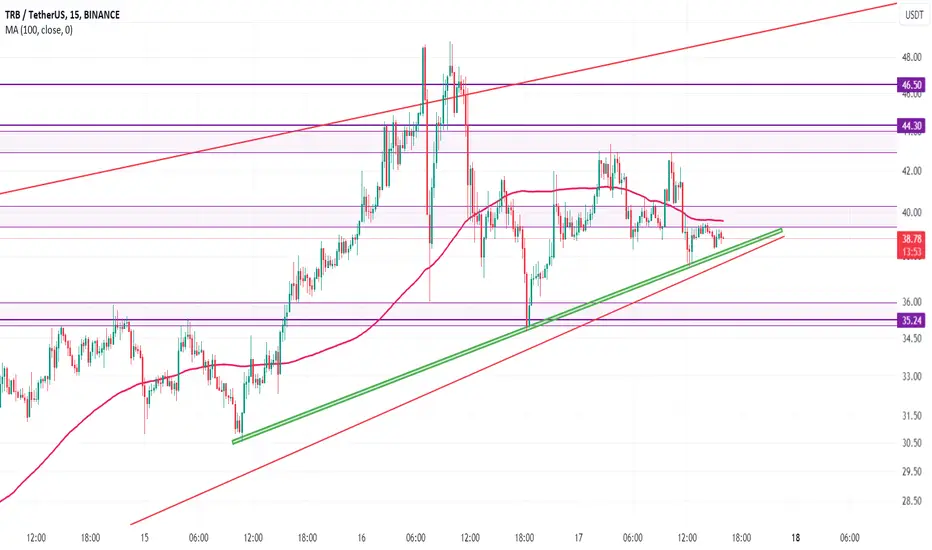
DOUBLE BOTTOM ( 15 min LOCAL TF) A double bottom is forming on the 15-minute chart, I’m waiting for a rebound to the zone of $31-33 per coin, after which the downward movement will continue.

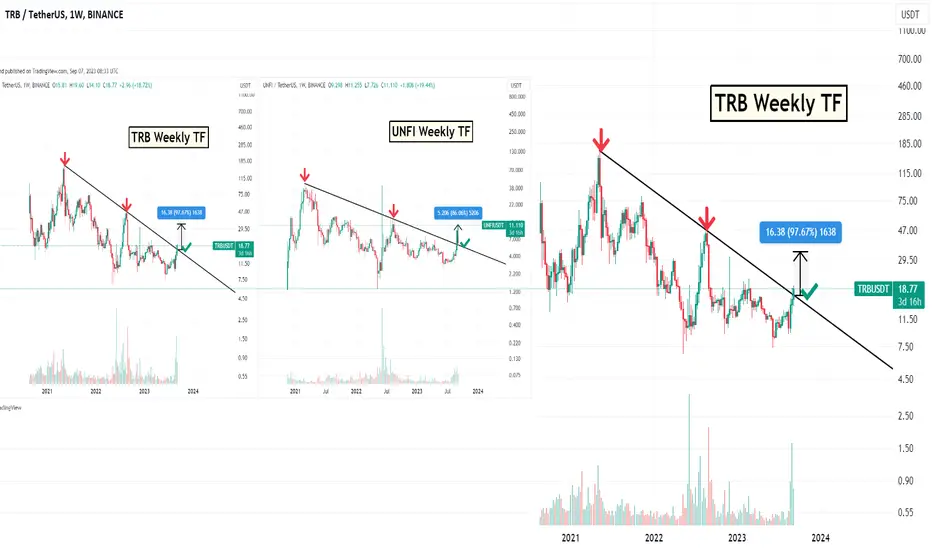
TRB will follow UNFIHello Traders,
IF Bitcoin remains stable, TRB can follow UNFI.
Reasons:
Very low circ supply (Only ~2.5m coins)
Low mc
Similar weekly charts already broke out dynamic resistance.
Keep an eye on it. It will be above ~$20 soon.
Please hit the boost button and follow me for more ideas.
Thanks

TRB Possible Shortif price broke the trend line we can expect short.
Note: Funding Rate is too high, be careful!
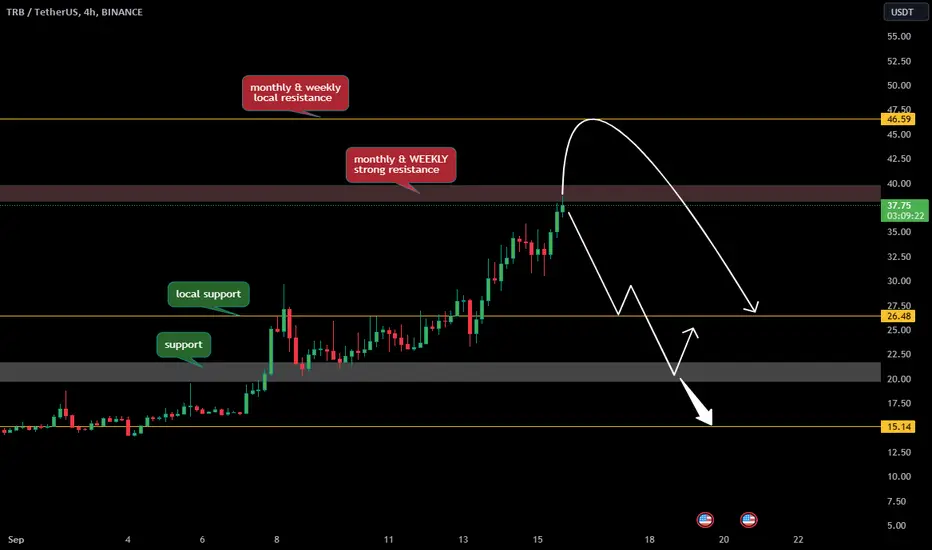
WHY TRB COIN PRICE PUMP HARD ?? TRB COIN PRICE ANALYSIS !!If You are Confused about LSE:TRB Coin Then Read it and Understand chart Clearly....
• Price is already in overbought zone on 4h, 1D & 1W Chart & Currently testing Now its weekly & monthly strong resistance.
• Sell Your Spot bag or Close Long position if you are holding.
• If we talk about opening short position then try to find only quick scalp with proper trade setup... If unfortunatly you get stucked in trade then...
• Funding fee will kill your portfolio & 2nd whales manipulation liquidate your portfolio.
Like this and follow if you want more free charts .
TRB SProbly will get stopped out, idk how much momentum there is left.
BTC pumping above 27 will get it closed
Short Entry upon Wedge Breakdown for TRBGreetings, Snipers!
TRB has risen over 200% in less than a month during a bear market
The pump and dump forms a rising wedge
In the shorter timeframe, there is a clear diagonal support
We can short once there is a breakdown of this support.
TP1 at $24.4
TP2 at $16.6
Please ensure risk management and stop-loss (trailing $31, $34, $36 for futures) as this coin has a pump-and-dump nature. There is a price discrepancy with TRB futures, so beware of the funding rate.
Happy Sniping!

TRB USDTCrypto Lover
Short Sell Call
with Define Entry and Exit with Reversal from Resistance Area (15 min TF)..

TRBUSDTTRBUSDT is in bullish Trend.
Potentially printing HH and HL.
No sign of trend reversal from here.
We wait and watch for the breakout of lat HH.
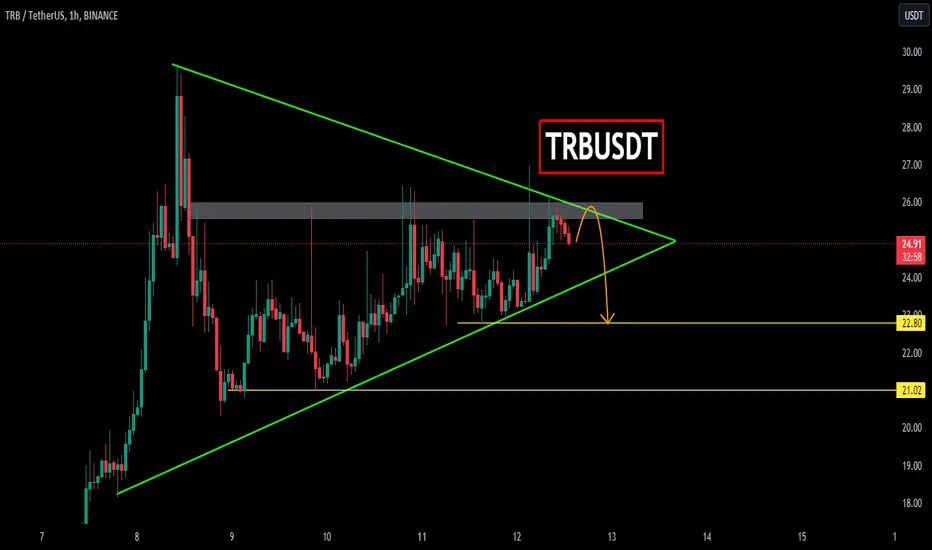
TRBUSDTTRBUSDT is trading in symmetrical triangle pattern. The price is reacting well the support and resistance of triangle.
Currently the price is at the resistance of triangle where the sellers are showing good strength and seems like the price may break through the triangle.
If the breakout sustain to downside ,the optimum target could be 22.80 followed by 21.
What you guys think of this idea?
a new plan of #TRBBITGET:TRBUSDT.P
#TRB/USDT
🔴 SHORT
🔰Entry1: Market
🔰Entry2: 24
🔷Targets :
🔹Target : 22.5
🔹Target : 21
🔹Target : 19
🔹Target : 18
🔺 Stoploos : 24.5
📊LV : 20_10×
Capital management should be observed
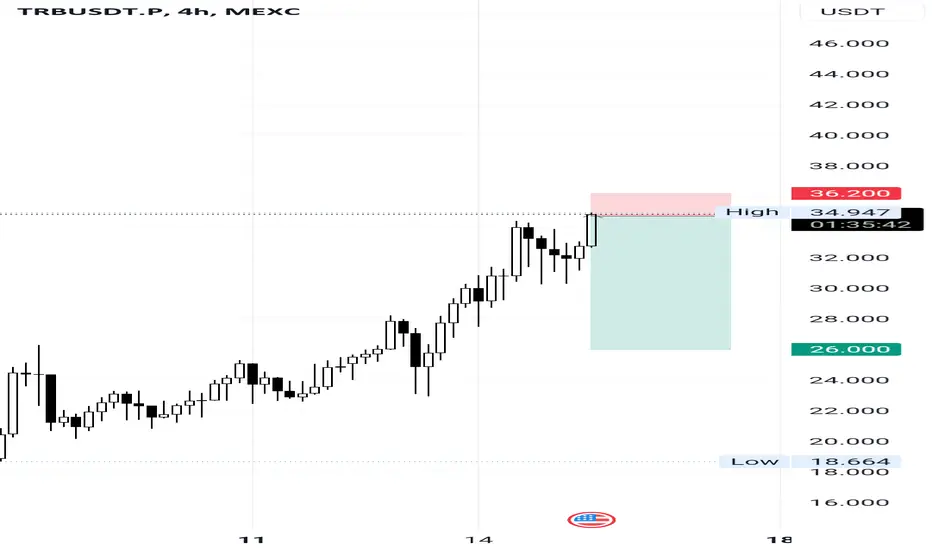
Sell limit TRBUSDTUpward momentum has decreased. Sell it with futures contracts at the price range 23.3-24-25.5-26 and stop loss if the daily candle closes above 27usdt

Short TRBPrice is breaking the weekly support which means we had a trap. Also, the RSI support level is almost broken.
So if it stabilizes below this level, the next target will be 17$

Short TRBPrice is completing B correction wave , divergence between wave 3 and 5 is clear. also there is a
macro resistance around 17$
so , I expect wave C to happen

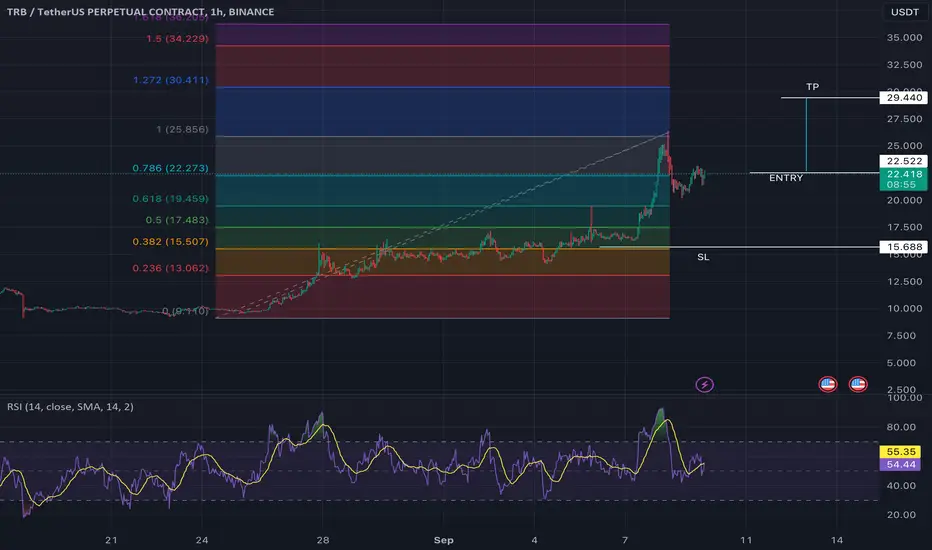
TRB Second Trade Based on N WaveHere is My Study On TRB. In This Trade Just Follow TakeProfit Mentioned on Wave Analysis
Welcome to my channel! Here you'll find daily technical analysis ofthe latest trends in the crypto market. From Bitcoin to altcoins, I'lIl be sharing my insights and predictions to help you make informed decisions
about your investments. Follow me for the latest updates and join the conversation in the comments!
Crypto technical analysis uses past price history to predict future price. It's not a guarantee and shouldn't be relied on solely for investment decisions. Consider other factors such as market trends, economic strength and
information dissemination. Use with caution.
This Is Not A Finacial Advise

weekly view on trb Trb is on weekly resistane and most likely is going to slow down here .
this is my opinion and my view not for invretment
