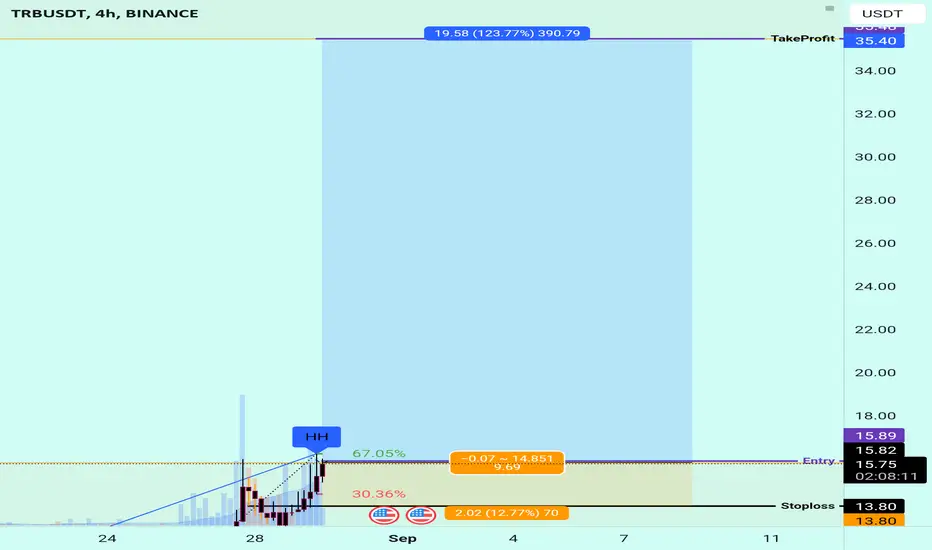
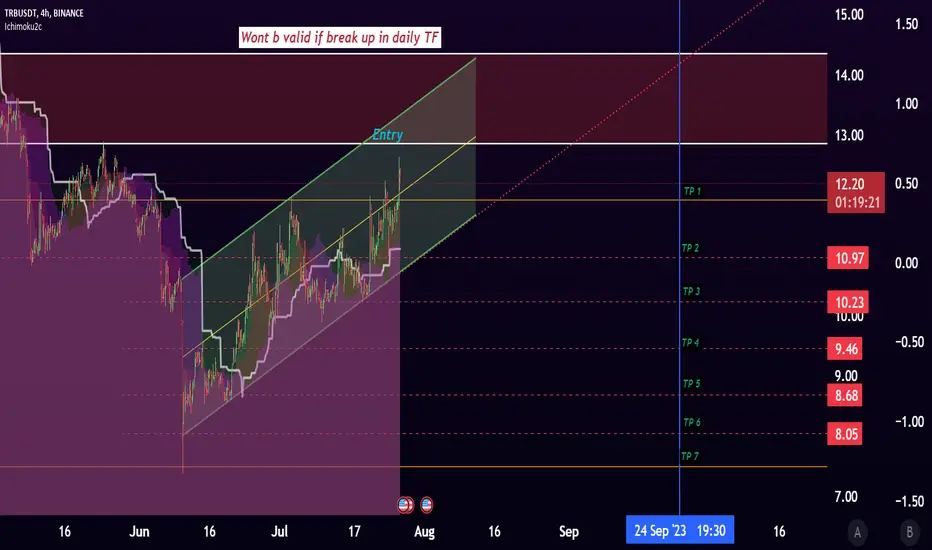
TRB/USDT back to home plan another low market cap its about to end waiting Red box DCA to short position ,remember patient is the key
take profit and entry mentioned on the chart
TRBUSDT trade ideas

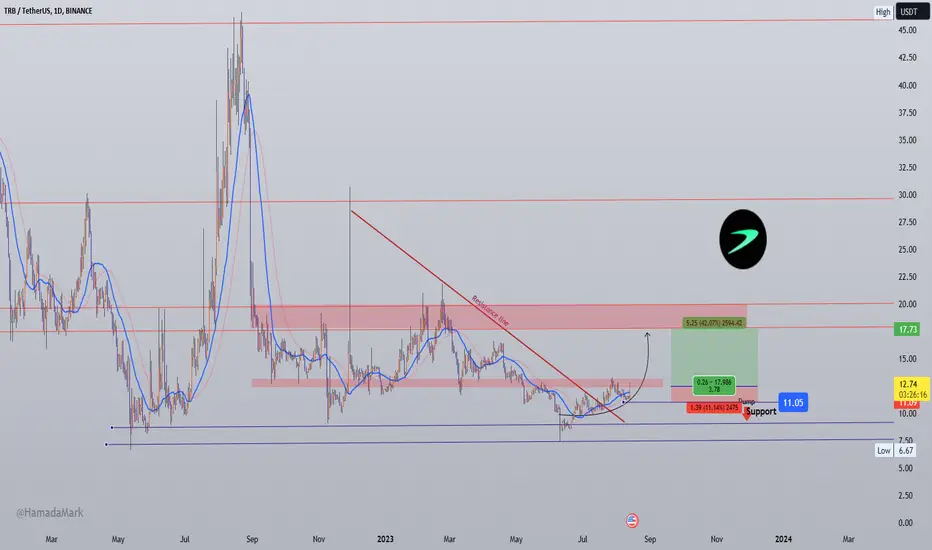
Tellor TRBUSDT Price Analysis (1d)Hello fellow crypto traders!
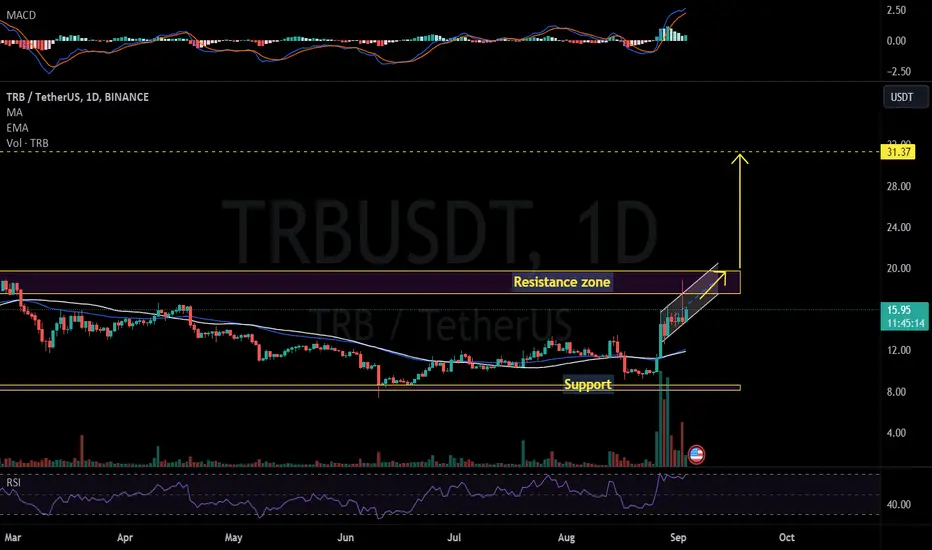
Tellor price action currently appears to be in a state of consolidation, characterized by a mix of bullish and bearish signals. The price seems to be encountering a significant challenge at a long-term resistance level.
For a bullish scenario to unfold and further price increases, it's crucial for BINANCE:TRBUSDT to breach the key resistance level at $18.60. Breaking through this barrier could fuel additional upward momentum.
Conversely, if COINBASE:TRBUSD fails to overcome the $18.60 resistance, we might anticipate the price to remain below this level and potentially retreat towards the critical support level at $10.0. Monitoring price movements closely in this range will be essential to assess the next major direction in Tellor market trajectory.

TRBUSDT Buy Setup!TRBUSDT Technical analysis update
Buy zone : Below $16.80
Stop loss : $15.05
Take Profit 1: $18.30
Take Profit 2 : $22.00
Take Profit 3 : $29.50
Take Profit 4 : $43.50
Thanks
Hexa
#LQR #TOBTC #TRBthese levels Around 18.930 & 18.510 are good spot for sell imit plann
always Do yourr own research

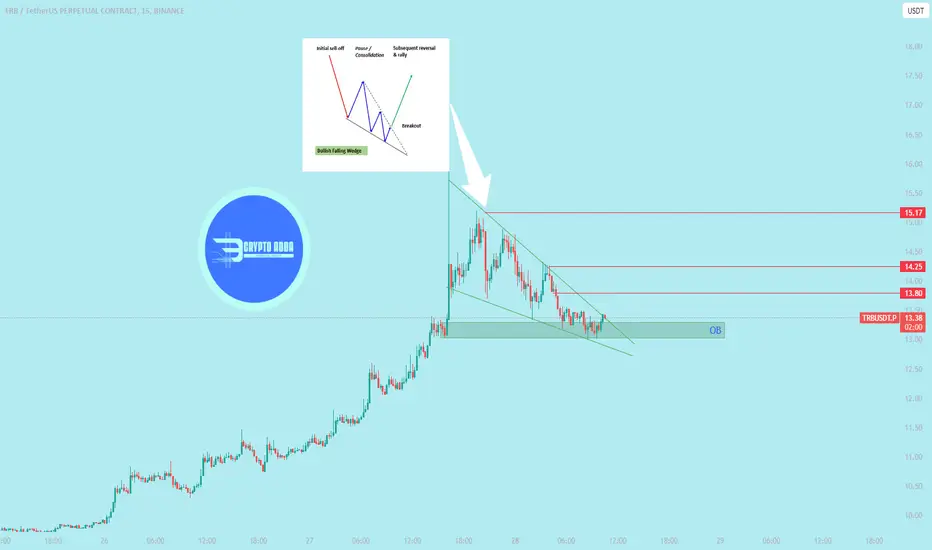
$TRB Performing Falling wedge in 15m Keep eye on Breakout Falling Wedge
The falling wedge can either be a reversal or continuation signal.
As a reversal signal, it is formed at a bottom of a downtrend, indicating that an uptrend would come next.
As a continuation signal, it is formed during an uptrend, implying that the upward price action would resume. Unlike the rising wedge, the falling wedge is a bullish chart pattern.
In this example, the falling wedge serves as a reversal signal. After a downtrend, the price made lower highs and lower lows.
Notice how the falling trend line connecting the highs is steeper than the trend line connecting the lows.
If we placed an entry order above that falling trend line connecting the pair’s highs, we would’ve been able to jump in on the strong uptrend and caught some pips!
A good upside target would be the height of the wedge formation.
TRB Buy TradeHere is My zstudy on TrB.
Welcome to my channel! Here you'll find daily technical analysis ofthe latest trends in the crypto market. From Bitcoin to altcoins, I'lIl be sharing my insights and predictions to help you make informed decisions
about your investments. Follow me for the latest updates and join the conversation in the comments!
Crypto technical analysis uses past price history to predict future price. It's not a guarantee and shouldn't be relied on solely for investment decisions. Consider other factors such as market trends, economic strength and
information dissemination. Use with caution.
This Is Not A Finacial Advise
TRBUSDTTRBUSDT is in bullish phase currently trend is in ranging mode if it breks upward and breaks the last HH Then trend will againg continue to bullish side.
We wait and watch for the breakout .
TRBUSDTTRBUSDT has formed bullish flag pattern and currently the price is trading at previous support zone and also getting support from flag.
if this support holds and flag breakout happens it will be strong bullish leg with target of 14.50 followed by 15.
What you guys think of this idea?

Keeping an eye on #TRB/USDT Diagonal Trendline in 1-Hour TF!Keeping an eye on #TRB/USDT Diagonal Trendline in 1-Hour TF!
Wait for BO/retest to open short position.

TRB/USDT Upward Movement Just make New lower high ?? Hello Paradisers, A Token to Watch
💎 TRB has repeatedly touched a significant demand zone, each time resulting in a price increase. It's now on track to test an hourly supply level.
💎 In its current trajectory, TRB seems to be forming a new upward leg with the aim of establishing a lower high in the supply zone, likely followed by a move to create a new lower low.
💎 However, if TRB successfully breaks through this supply level, it could potentially reach previous higher highs and maintain an upward trend.
💎 For those considering a short position, keep an eye on the supply area for signs of bearish activity or rejection. If you're looking to buy for spot trading, either wait for a confirmed break above the supply level or consider entering at a key support area if the breakout fails.

TRB/USDT buy setupwe have bullish move from TRB ,is going up with out correction expecting quick pull back to 11.9-12 $ area for more continuation as usual low market cap they do all at same time the dont leave any trace behind
TRBUSDT shortI think from TRBUSDT will get rejected on the white Trendline at price around 11.8 and puu back to the white trend line at price around 11
So my entry is 11.74
TP(100%): 11

TRB USDT: Just thougths Going down and around.
Based on technicals we will retrace 20-25% before proceeding probably upward.


Trb Getting Ready For Massive Bullish Rally consolidating in symmetrical triangle in daily tf and trying to clear it
once got cleared impulse will be massive incase of successful breakout expecting 50 to 55% Bullish rally
keep eyes on lower tfs for breakout

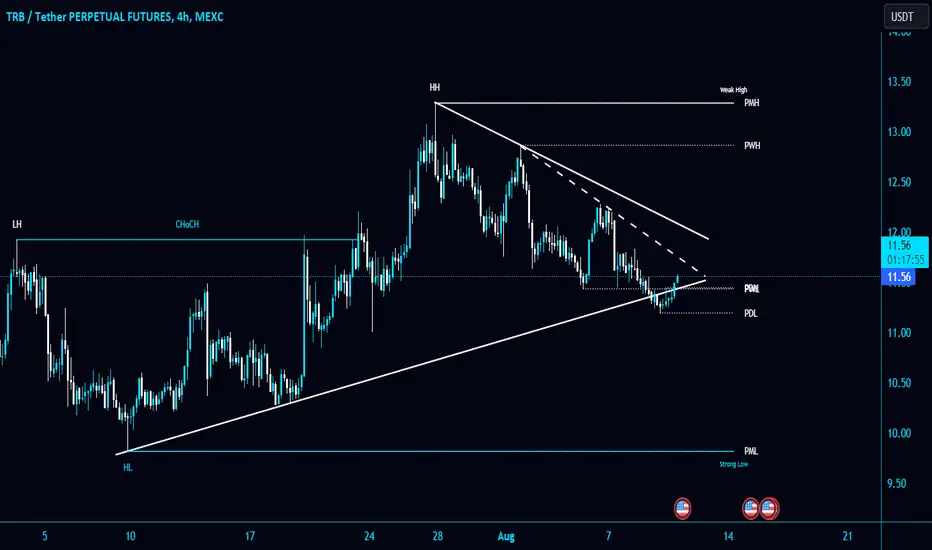
#TRBUSDT (Watchlist) 8-2023
Tellor is a decentralized oracle network that provides trusted and reliable data to smart contracts on the Ethereum blockchain. It does this by using a network of data reporters who compete to provide the most accurate data. The data reporters are rewarded with TRB tokens, which are the native currency of the Tellor network.
TRB tokens can be used to pay for data on the Tellor network, to stake for rewards, and to participate in governance. Tellor is a valuable project for the DeFi ecosystem, as it provides a secure and reliable way to get data into smart contracts.
Coin information summary:
All-time high: $161.12 (May 2021)
Sector: Decentralized finance (DeFi)
Project: Decentralized oracle network
Category: Proof-of-stake
Latest news:
Tellor partners with Chainlink to provide decentralized price feeds for DeFi applications
Tellor announces new data source for its oracle network
Tellor integrates with Uniswap to provide decentralized price feeds for liquidity providers
Note:
This isn't financial advice, but an analysis of coin movement (not a buy or sell signal). Before following any ideas, do your own research and practice good risk management.
You can't impose your opinion or force it to happen in the cryptocurrency market. So, be prepared for any outcome.
Remember, the cryptocurrency market is highly volatile and involves both gains and losses. Understand the risks before investing.
Good luck to everyone, and we hope that Allah reconciles and repays us all. 🙏
TRBUSDT By HesamUNTHey traders
what u think about TRB ?
Can break this daily lvl ?
this lvl confirmed by mid-term fib retracement, also confirmed by S&D strategy as potential supply area
what u think ?
share ur chart and leave a comment
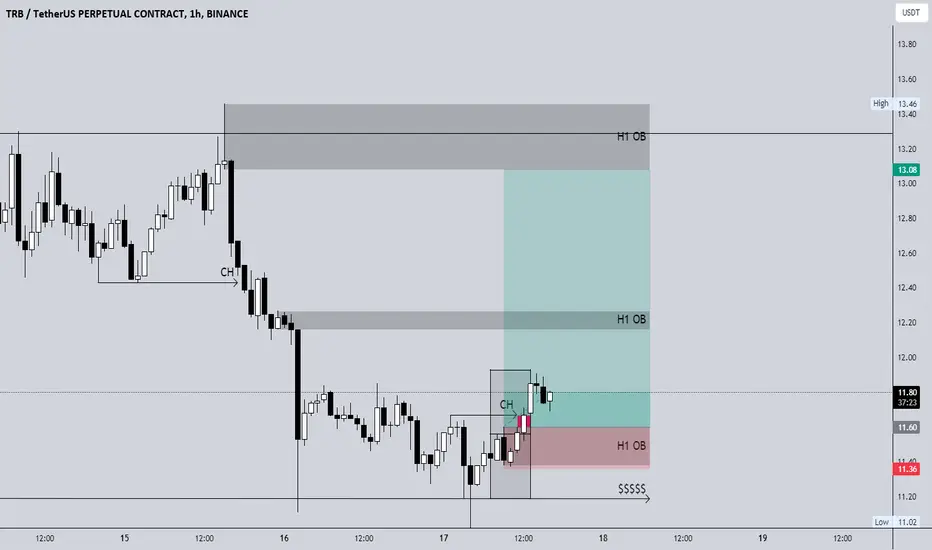
long trbHow to Trade Using the SMC Trading Strategy:
We would learn Smart money entry patterns and methods such as:
SMC Reversal Entries
How to identify valid CHOCH.
Major and Minor change of character (CHOCH)
Aggressive Entry setup
Entry Methods:
Firstly let us examine the entry method we can use in the SMC trading strategy. Smc entry methods are divided into two major subcategories namely:
The reversal entry method
The continuation entry method
The reversal entry method can further be divided into two namely:
Change of character (CHOCH) or change of market structure.
Flip entry setup.
TRBUSDT inverse head and shouldersFalling Wedge Breakout: TRBUSDT has successfully broken out from a falling wedge pattern. Falling wedges typically signify a bullish reversal pattern, suggesting the potential for a shift from a downtrend to an uptrend.
Inverse Head and Shoulders Formation: The market is currently in the process of forming an inverse head and shoulders pattern. This pattern involves three troughs, where the central trough (the "head") is lower than the two surrounding troughs (the "shoulders"). An inverse head and shoulders pattern is often viewed as a bullish reversal indicator.
Breakout and Retest Strategy: According to the analysis and in line with Plancton's Rules, a key strategy is being employed. This strategy entails waiting for a breakout from the inverse head and shoulders pattern, followed by a retest of the breakout level to confirm its new role as support. This methodology is in harmony with established technical analysis principles, where a breakout and successful retest can suggest a continuation of a bullish trend.
New Long Position Opportunity: Should the price execute the breakout and subsequent retest, a new long position could be contemplated. This would involve buying the asset with the expectation that its value will increase.
–––––
Follow the Shrimp 🦐
Keep in mind.
🟣 Purple structure -> Monthly structure.
🔴 Red structure -> Weekly structure.
🔵 Blue structure -> Daily structure.
🟡 Yellow structure -> 4h structure.
⚫️ Black structure -> <= 1h structure.
Follow the Shrimp 🦐

TRBUSDT.P READY According to our analysis, the price reached the reversal area of the harmonic (shark) pattern, and we have clear negative market maker candles. Good luck

#TRB/USDT able to reclaim the Diagonal Trendline in 4-Hour TF!#TRB/USDT able to reclaim the Diagonal Trendline in 4-Hour TF!
LSE:TRB claims the PWL, and I am expecting some bullish momentum.
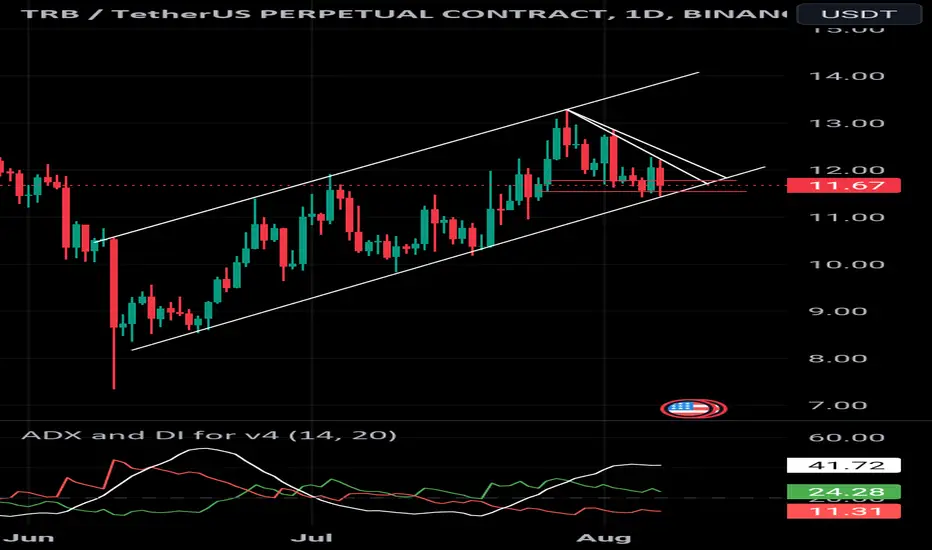
TRB About To Explode!In a clear upward channel, TRB has tested the lows and highs and is getting ready to move upward again.
Just rejected the POC below...
Mid term trade... Bullish!