#TRB/USDT#TRB
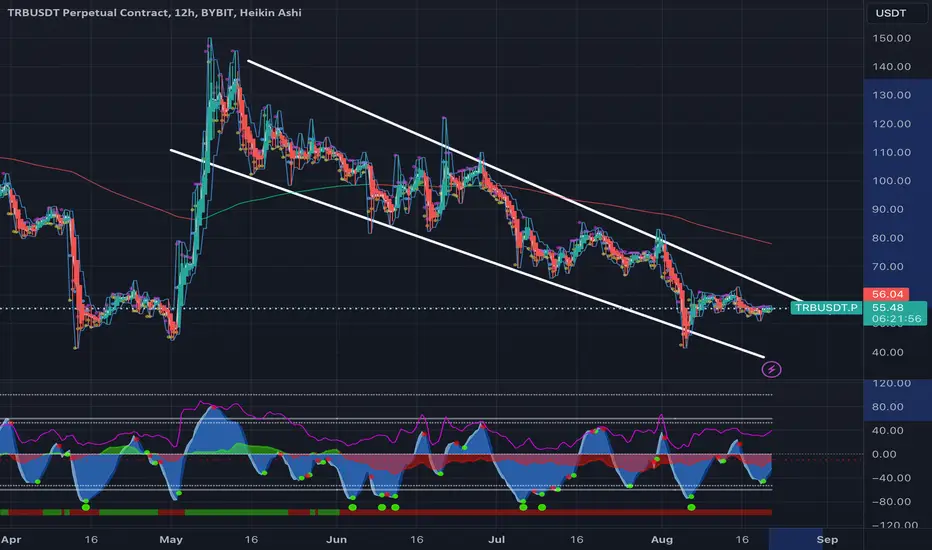
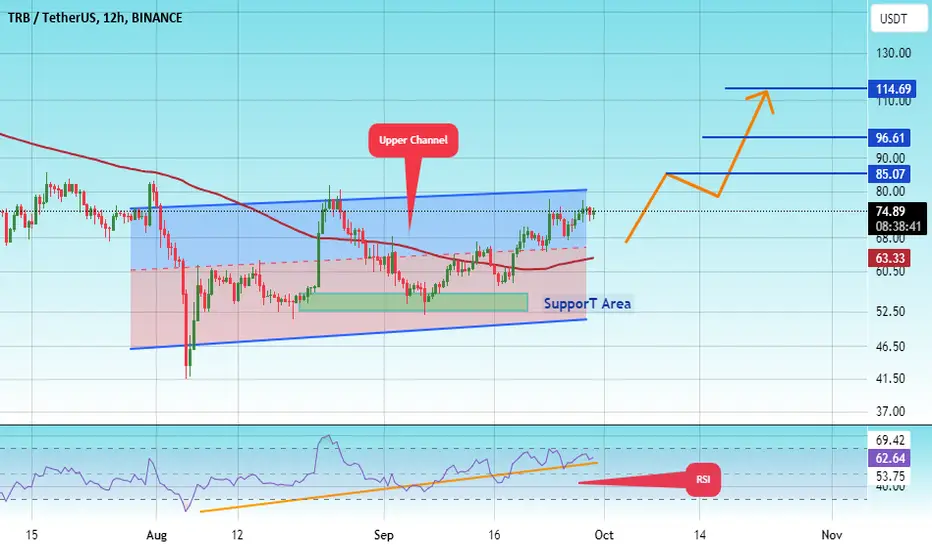
The price is moving in a descending channel on the 12-hour frame and is sticking to it very well and is about to break upwards
We have a bounce from the lower limit of the channel at a price of 54
We have an upward trend on the RSI indicator that is about to break, which supports the rise
We have a trend to stabilize above the moving average 100
Entry price 67.00
First target 85.00
Second target 96.91
Third target 114.70
TRBUSDT trade ideas
TRB, journey to more rise is inevitable..TRB recent series of surges caught everyone by suprise. It has risen an impressive 500% in just 3 months.
It has undergone muted correction from its peak at 67 before trimming back to 40 levels.
Now it's ascend journey has reset so-to-speak with 4h metrics suggesting higher lows and net buying activity at the current range conveying preparation to retest previous resistance range.
Expect more upside valuation of this coin in the coming weeks. The uninflated market cap of TRB will aid on reaching that goal. The incoming crypto market big shift will favor the small market cap ones, and TRB will be in line.
Spotted at 48.0
TAYOR.
Safeguard funds always.

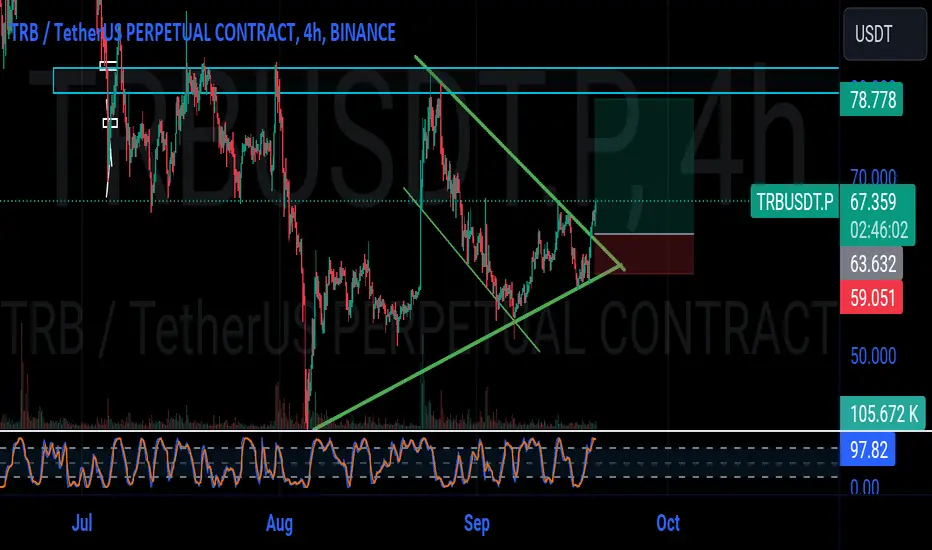
I Cannot Short This !!! situation+next targets.the TRB is in a ascending triangle now which means the price will increase and also It is expected that the price would at least grow as good as the measured price movement(AB=CD)
Note: we should wait for the breaking of the triangle and than make a move!
✨We spend hours finding potential opportunities and writing useful ideas, we would be happy if you support us.
Best regards CobraVanguard.💚
_ _ _ _ __ _ _ _ _ _ _ _ _ _ _ _ _ _ _ _ _ _ _ _ _ _ _ _ _ _ _ _
✅Thank you, and for more ideas, hit ❤️Like❤️ and 🌟Follow🌟!
⚠️Things can change...
The markets are always changing and even with all these signals, the market changes tend to be strong and fast!!

#TRB (SPOT) entry range( 43- 50) T. (135.5) SL (41.46)BINANCE:TRBUSDT
Keep the order in entry range & waiting for the price to come to fill your order
entry range ( 43- 50)
Target1 (76.90)- Target2 (105.5) - Target3 (135.5)
SL .1D close below (41.46)
*** Collect slowly in the entry range ****
*** This trade is short time investment ****
**** #Manta ,#OMNI, #DYM, #AI, #IO, #XAI , #ACE #NFP #RAD #WLD #ORDI #BLUR #SUI #Voxel #AEVO #VITE #APE #RDNT #FLUX #NMR #VANRY #TRB #HBAR #DGB #XEC #ERN #ALT #IO #ACA ****

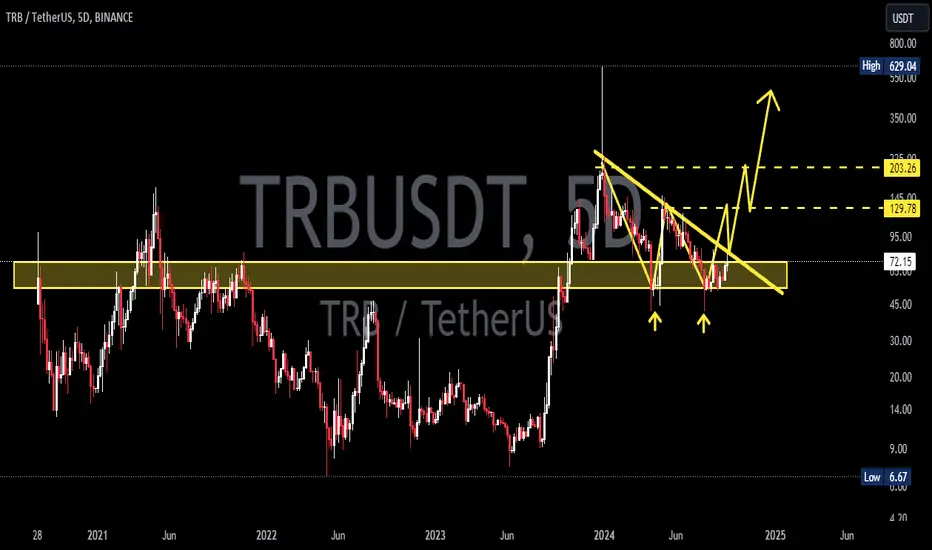
TRBUSDTTRB ~ 5D
#TRB If you have Conviction on this Coin. Start buying gradually on this support Block. it's just a matter of time until the bulls pump up prices again.
trb preparing for 3x bullish wave trb is consolidating within bullish pennant from last week now breaking out with strong buying volume expecting successful breakout soon
incase of successful breakout expecting 3x bullish wave in coming weeks

Four-hour TRBGiven the high touch number of candlesticks four times compared to the downtrend line, as well as the breakout of the RSI oscillator, I envision a good growth for this cryptocurrency

TRBUSDT - +38% upside with 1:2.5 RRPerfectly et up breakout and trend reversal play.
Nice risk: reward ratio.

TRB USD LONGTRB price action has broken out of the long forming symmetrical triangle and already showing good strength to the upside, with good volume.
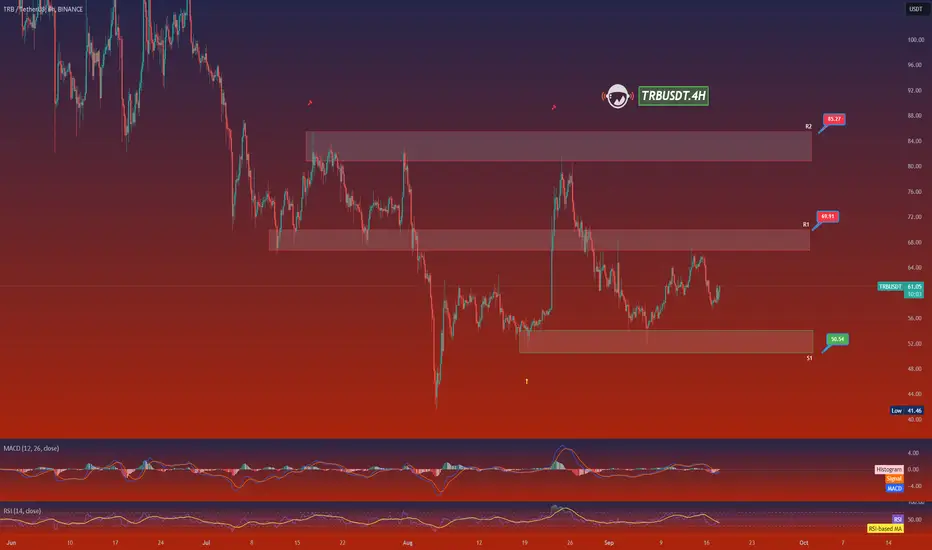
TRBUSDT.4HIn my current technical analysis of the TRB/USDT 4-hour chart, I observe some crucial elements that shape my trading decisions. As of the last data point, TRB is trading at approximately $59.34, showing a decline of 2.29% during the current session.
The chart shows TRB has been experiencing a general downtrend, with key resistance and support levels providing insights into potential turning points. The immediate support level (S1) is at $50.54, which has historically acted as a rebound point for the price. A breach below this level could lead to a further decline toward the long-term support at $41.46, represented by the low point on the chart.
Conversely, resistance levels are identified at $69.91 (R1) and $85.27 (R2). The price recently tested R1 but failed to break through, indicating a strong resistance zone. For a bullish scenario to unfold, TRB would need to sustain above R1, targeting R2 as the next significant hurdle.
The Moving Average Convergence Divergence (MACD) is currently in a bearish phase, with the MACD line below the signal line, which corroborates the bearish sentiment observed in the price action. The histogram also reflects increasing bearish momentum, which could suggest that the downtrend may continue unless a crossover occurs.
The Relative Strength Index (RSI) is at 43.53, which is near the lower boundary of the neutral zone. This indicates that there is potential for a price recovery if bullish momentum can be rekindled, but it also warns of a possible continuation of the downtrend if the RSI moves into oversold territory.
In conclusion, my analysis suggests a cautious approach to TRB at this juncture. While the support at $50.54 provides a potential buying opportunity, the prevailing bearish indicators advise against aggressive long positions unless there is a clear reversal signal. Monitoring the MACD and RSI for signs of reversal will be crucial to adjusting this stance, especially if the price tests and fails to break below S1.
TRB/LONG?Daily TRB chart, I see big moves from this area. Might be a bit off on the stop loss but major gains are to be had. BTC to 100 plus area will drive this to some higher prices. Dont forget about the audit either, that will have max upside if they're to pass.

#TRB (SPOT) entry range (60 - 63) T.(76.9) SL (59.51)entry range(60 - 63)
Target(76.9)
SL .1H close below (59.51)
BINANCE:TRBUSDT

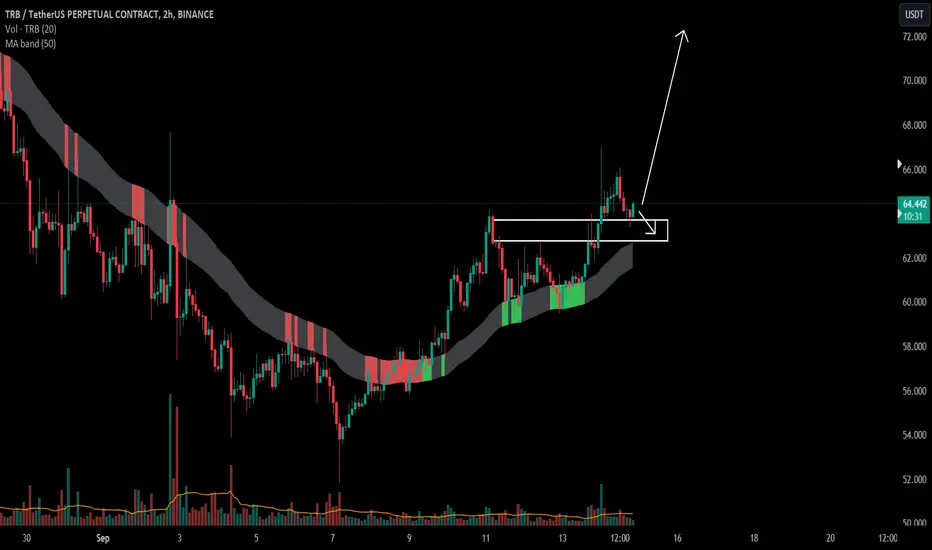
TRBUSDTREN trading signal v2.0 spotted.
- BOS (Breaks of Structure) at @ 62.772 - 63.701 level
- High momentum setup with increase of volume and momentum
- Sign of accumulation
- Good reward to risk setup with tight stoploss

TRBUSDTREN trading signal v2.0 spotted.
- BOS (Breaks of Structure) at @ 62.772 - 63.701 level
- High momentum setup with increase of volume and momentum
- Sign of accumulation
- Good reward to risk setup with tight stoploss
TRB LongTRB Will Break Our Soon
Have A Cup And Handle
And Very Bulish in Moving
i Think Will Be Rich 68.69.70 SooN


#TRB/USDT is trying to break the Diagonal Trendline in 1-hour TF#TRB/USDT is trying to break the Diagonal Trendline in 1-hour TF!
Wait for the breakout and retest to prolong it. The local support level is PWL $51.1, and the resistance level is PML $65.89.

TRBUSDT Can TRB Hold the Line, or Is a Deeper Dip Coming?Yello, Paradisers! Are we on the brink of a major move for #TRBUSDT? Let's dive into the analysis.
💎#TRB has faced a sharp rejection at the descending resistance, signaling a potential downturn. The price now looks set to retest the demand level. For TRB to regain bullish momentum and challenge the descending channel, it needs to rebound from the demand zone. The key confirmation here is a breakout above the critical resistance at $82.5. If successful, this could trigger a significant upward movement, with a high probability of reaching our final target at the strong resistance.
💎However, if TRB fails to bounce within the $56.80 - $51.50 demand zone and breaks down further, it could spell trouble. This scenario would likely lead to a retest of the major support at $41.60—a crucial level that needs to hold to prevent a deeper dip.
💎If TRB sustains itself and rebounds from this zone, the price could stabilize. But, if there’s no strong rejection and the price merely moves sideways, the risk of breaking down the major support increases, leading to a potentially deeper decline.
Stay focused, patient, and disciplined, Paradisers.
MyCryptoParadise
iFeel the success🌴

Analysis of TRBUSDT by the Mallicast TeamThe TRB currency pair is considered one of the least risky options in the crypto market, attracting the attention of many traders. Given the characteristics of this currency pair and recent market trends, the current price appears to be an appropriate entry point for a spot trade. Technical and fundamental analyses indicate that TRB is within a favorable price range and could present a low-risk and attractive investment opportunity for traders. The Mallicast analysis team believes that this price movement could reach a level of $81.940. Considering the current market conditions and the high trading volume of this currency pair, reaching this price target is not out of reach. Therefore, traders looking for profitable and relatively safe opportunities might consider entering the TRB market as an effective strategy.

TRBUSDT.PTRBUSDT.P is in bearish trend.
Potentially printing LH and LL.
No sign of reversal here.
We wait and watch for the breakout of last LL.

Trb to LongTrb can be Bought at 65.6
Entry : 65.6
1st Tp : 88
2nd Tp: 105
3rd Tp: 125
Stoploss : 40
This target may take a while to complete. I'll update it accordingly.
Keep following for more.

TRB - You Are not preparedTRB is coming to a close on its descending wedge pattern. Once we see a breakout we could easily see another 100-150% if not more