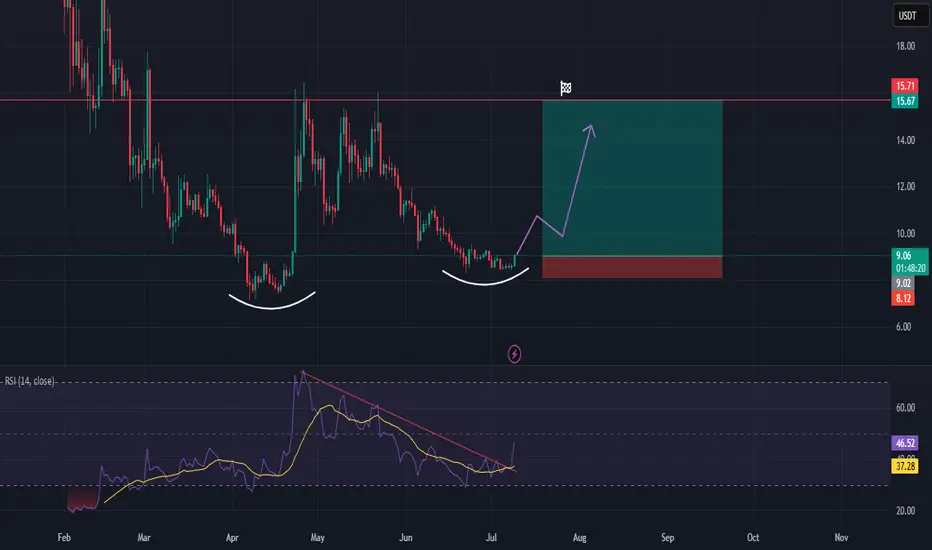
TRUMPUSDT looks very bullishhi traders,
🧠 Chart Overview
Asset: TRUMPUSDT
Timeframe: Daily
🔍 Technical Analysis
Price Structure: We can see a double bottom or rounded bottom formation, suggesting a potential trend reversal from bearish to bullish.
RSI Indicator: The RSI has broken out of its long-term downtrend, which is
Related pairs
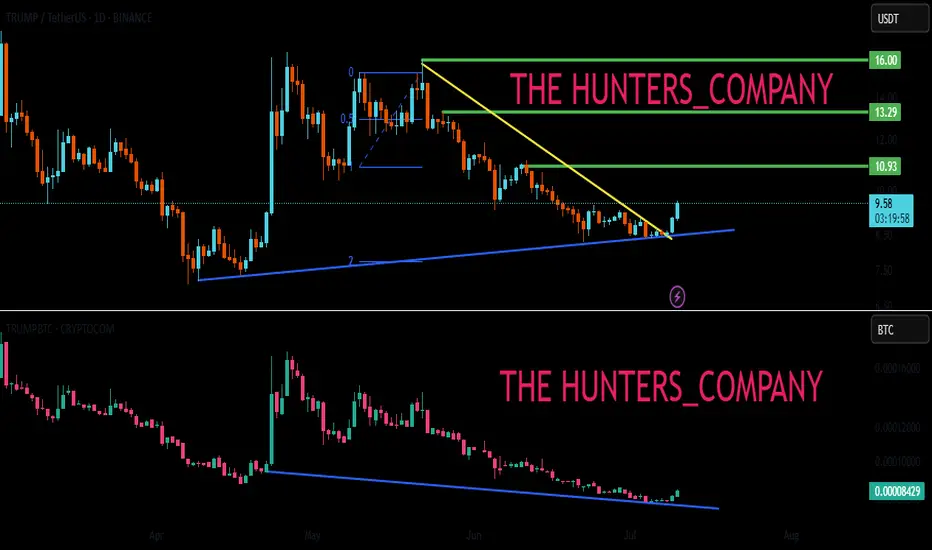
TRUMP BUY ???Hello friends🙌
🔊As you can see in the picture, we have brought you two Trump charts:
1_TRUMP/USDT, in which we see an upward trend.
2_TRUMP/BTC, in which we see a downward trend.
✔Now what is the conclusion? When this negative divergence occurs, it means that money flows from Bit to Tether, and w
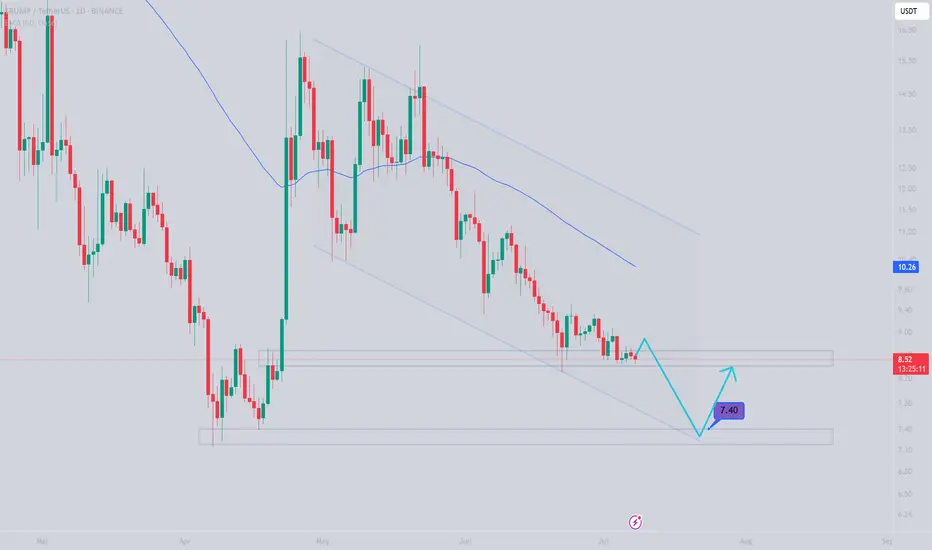
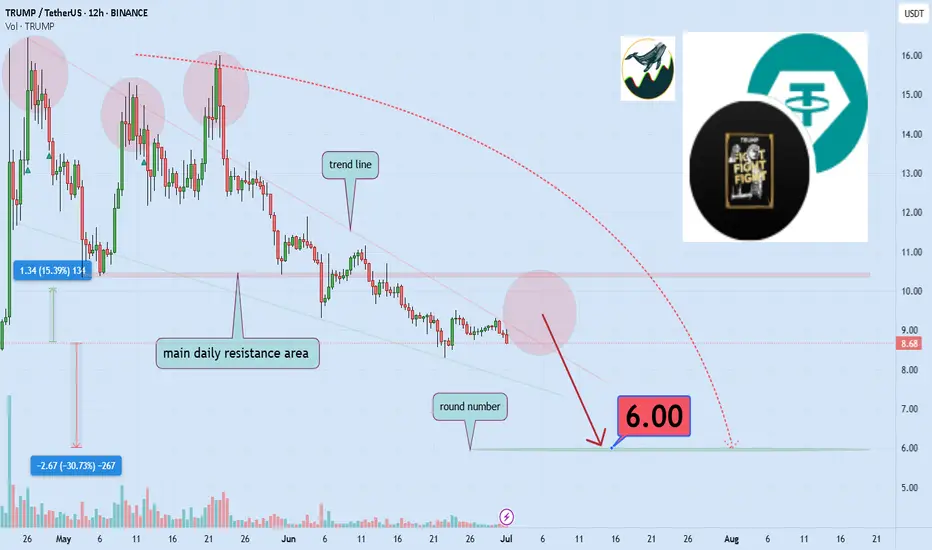
TRUMPUSDTGiven the deep correction and the expectation of a deeper correction and the lack of good demand from the breakeven range,
we expect further declines to the specified range.
With due risk management, it would be reasonable to enter around this area.
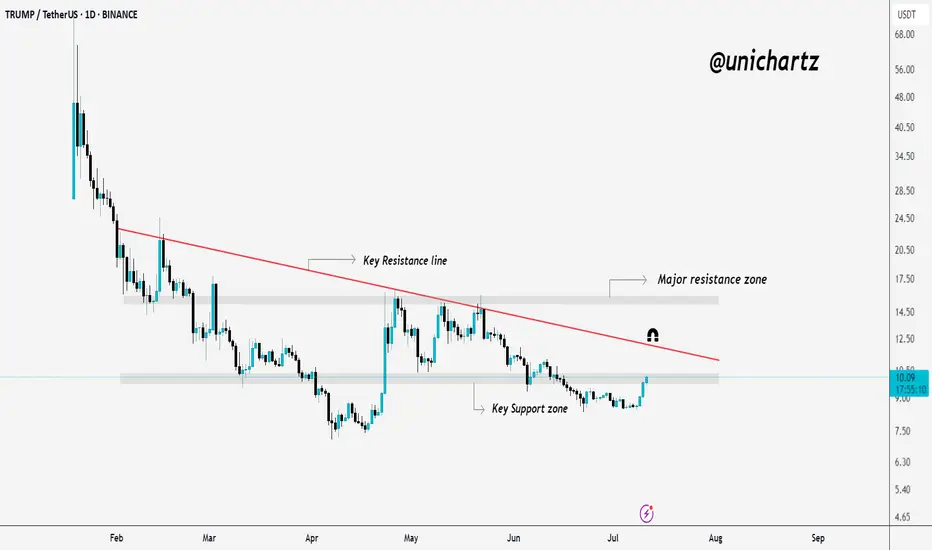
TRUMP/USDT Eyeing a Breakout – Key Levels Ahead!Trump is currently trading just below the resistance zone.
If we see a daily candle close above this key area, it could trigger a move toward the red trendline, and possibly even into the major resistance zone above.
Eyes on the breakout!
DYOR, NFA
Middle East War Whispers: Is Bitcoin About to Crash?The scent of conflict is once again in the air over the Middle East. Tensions are rising, and traders are starting to worry.
If war erupts once more in the region, will Bitcoin and the crypto market survive? Or should we prepare for a heavy drop?
In this analysis, we’ll explore realistic scenarios
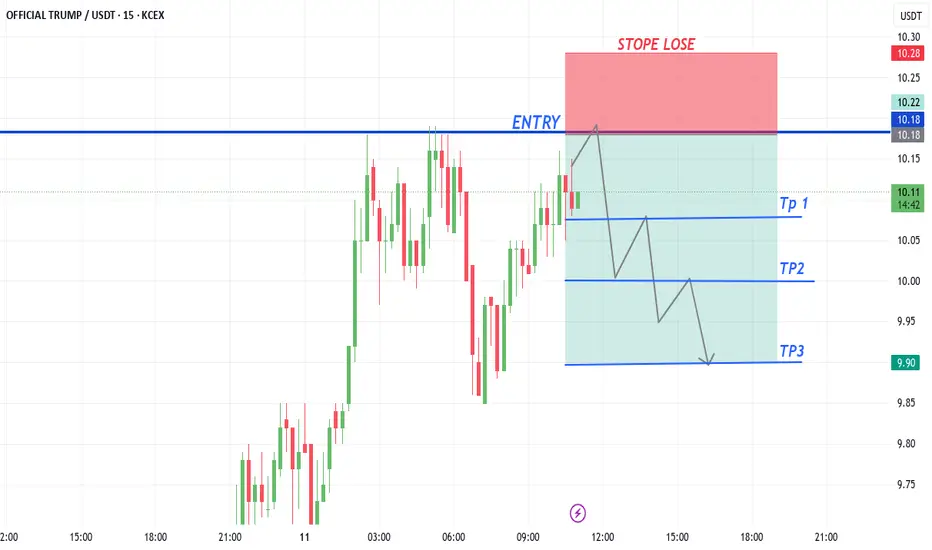
TRUMP COINtrump sell from 10.18
tp1 10.11
tp2 10.00
tp2 09.90
Stope Lose 10.28
Trade at your own risk
3 days of breakoutPulled back to 33% and gave an engulfment as my entry, stop below the low, 50% winning rate for this type of entry, but the risk to reward makes up for it
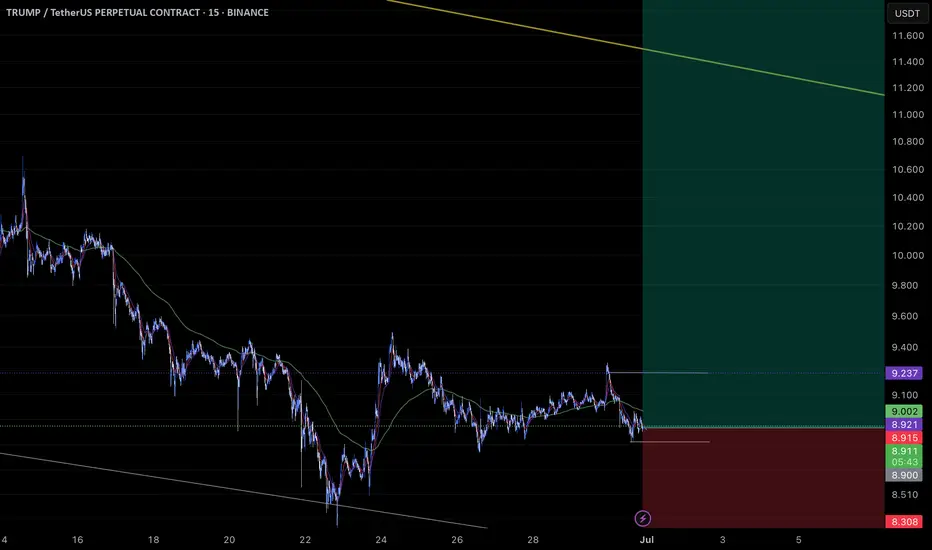
TRUMPUSDT Symmetrical triangle breakout bullish from support📈 BINANCE:TRUMPUSDT – Symmetrical Triangle Breakout Alert! 🟢
1H Time Frame Analysis
Trumpusdt has broken out of a symmetrical triangle pattern from the key support zone at $8.90 — a bullish move is now in play! 🚀
🎯 Technical Targets:
Target 1: $9.20 – Key supply zone
Target 2: $9.50 – Bearish

huge buy (probably)!Hello friend. I wanted to 51 R:R trade open. if it will be ok it would be my new record. lets see what happened. be happy and have a great time(wink)
I believe this chart has bottomed, Alt szn is around the corner Recent PA had retested some great liquidity. I believe in a mini alt szn happening this week. So i believe the RR is worth it. Been a sleeping giant for a bit
See all ideas
Summarizing what the indicators are suggesting.
Oscillators
Neutral
SellBuy
Strong sellStrong buy
Strong sellSellNeutralBuyStrong buy
Oscillators
Neutral
SellBuy
Strong sellStrong buy
Strong sellSellNeutralBuyStrong buy
Summary
Neutral
SellBuy
Strong sellStrong buy
Strong sellSellNeutralBuyStrong buy
Summary
Neutral
SellBuy
Strong sellStrong buy
Strong sellSellNeutralBuyStrong buy
Summary
Neutral
SellBuy
Strong sellStrong buy
Strong sellSellNeutralBuyStrong buy
Moving Averages
Neutral
SellBuy
Strong sellStrong buy
Strong sellSellNeutralBuyStrong buy
Moving Averages
Neutral
SellBuy
Strong sellStrong buy
Strong sellSellNeutralBuyStrong buy
Frequently Asked Questions
The current price of TRUMPUSDT SPOT (TRUMP) is 9.785 USDT — it has risen 3.88% in the past 24 hours. Try placing this info into the context by checking out what coins are also gaining and losing at the moment and seeing TRUMP price chart.
TRUMPUSDT SPOT price has risen by 14.82% over the last week, its month performance shows a −3.06% decrease, and as for the last year, TRUMPUSDT SPOT has decreased by −18.46%. See more dynamics on TRUMP price chart.
Keep track of coins' changes with our Crypto Coins Heatmap.
Keep track of coins' changes with our Crypto Coins Heatmap.
TRUMPUSDT SPOT (TRUMP) reached its highest price on Jan 19, 2025 — it amounted to 77.801 USDT. Find more insights on the TRUMP price chart.
See the list of crypto gainers and choose what best fits your strategy.
See the list of crypto gainers and choose what best fits your strategy.
TRUMPUSDT SPOT (TRUMP) reached the lowest price of 7.150 USDT on Apr 7, 2025. View more TRUMPUSDT SPOT dynamics on the price chart.
See the list of crypto losers to find unexpected opportunities.
See the list of crypto losers to find unexpected opportunities.
The safest choice when buying TRUMP is to go to a well-known crypto exchange. Some of the popular names are Binance, Coinbase, Kraken. But you'll have to find a reliable broker and create an account first. You can trade TRUMP right from TradingView charts — just choose a broker and connect to your account.
TRUMPUSDT SPOT (TRUMP) is just as reliable as any other crypto asset — this corner of the world market is highly volatile. Today, for instance, TRUMPUSDT SPOT is estimated as 4.96% volatile. The only thing it means is that you must prepare and examine all available information before making a decision. And if you're not sure about TRUMPUSDT SPOT, you can find more inspiration in our curated watchlists.
You can discuss TRUMPUSDT SPOT (TRUMP) with other users in our public chats, Minds or in the comments to Ideas.