$TRU 4H chartNYSE:TRU 4H chart has broken out of a descending trendline, showing bullish momentum.
Price is now approaching the key resistance zone around $0.041.
A successful breakout here could push the price toward the $0.0474 target +25%.
Watch for a possible retest of the breakout zone before continuat

#TRU/USDT#TRU
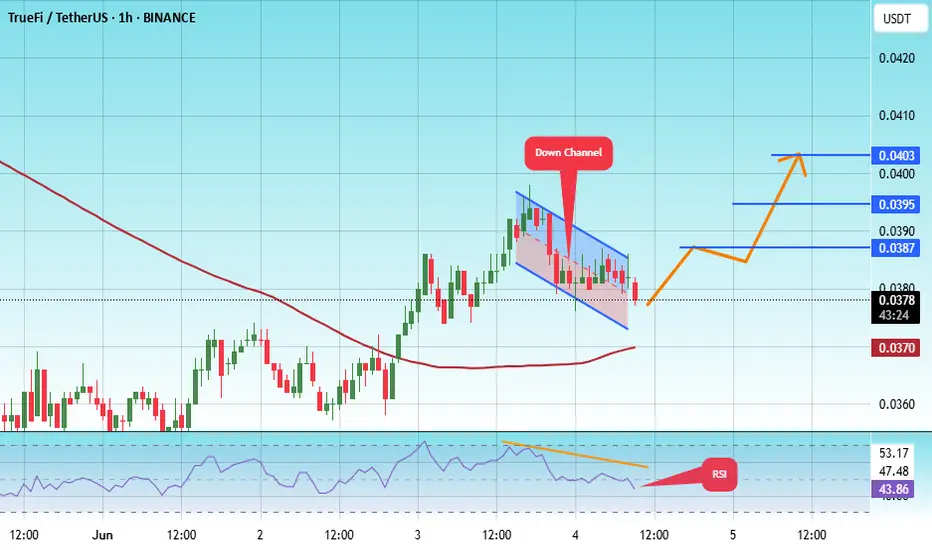
The price is moving within a descending channel on the 1-hour frame, adhering well to it, and is heading towards a strong breakout and retest.
We are experiencing a rebound from the lower boundary of the descending channel.
This support is at 0.0375.
We are experiencing a downtrend on the
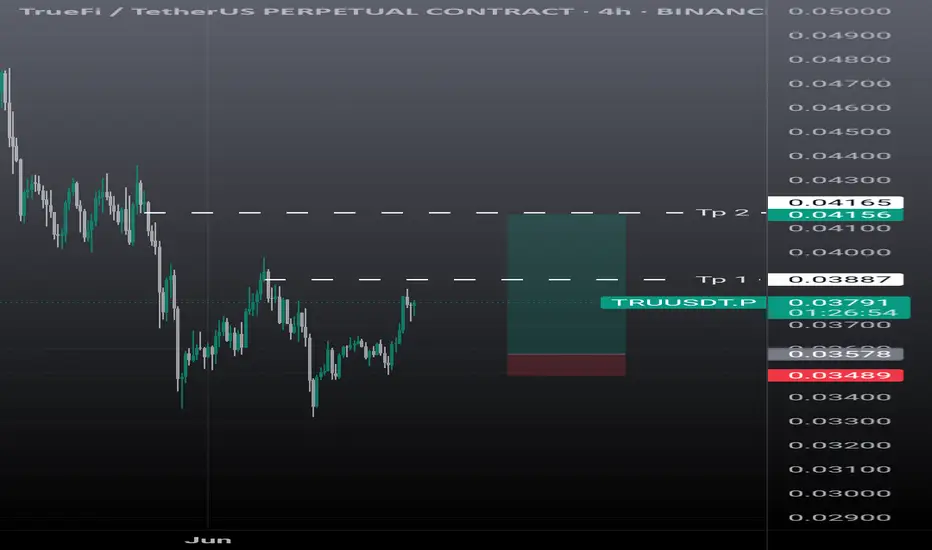
Truusdt truefi buy setupA clean setup, valid until final tp is not hit. Wick doesn't matter if any news day, closing matters.

Tru USDT Swing TradeAs much as we doesn't closes below 0.038 first and confirmed tp is 0.060$ . Wait for the entry and start accumulation of true between 0.040-0.035 set tp 0.060$
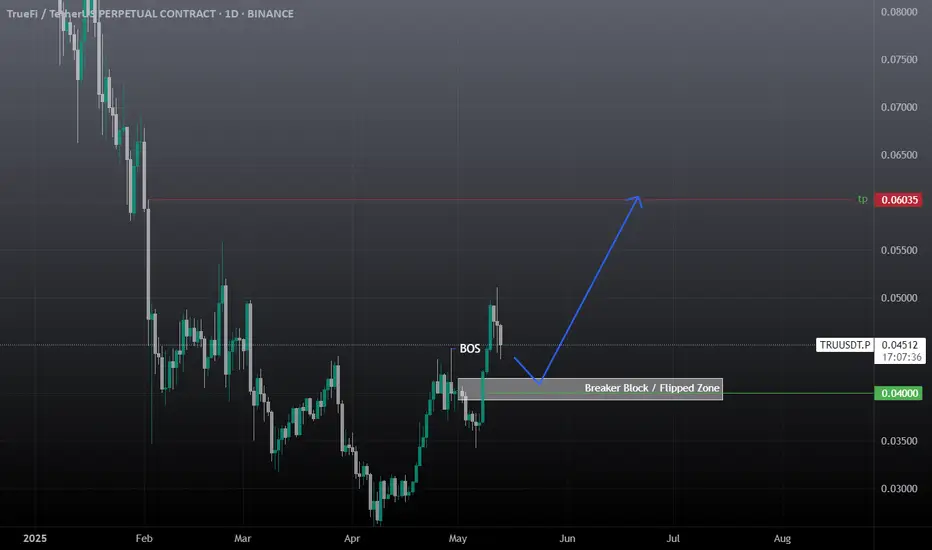
TRUUSDT 1D Analysis TRU ~ 1D Analysis
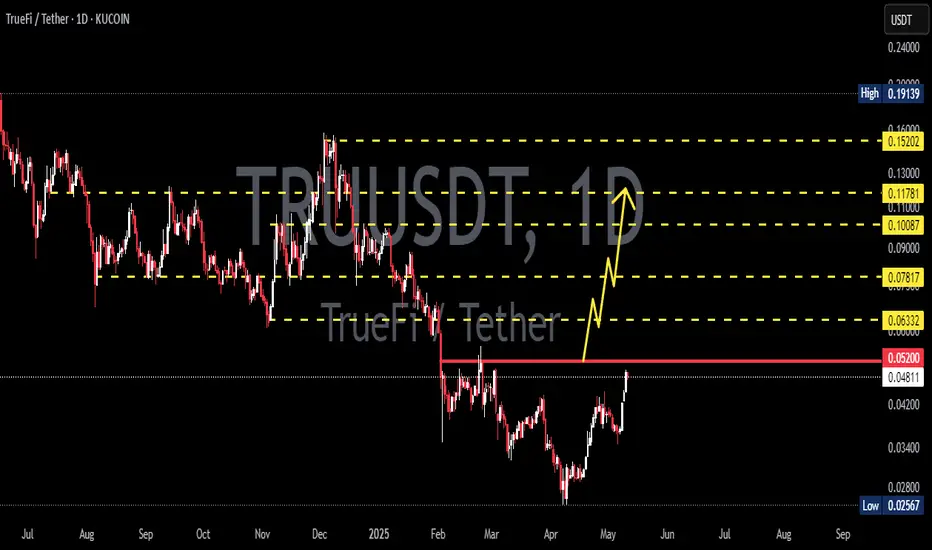
#TRU Buy after successfully breaking the $0.052 resistance line with a short-term target of at least 10%+.
TRUSDT.P LONGI think TRUUSDT is forming an inverse head and shoulder pattern.
At the rectangle box we must see some bullish pattern/candlesticks in order to ride this trade.
Setup is described rest DYOR

TRUUSDT.P small scalpingLooking to scalp this coin.
The idea has been shared. Looking for it to complete the head and shoulder pattern.
The right shoulder still need to be formed. lets wait and look for bearish momentum at the level

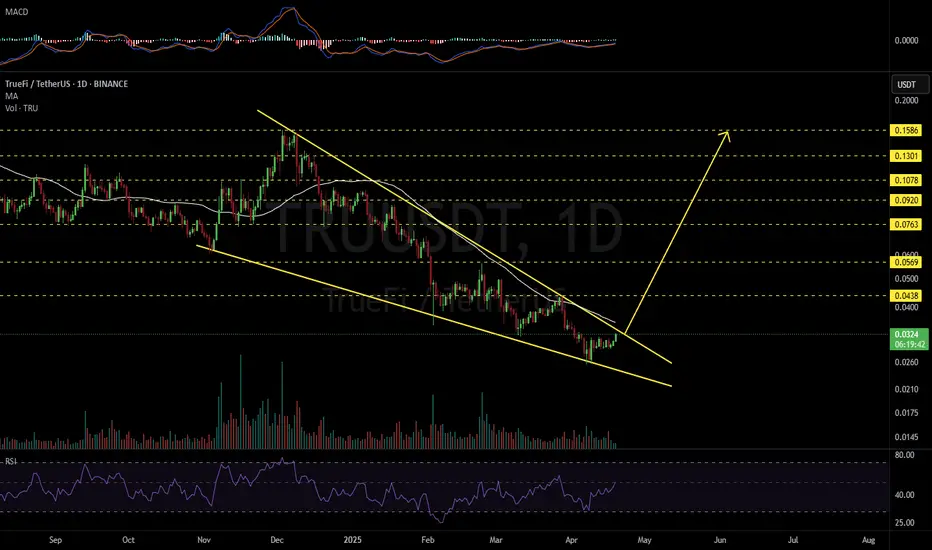
TRUUSDT 1D#TRU is moving inside a falling wedge on the daily chart and is on the verge of breaking out above the pattern resistance.
In case of a breakout, the targets are:
🎯 $0.0438
🎯 $0.0569
🎯 $0.0763
🎯 $0.0920
🎯 $0.1078
🎯 $0.1301
🎯 $0.1586
Use a tight stop-loss.
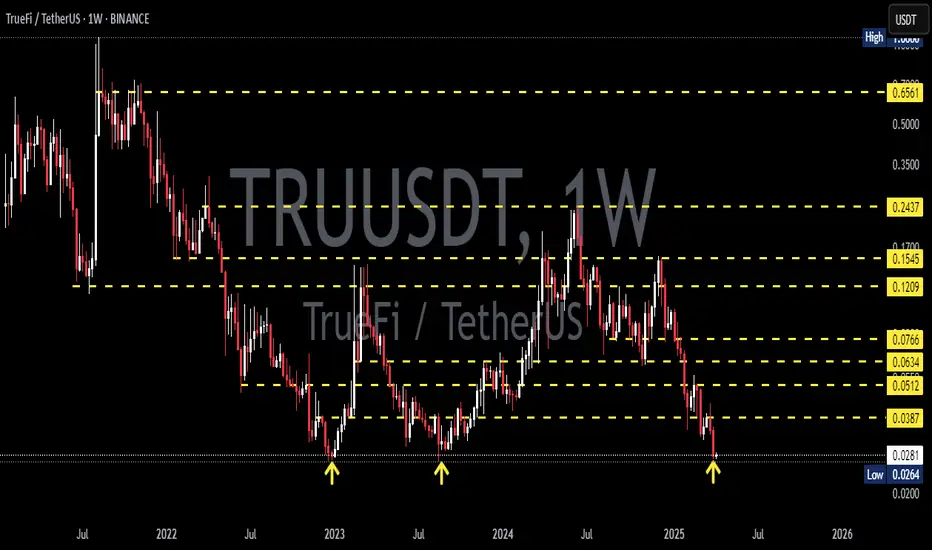
TRUUSDT 1WTRU ~ 1W Analysis
#TRU Key support that must be maintained for now. Loss of this support, will suppress lower prices.
See all ideas
Summarizing what the indicators are suggesting.
Oscillators
Neutral
SellBuy
Strong sellStrong buy
Strong sellSellNeutralBuyStrong buy
Oscillators
Neutral
SellBuy
Strong sellStrong buy
Strong sellSellNeutralBuyStrong buy
Summary
Neutral
SellBuy
Strong sellStrong buy
Strong sellSellNeutralBuyStrong buy
Summary
Neutral
SellBuy
Strong sellStrong buy
Strong sellSellNeutralBuyStrong buy
Summary
Neutral
SellBuy
Strong sellStrong buy
Strong sellSellNeutralBuyStrong buy
Moving Averages
Neutral
SellBuy
Strong sellStrong buy
Strong sellSellNeutralBuyStrong buy
Moving Averages
Neutral
SellBuy
Strong sellStrong buy
Strong sellSellNeutralBuyStrong buy
Displays a symbol's price movements over previous years to identify recurring trends.