Tron (TRX) - March 29Hello?
Dear traders, nice to meet you.
By "following" you can always get new information quickly.
Please also click "Like".
Have a nice day.
-------------------------------------------------- -----
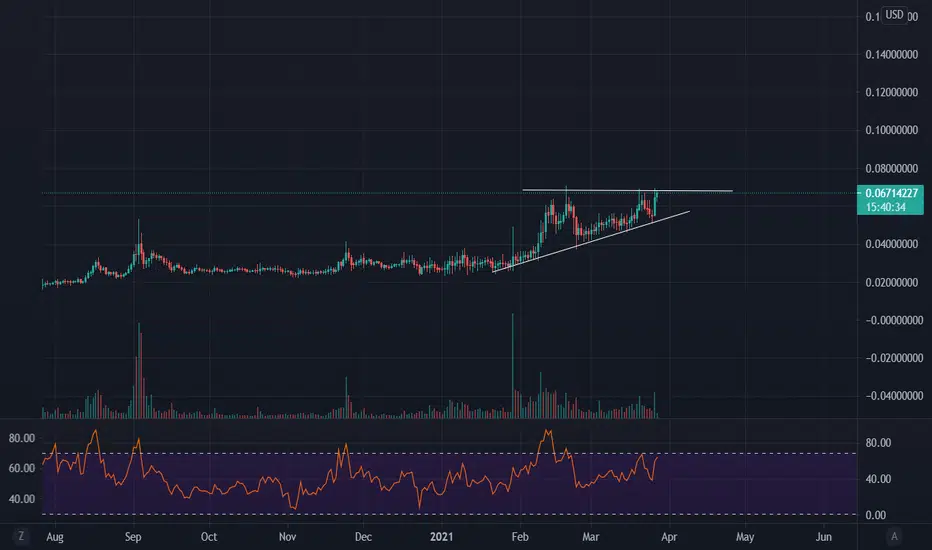
We have to see if we can get support and climb in the 0.06123805-0.06387631 segment.
If it falls, you need to make sure you get support at 0.05596154.
If you go down at the 0.05596154 point, you need a short stop loss.
If it is supported at 0.06387631, it is expected to rise towards 0.07970585.
On the CCI-RC indicator, it remains to be seen if the CCI line can rise above the EMA line.
-----------------------------------------
(TRXBTC 1D chart)
We have to see if we can get support at 114 Satoshi and climb along the uptrend line.
If it breaks above the M-Signal on the 1W chart and deviates from the downtrend line, further gains are expected.
-------------------------------------------------- -------------------------------------------
** All indicators are lagging indicators.
So, it's important to be aware that the indicator moves accordingly with the movement of price and volume.
Just for convenience, we are talking upside down for interpretation of the indicators.
** The wRSI_SR indicator is an indicator created by adding settings and options from the existing Stochastic RSI indicator.
Hence, the interpretation is the same as the traditional Stochastic RSI indicator. (K, D line -> R, S line)
** The OBV indicator was re-created by applying a formula to the DepthHouse Trading indicator, an indicator that oh92 disclosed. (Thank you for this.)
** Check support, resistance, and abbreviation points.
** Support or resistance is based on the closing price of the 1D chart.
** All explanations are for reference only and do not guarantee profit or loss on investment.
Explanation of abbreviations displayed on the chart
R: A point or section of resistance that requires a response to preserve profits
S-L: Stop Loss point or section
S: A point or segment that can be bought for profit generation as a support point or segment
(Short-term Stop Loss can be said to be a point where profits and losses can be preserved or additionally entered through installment transactions. It is a short-term investment perspective.)
GAP refers to the difference in prices that occurred when the stock market, CME, and BAKKT exchanges were closed because they do not trade 24 hours a day.
G1: Closing price when closed
G2: Cigar at the time of opening
(Example) Gap (G1-G2)
TRXHTX_ACA197.USD trade ideas

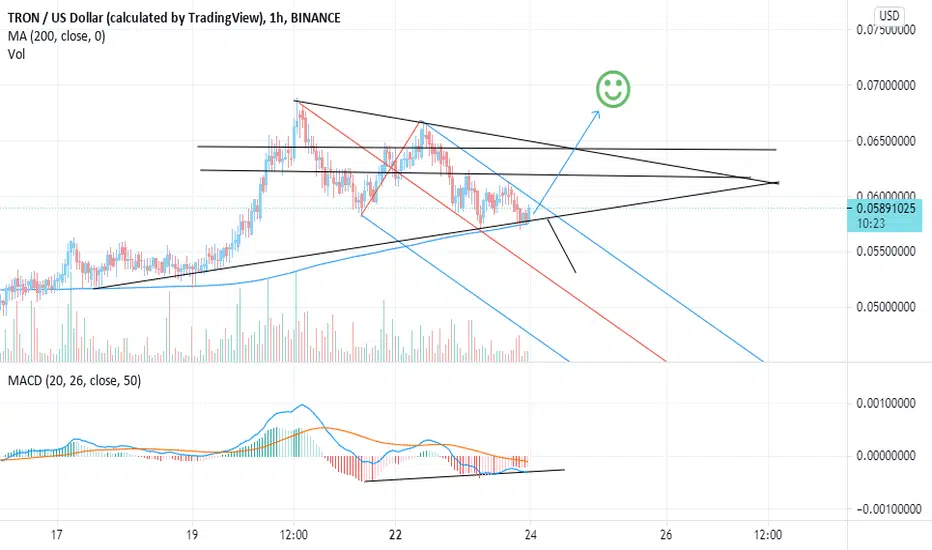
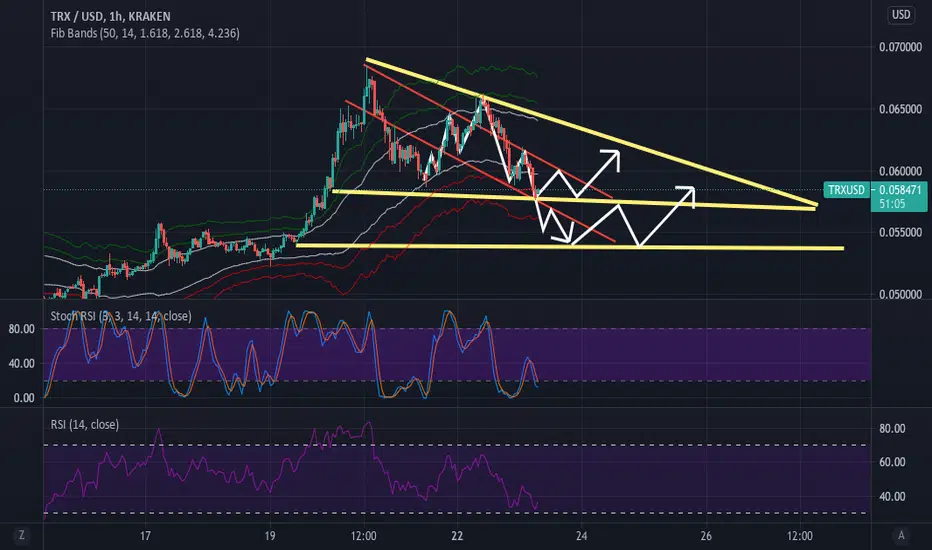
will it hit the targets?lets see if it works in 1h time frame. it has proven to be pretty accurate during the past weeks. will see...
ideas are welcomed.
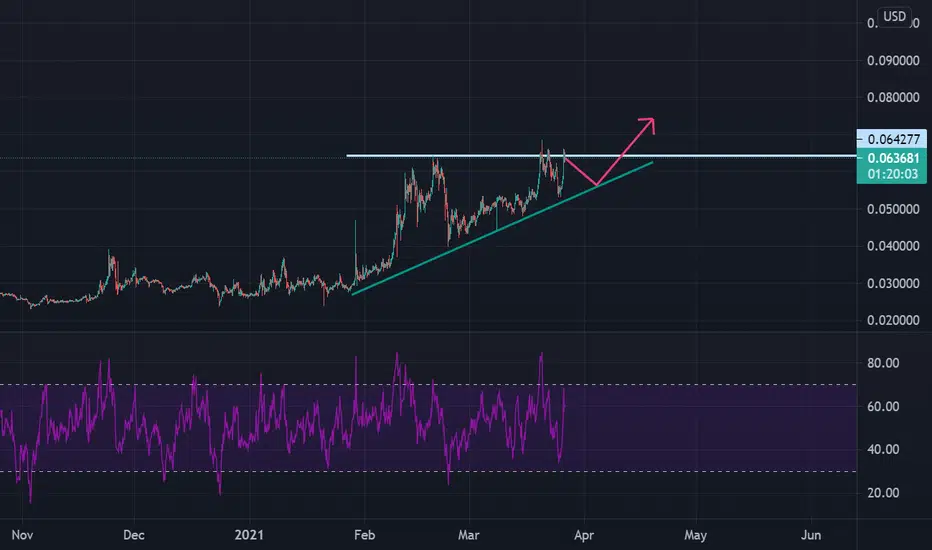
TRX Looking to Rip to New HighsTron has been somewhat of a slow mover this bull market, perhaps the sentiment from the previous cycle as somewhat of a 'scam' coin has hindered it.
However this presents an opportunity for growth. I'm watching the overhead diagonal resistance here for a break to enter. As can be seen from the RSI there is still plenty of room for a move to the upside.
Also have a look at the 3 day chart against bitcoin, it looks great!
And as we know from the previous bull cycle, Justin Sun is a good marketer, and when Tron runs it bangs!
Good luck and please give me a follow if you liked this content :)

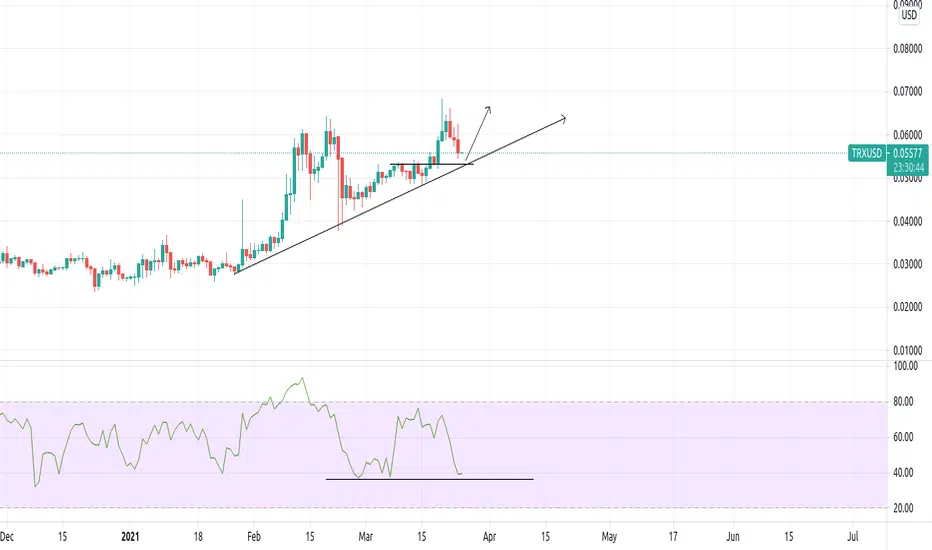
TRX-USDThe direction appears to be up at the end of the triangle.
Practicing technical analysis charting. -Good Luck
TRON Bullish Breakout Ascending triangular formation on TRON sounds interesting to attract more buyers
React and discuss what you think about my prediction ?Ladies en gentleman
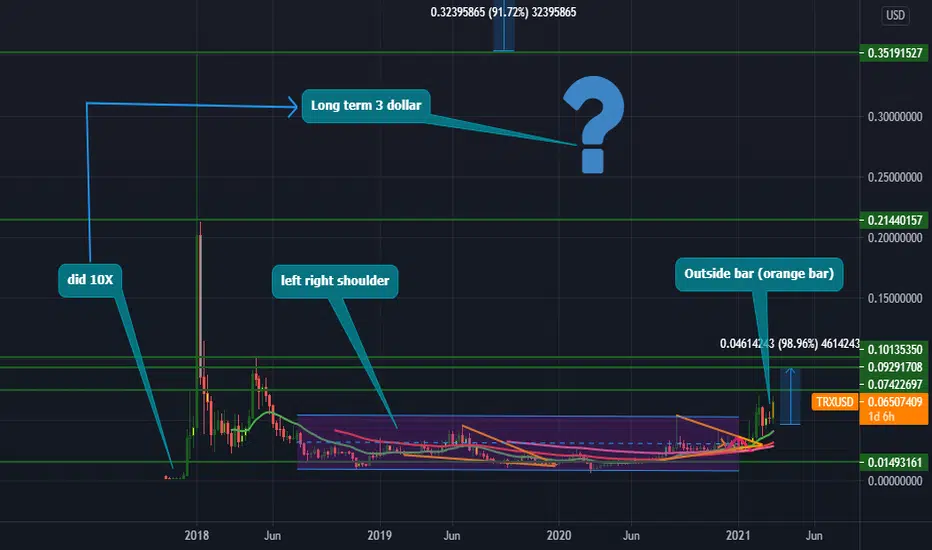
The chart from the only and one Tron IS VERY BULLISH in my eyes because of the left right shoulders and making a U-form back to his all time high back in 2016-2017
My long term is 3 dollar based on the 10 X from the bottom.
My mid term would be 0.60 dollar based on the middle line from the left right shoulders
What are your thoughts and what is your prediction and based on what?
Let's interact.
Feel free to hit the like button, react and share.
PEACE!
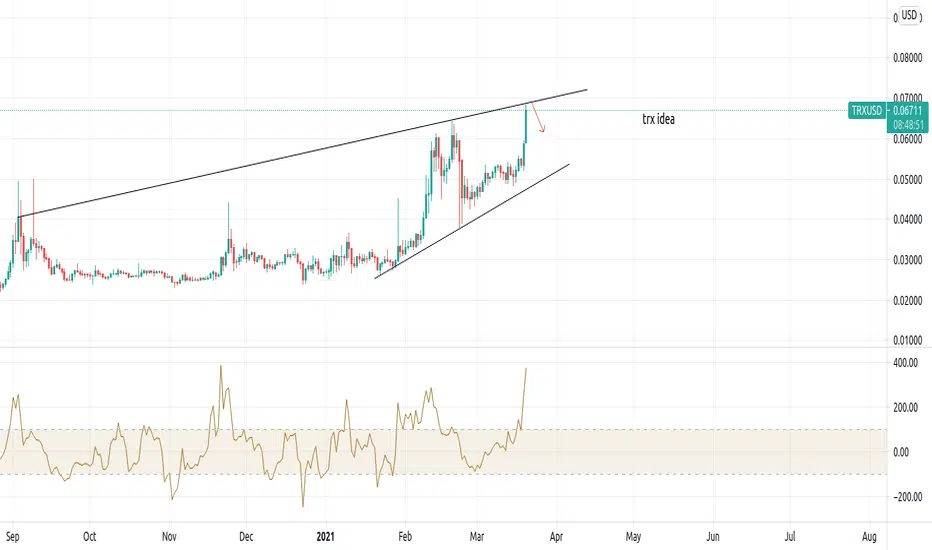
trx ideathere is no reason for this thing to be this high this quick, i think it retraces from here, this is no a recomendation
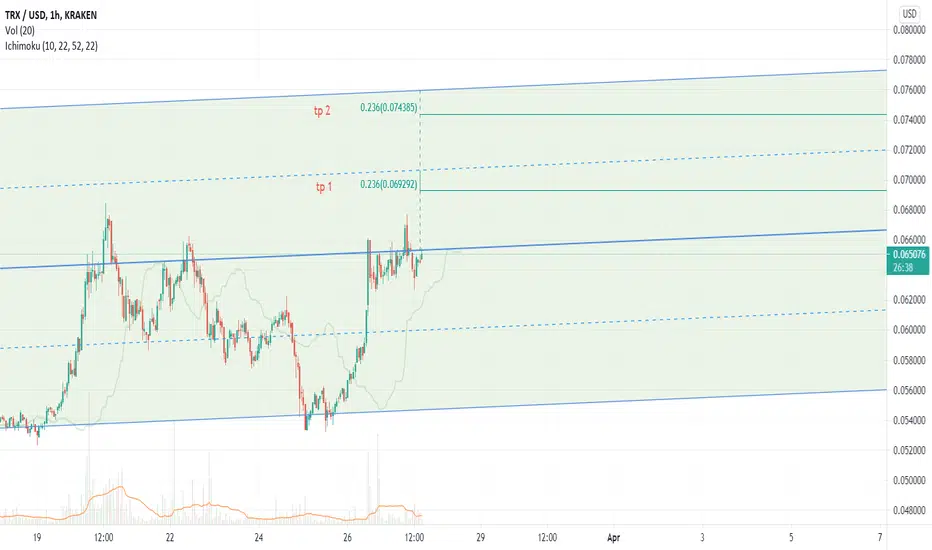
Consolidation below resistance is bullish trxusdtrx usdt chart confluence with the trxbtc double bottom deviation
looks like this one getting sent soon 1-4weeks imo
prbly will be with the rest of the altcap
but still, 48% and then 400% targets
4x in 3months probalby thats a fairly good mid term swing

TRX isn't stoppable even if BTC goes to correction!A strong bullish structure has been shaped and TRX will reach the targets.
$TRX has so much potential on the upside.NOT FINANCIAL ADVICE
Now Justin Sun may not have the cleanest of blockchain records, and may have rubbed some people the wrong way, but make no mistake that Tron Protocol itself is quite usable.
Its fundamentals may have changed somewhat, post pandemic as it 'embraced' DeFi and began on a journey of self-rediscovery, especially on the wings of $USDT use.
Let's give it a shot.
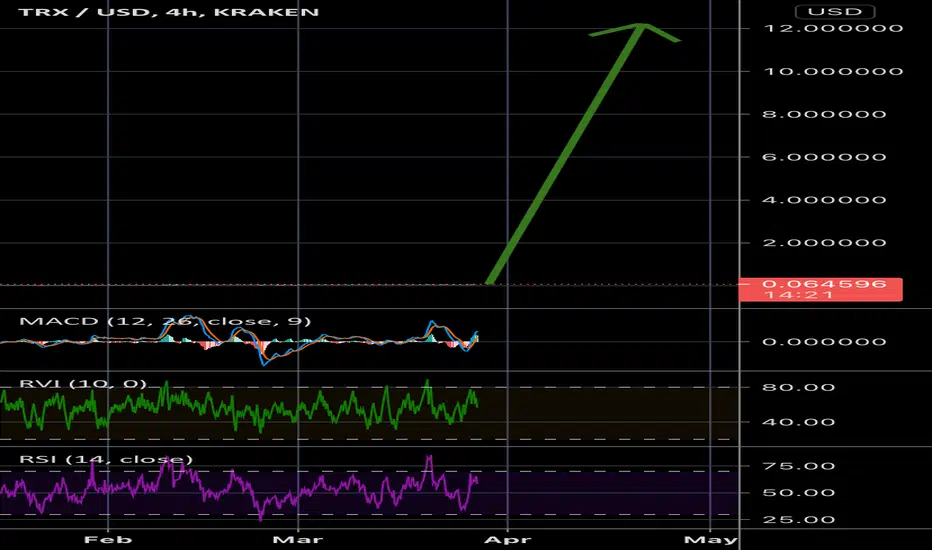
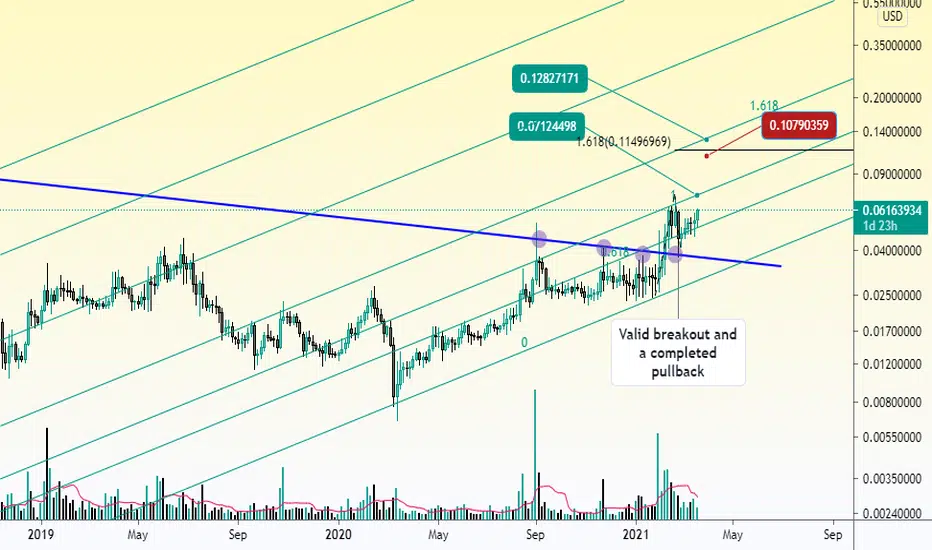
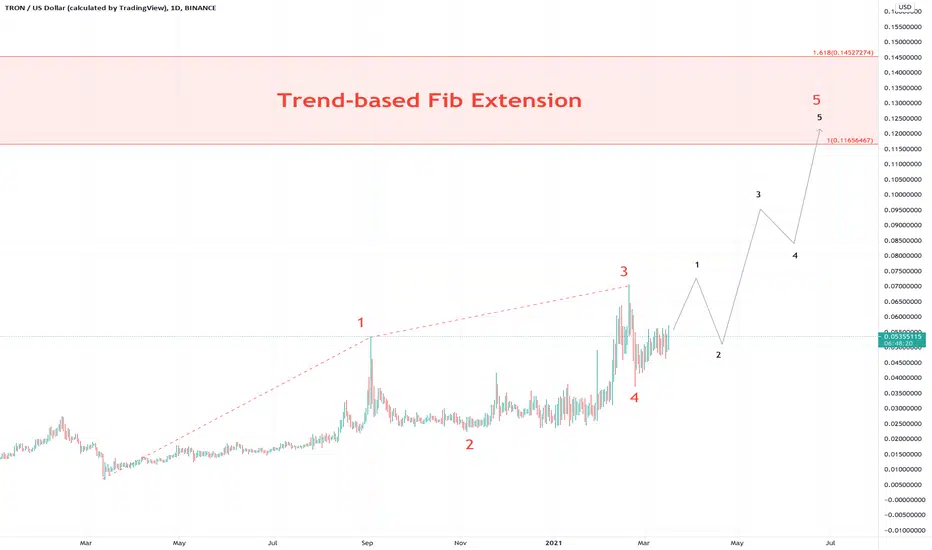
Elliot Wave Analysis
It looks like $TRX have been undergoing a very compressed consolidation period since Mar 2020, and it looks set for a parabolic run in the near future.
It may seem that we have reached all signs that point towards a corrective trend, aka Wave 4 completion.
We are on Impulse Wave 5 underway, and nothing less than 11.6cents will be our target price.
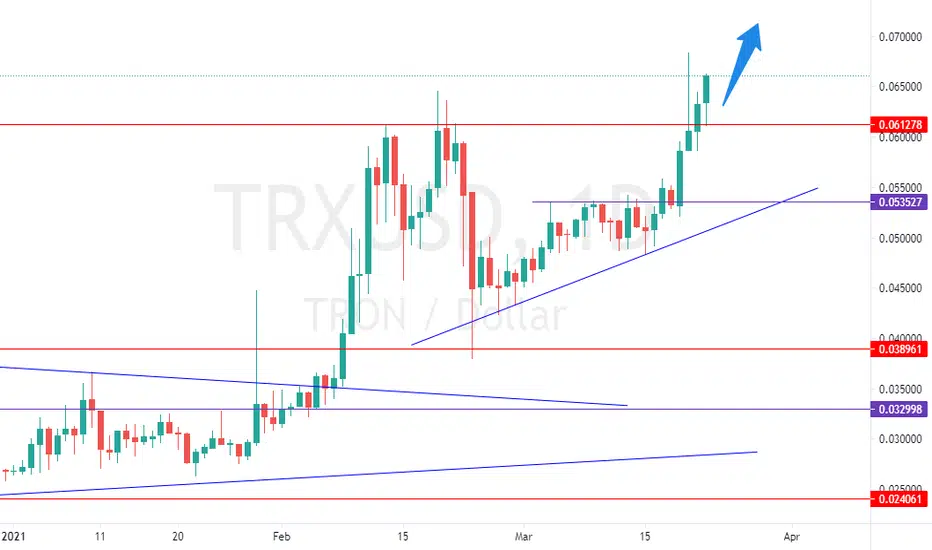
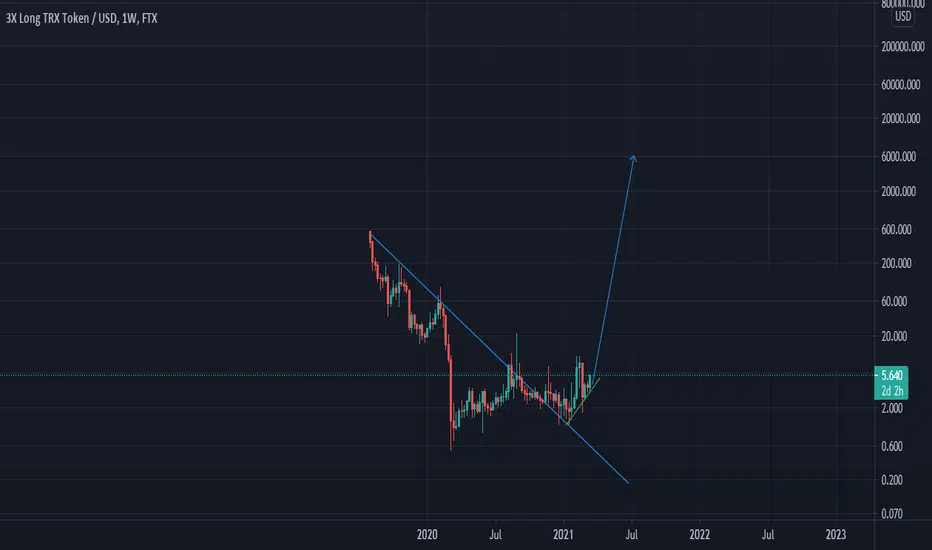
TRX could finally do something!While Many Alts have reached their ATH in Feb Bull run or are about to, Tron lagged behind. However with the recent announcement of Tron entering Defi and also looking at the chart in the Weekly time frame I am giving it a high chance to Tron for some sharp gains in March.
In the weekly chart we can see that it has broken out of its descending triangle for a while and that it has not broken the green trend line support since June. since first week of Feb it's been also riding on the support of Purple line without closing below it.
the Bearish momentum signal has still not given a Volatile circle however I expect to see it in next week's candle.
If needed I will update the analysis in coming week.
in most bullish scenario it could reach the 2nd Target before end of March.
NOT A FINANCIAL ADVICE!
P.S Also hope Mr. Sun helps this momentum by sharing a Funda news which despite his usual hype attempts, is actually meaningful.

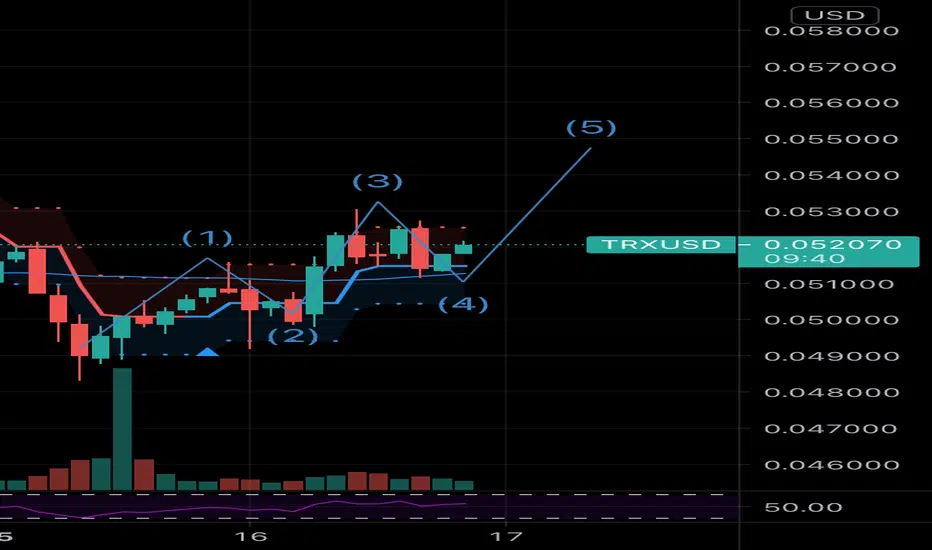
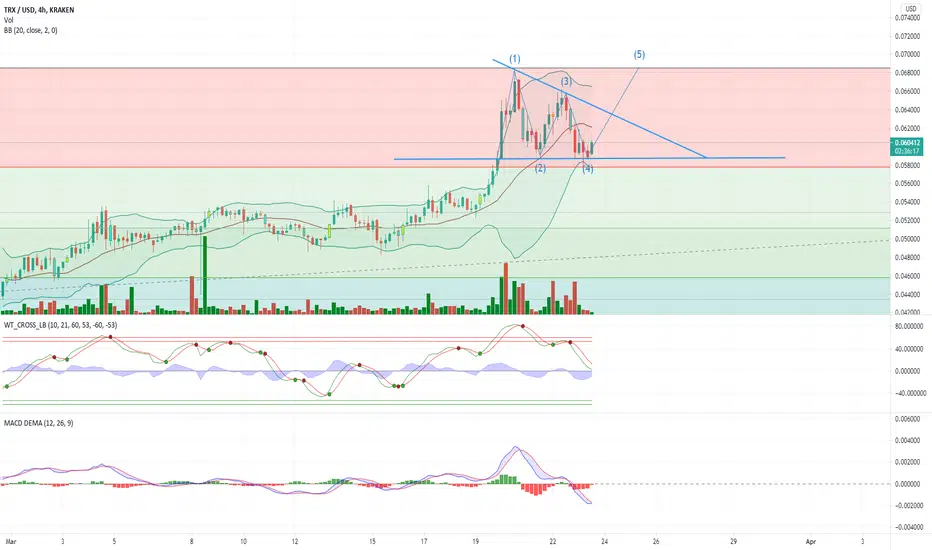
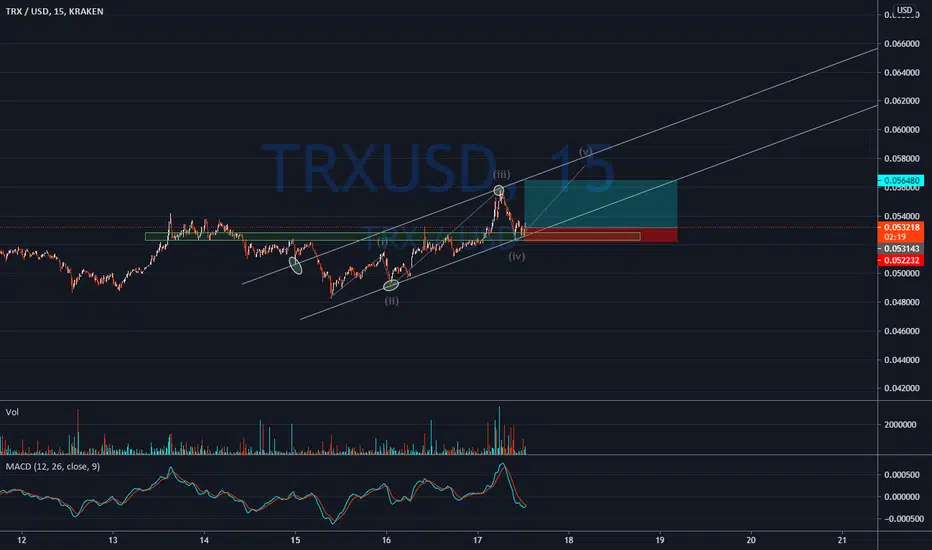
TRXUSD 4th Wave longlooks like it could either be a 4th wave, or a 5th wave, but if we are right about 4, we could see this blow, reduce risk, ride it out.
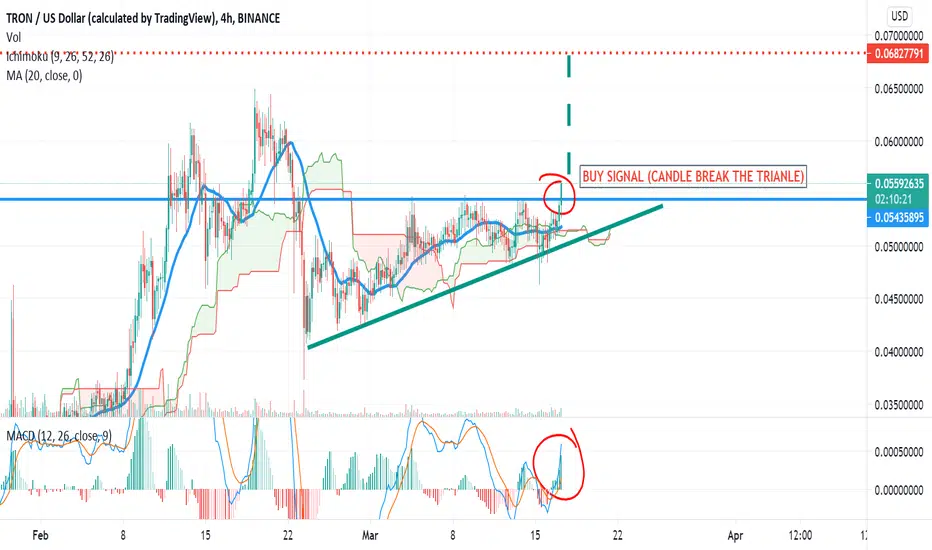
TRON (TRX) BREAK THE TRIANGLE AND KEEP BULLTron (TRX) Made a Ascending Triangle in tf H4 and Ready to Make New ATH, i Optimism