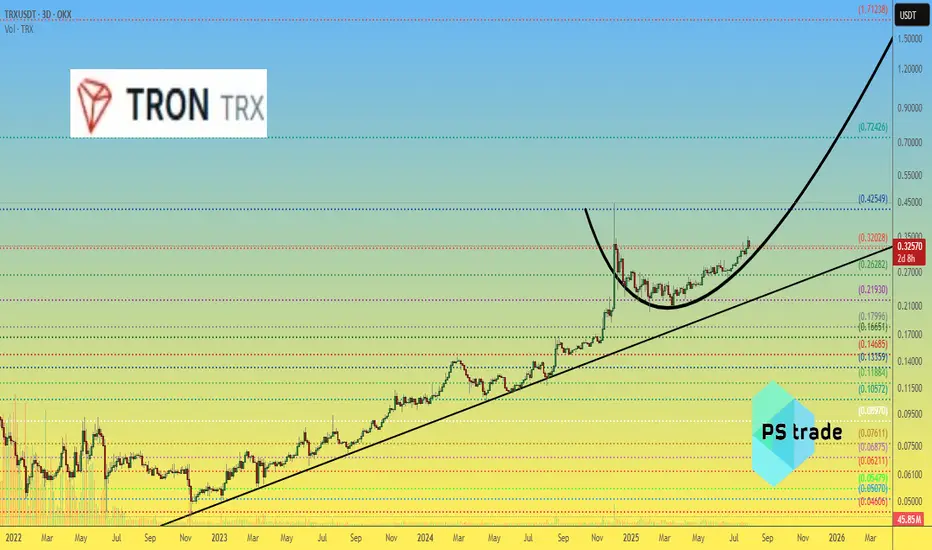
$TRX — "The Samurai Path" of Crypto? Long-term TRON outlook In a market where coins spike and crash from every tweet, CRYPTOCAP:TRX behaves like a stoic monk.
The price of OKX:TRXUSDT moves steadily, avoiding wild dumps and pumps — as if it exists in a parallel reality.
Now consider two events that would usually explode any altcoin’s chart — but not CR
Related pairs
TRON Eyes 17 Percent Surge Toward Explosive 0.37 Breakout TargetHello✌
Let’s analyze TRON’s upcoming price potential 📈.
BINANCE:TRXUSDT is currently approaching a key daily support zone that aligns with a notable Fibonacci retracement level 🧭. This technical confluence suggests a potential short-term rebound, and I’m watching for a possible move of around

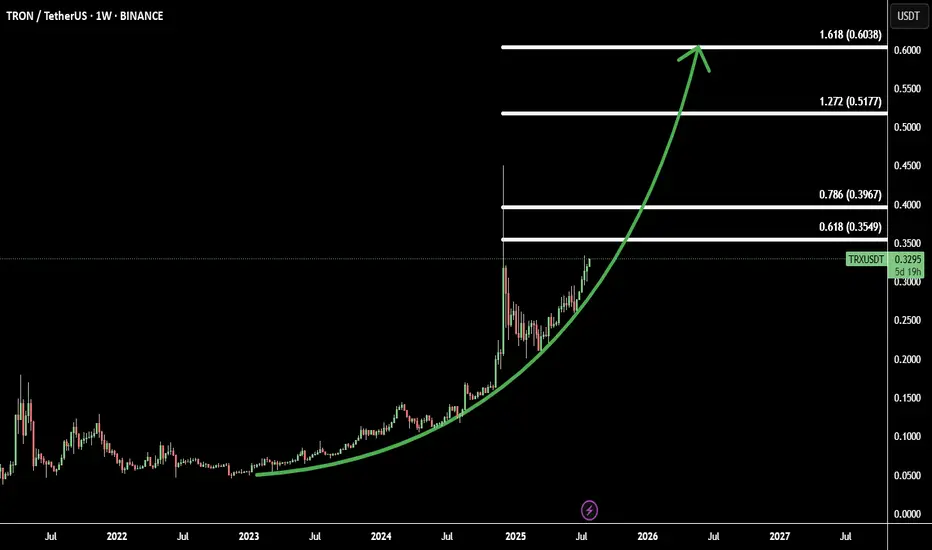
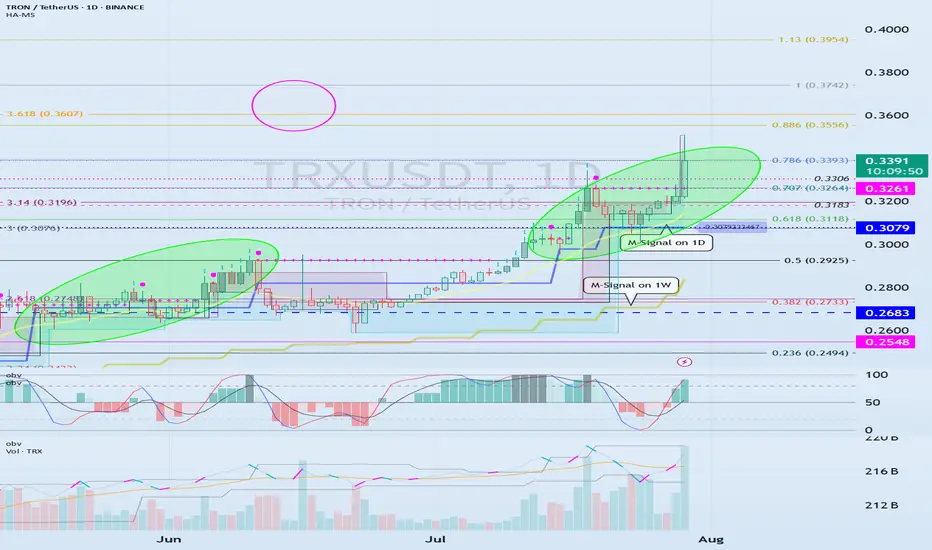
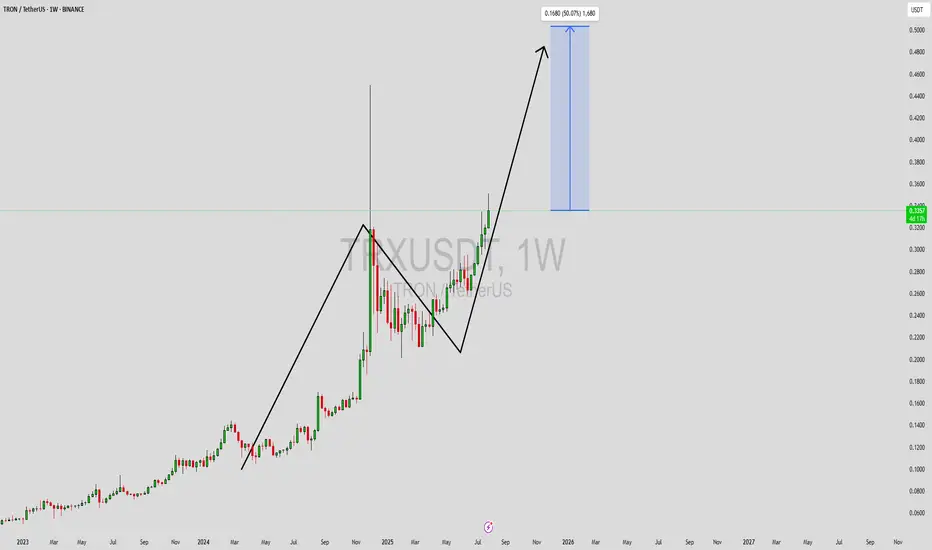
TRX/USDT Starting Parabolic Move: 4 Fibonacci Targets in SightTRX (Tron) is showing early signs of a parabolic breakout, supported by strong momentum and a solid technical structure.
After a long accumulation phase, TRX has gained bullish traction and is now accelerating. The price action suggests the beginning of a steep upward curve, often associated with p
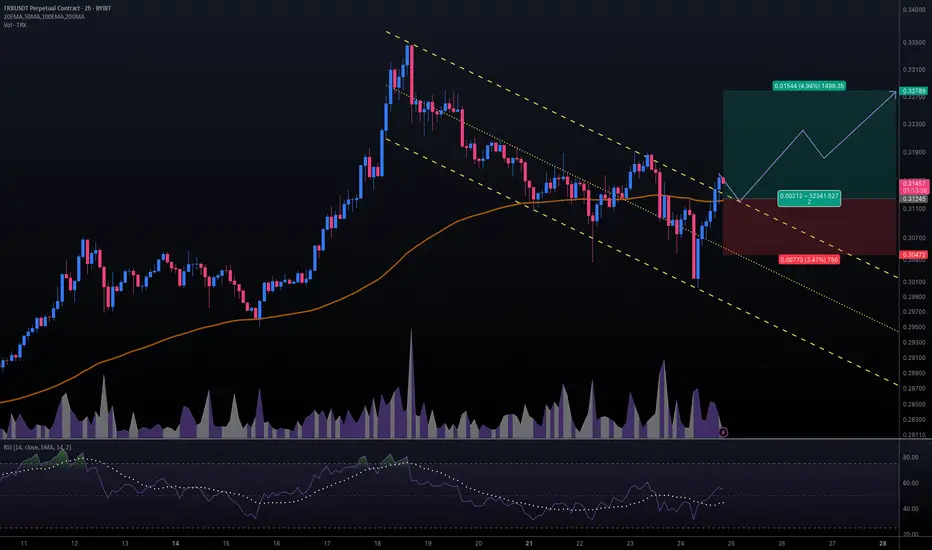
#TRXUSDT #2h (ByBit) Descending channel breakout and retestTron just regained 100EMA support and seems ready for bullish continuation after a pullback to it.
⚡️⚡️ #TRX/USDT ⚡️⚡️
Exchanges: ByBit USDT
Signal Type: Regular (Long)
Leverage: Isolated (16.0X)
Amount: 5.1%
Entry Targets:
1) 0.31245
Take-Profit Targets:
1) 0.32789
Stop Targets:
1) 0.30472
Pub
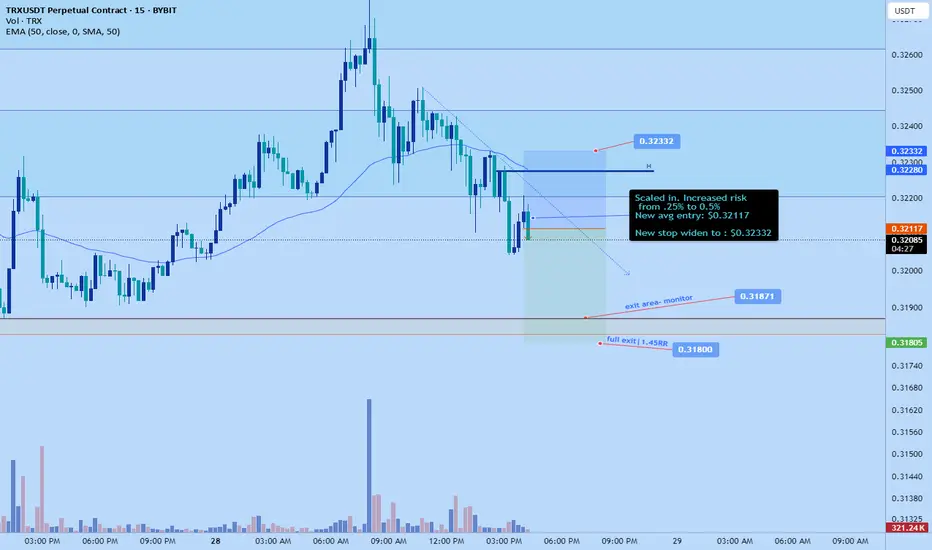
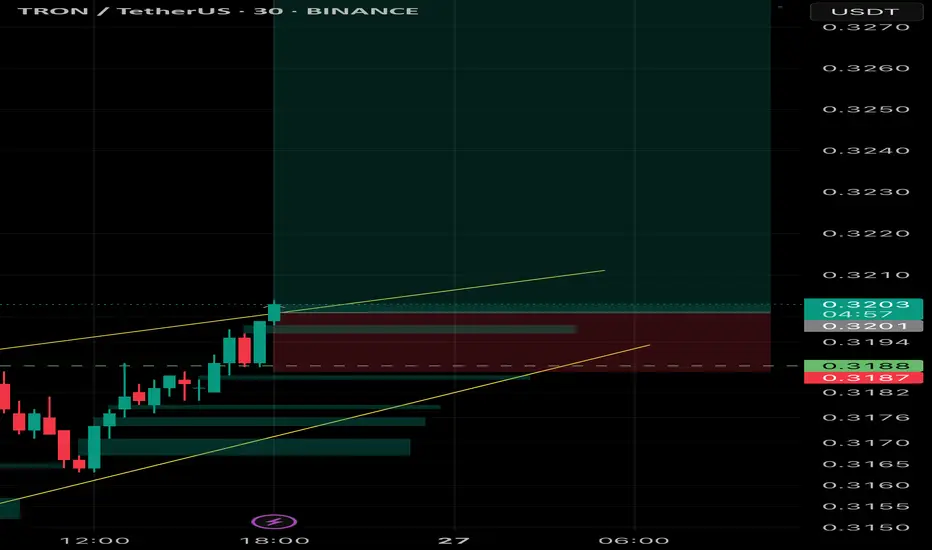
Trx scalp shortsl: $0.32332
Tp: $0.3180
Daily correction seems to be happening on trx. Lower tf flipping bearish to facilitate the move.
Time sensitive
Roughly 1:1 rr from current entry
Check if the second step-up trend can be maintained
Hello, traders.
If you "Follow" us, you'll always get the latest information quickly.
Have a great day.
-------------------------------------
(TRXUSDT 1M Chart)
We need to see if the price can sustain itself by rising above the left Fibonacci level 3.618 (0.3607) and the right Fibonacci level 1
TRX 3000 RRRTrx is going to the moon, maybe. 5$ macro target imo on a super tight stop. A trader can dream let’s see mega moonshot
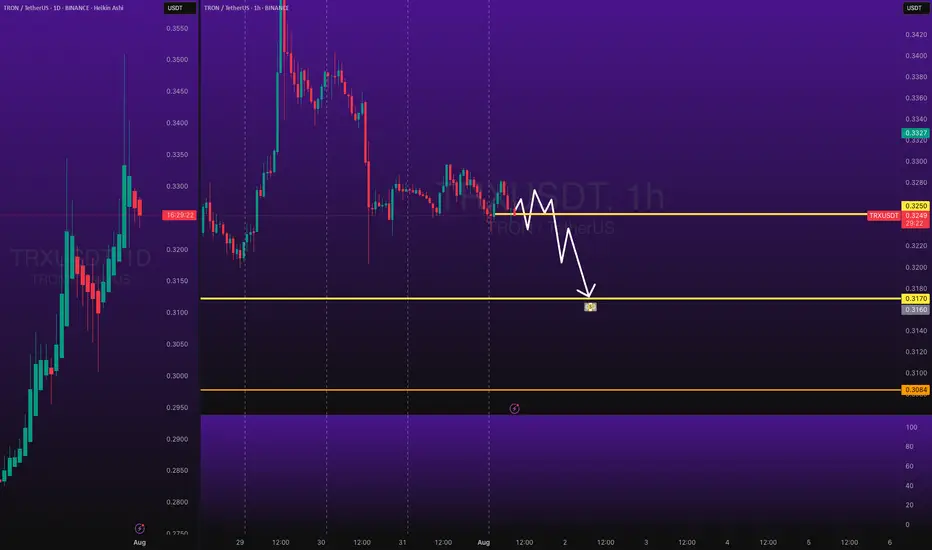
TRXUSDT Short Trade - Price CorrectionsBINANCE:TRXUSDT Short Day Trade - Low Risk, with my back testing of this strategy, it hits multiple possible take profits, manage your position accordingly.
Note: Manage your risk yourself, its risky trade, see how much your can risk yourself on this trade.
Use proper risk management
Looks like
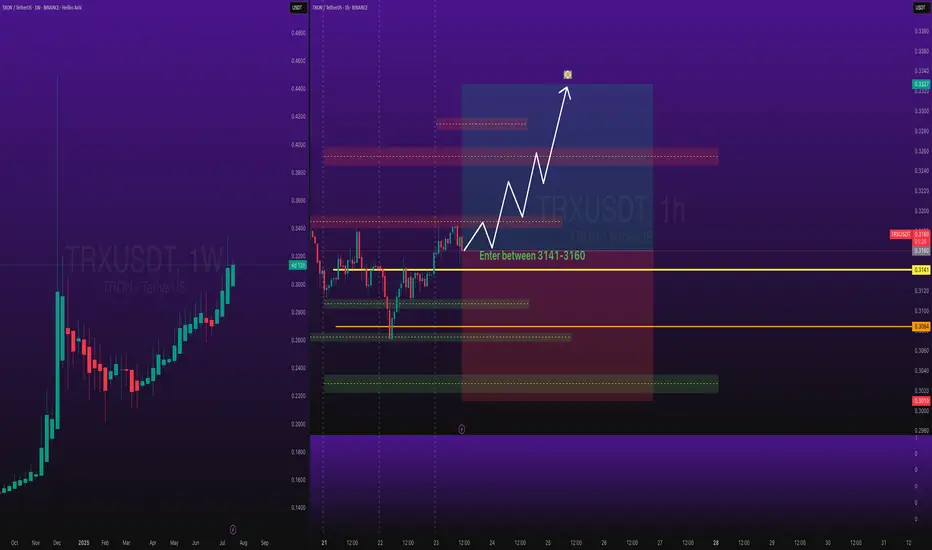
TRXUSDT Long SwingBINANCE:TRXUSDT Long Swing Trade, with my back testing of this strategy, it hits multiple possible take profits, manage your position accordingly.
This is good trade, don't overload your risk like greedy, be disciplined trader.
I manage trade on daily basis.
Use proper risk management
Looks lik
TRXUSDT Forming bullish continuationTRXUSDT (TRON/USDT) is currently showing a strong bullish continuation pattern on the weekly chart, suggesting that the momentum is far from over. After a solid upward rally followed by a corrective wave, the price has resumed its uptrend with clear higher highs and higher lows forming on the chart.
See all ideas
Summarizing what the indicators are suggesting.
Oscillators
Neutral
SellBuy
Strong sellStrong buy
Strong sellSellNeutralBuyStrong buy
Oscillators
Neutral
SellBuy
Strong sellStrong buy
Strong sellSellNeutralBuyStrong buy
Summary
Neutral
SellBuy
Strong sellStrong buy
Strong sellSellNeutralBuyStrong buy
Summary
Neutral
SellBuy
Strong sellStrong buy
Strong sellSellNeutralBuyStrong buy
Summary
Neutral
SellBuy
Strong sellStrong buy
Strong sellSellNeutralBuyStrong buy
Moving Averages
Neutral
SellBuy
Strong sellStrong buy
Strong sellSellNeutralBuyStrong buy
Moving Averages
Neutral
SellBuy
Strong sellStrong buy
Strong sellSellNeutralBuyStrong buy
Displays a symbol's price movements over previous years to identify recurring trends.
Frequently Asked Questions
The current price of TRON / Tether USD (TRX) is 0.322149 USDT — it has fallen −0.45% in the past 24 hours. Try placing this info into the context by checking out what coins are also gaining and losing at the moment and seeing TRX price chart.
TRON / Tether USD price has risen by 3.26% over the last week, its month performance shows a 15.55% increase, and as for the last year, TRON / Tether USD has increased by 161.37%. See more dynamics on TRX price chart.
Keep track of coins' changes with our Crypto Coins Heatmap.
Keep track of coins' changes with our Crypto Coins Heatmap.
TRON / Tether USD (TRX) reached its highest price on Dec 4, 2024 — it amounted to 0.449724 USDT. Find more insights on the TRX price chart.
See the list of crypto gainers and choose what best fits your strategy.
See the list of crypto gainers and choose what best fits your strategy.
TRON / Tether USD (TRX) reached the lowest price of 0.006842 USDT on Mar 13, 2020. View more TRON / Tether USD dynamics on the price chart.
See the list of crypto losers to find unexpected opportunities.
See the list of crypto losers to find unexpected opportunities.
The safest choice when buying TRX is to go to a well-known crypto exchange. Some of the popular names are Binance, Coinbase, Kraken. But you'll have to find a reliable broker and create an account first. You can trade TRX right from TradingView charts — just choose a broker and connect to your account.
Crypto markets are famous for their volatility, so one should study all the available stats before adding crypto assets to their portfolio. Very often it's technical analysis that comes in handy. We prepared technical ratings for TRON / Tether USD (TRX): today its technical analysis shows the buy signal, and according to the 1 week rating TRX shows the strong buy signal. And you'd better dig deeper and study 1 month rating too — it's buy. Find inspiration in TRON / Tether USD trading ideas and keep track of what's moving crypto markets with our crypto news feed.
TRON / Tether USD (TRX) is just as reliable as any other crypto asset — this corner of the world market is highly volatile. Today, for instance, TRON / Tether USD is estimated as 0.28% volatile. The only thing it means is that you must prepare and examine all available information before making a decision. And if you're not sure about TRON / Tether USD, you can find more inspiration in our curated watchlists.
You can discuss TRON / Tether USD (TRX) with other users in our public chats, Minds or in the comments to Ideas.