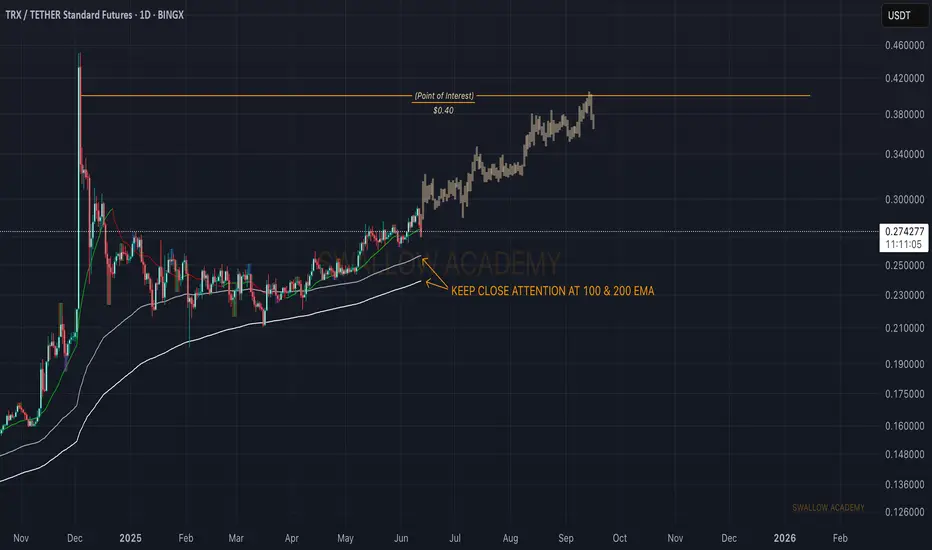
Tron (TRX): Bullish Since $0.24 | Aiming For $0.40TRX has performed very well, and we have had multiple trades opened since $0.24. Seeing still bullish signs so see you all at $0.40.
More in-depth info is in the video—enjoy!
Swallow Academy
TRXUSDT trade ideas

TRX/USDT Breakout Robbery – High Voltage Bullish Target Ahead🔥 TRX/USDT “TRON vs Tether” — Bullish Heist Operation 🔥
💎 Attention Money Makers & Market Robbers 💎
The vault is open and the TRX/USDT crypto bank is loaded! We’re rolling in with the Thief Trader Layering Strategy — stacking multiple buy limit orders like C4 charges on key price floors. This isn’t just trading… this is a high-voltage robbery plan ⚡🏴☠️
📈 Entry Plan (Infiltration):
No fancy timing here — any price level is a potential entry zone. We’ll be scaling in with precision to bait the market makers and ride the bullish tide.
🛑 Stop Loss (Escape Route):
0.3300 — the ultimate safe exit door. Breach that, and we vanish into the shadows before the cops (market reversal) arrive 🚔💨
🎯 Target (The Loot):
0.3610 — High Voltage Electric Resistance ⚡ + Overbought Fence Level 🚧. This is where the market will be too hot for the bears to touch.
💡 Tactical Notes:
We’re hunting in the bullish zone — only go long.
Stack positions smartly to trap weak hands and squeeze shorts.
The closer we get to target, the more the tension rises — exit like a ghost if volatility explodes.
📢 Trader Alert:
The market is charged with momentum ⚡. Keep your alerts active, and be ready to hit the green button before the crowd catches on.
❤️ Support the Crew:
Smash that Boost so the robbery squad gets stronger. Every click fuels more heists, more wins, and more profits 🤑💼💣
TRX/USDT Bullish Robbery Plan — We enter quiet, exit loud, and leave the market in smoke 💨🚀

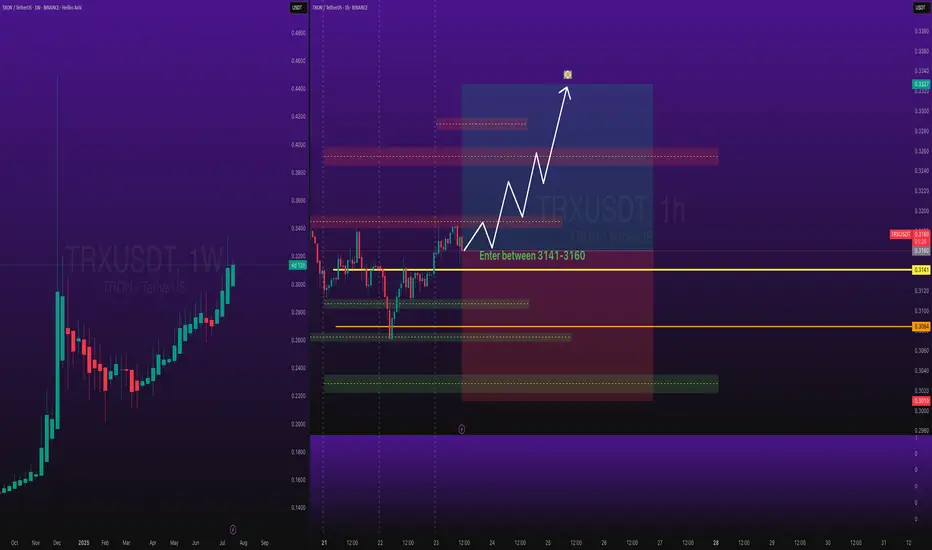
TRON Eyes 17 Percent Surge Toward Explosive 0.37 Breakout TargetHello✌
Let’s analyze TRON’s upcoming price potential 📈.
BINANCE:TRXUSDT is currently approaching a key daily support zone that aligns with a notable Fibonacci retracement level 🧭. This technical confluence suggests a potential short-term rebound, and I’m watching for a possible move of around 17% toward the 0.37 target 🎯.
✨We put love into every post!
Your support inspires us 💛 Drop a comment we’d love to hear from you! Thanks , Mad Whal

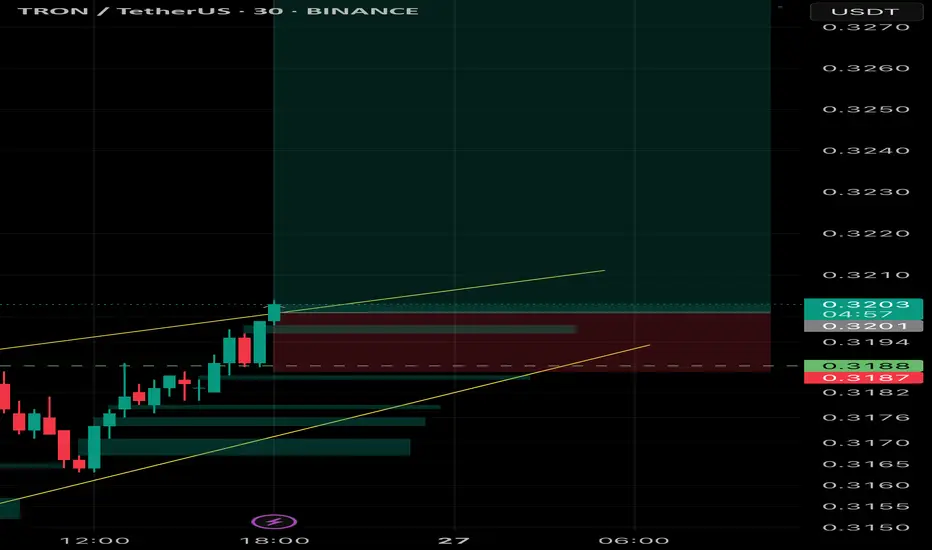
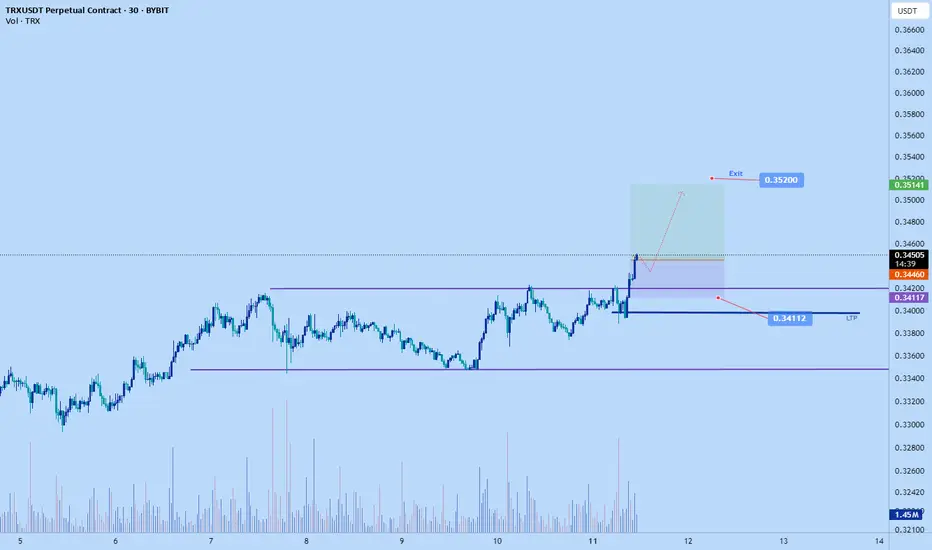
Trx pump to $0.352 todayTrx long
Good chance it might correct lower before tp but am okay with entry here
SL: 0.34112
2RR

TRX | TRON Goes BananasTRON Goes Full Banana Mode : Breaking Records and Throwing Peels at XRP!
TRX is up 500% since our first signal , so it’s officially time to party! order some lambos buy some bananas and let’s celebrate like crypto maniacs🎉🚀🍌
Currently priced at $0.38, it’s up a whopping +70% in just 24 hours. That’s the kind of growth that makes even Bitcoin blush. Speaking of records, TRON hit an all time high of $0.43 today, December 4, 2024, but it’s cooled off a bit, sitting just 10% shy of that milestone.
With a circulating supply of 86.29 billion TRX tokens (maxed out at the same number, like an all-you-can-eat buffet that’s finally closed), TRON isn’t playing around. Its 24 hour trading volume? A casual $5.50 billion, mostly on Binance, which is practically TRX’s second home. TRON now claims 0.90% of the entire crypto market, flexing a $33.60 billion market cap!
After altcoins like DOGE, XRP, HBAR, and XLM strutted their stuff, TRX stormed onto the scene and stole the show. Yesterday, it rocketed from $0.23, smashed through its 2018 ATH like a Kool-Aid man, and set its sights on $0.43.
This price explosion wasn’t just luck or hype. TRON’s ecosystem has been buzzing with activity. It’s dominating Tether transactions, launching flashy projects like Sun.Pump (sounds like a cryptocurrency gym), and riding on the relentless promotional energy of founder Justin Sun. He’s been spending cash like a kid in a candy store, including a hefty investment in Donald Trump’s crypto project and yeah the 6.2 million dollar BANANA was the main factor!
Speaking of Sun, he stirred the pot on Twitter by cryptically declaring, “TRX = XRP.” Bold move, Justin. For context, XRP skyrocketed after Trump’s election win and SEC Chair Gary Gensler’s dramatic exit. At one point, it gained over 420% in a month. XRP also hit a multi-year high this week near $3 and climbed to become the third-largest cryptocurrency by market cap.
TRX’s comparatively “modest” monthly surge of 135% isn’t as flashy, but hey, breaking an all-time high is still a flex. TRON’s market cap is about 5x smaller than XRP’s for now, but in crypto, anything can happen. With this much drama, who needs Netflix?
Always take profits, enjoy your trades, and celebrate your wins
6 is not far from 9 and already good enough hereClose to another decision point level. Watching reaction is a must. This is a chart i forgot about but it seems it works surprisingly well.
This is why everyone should have TRX Initially a completely untradeable token, it has recently been generating huge returns. It also has one of the best market structures right now.
Let's take a look at why TRX is a must-buy for everyone, but not right now:
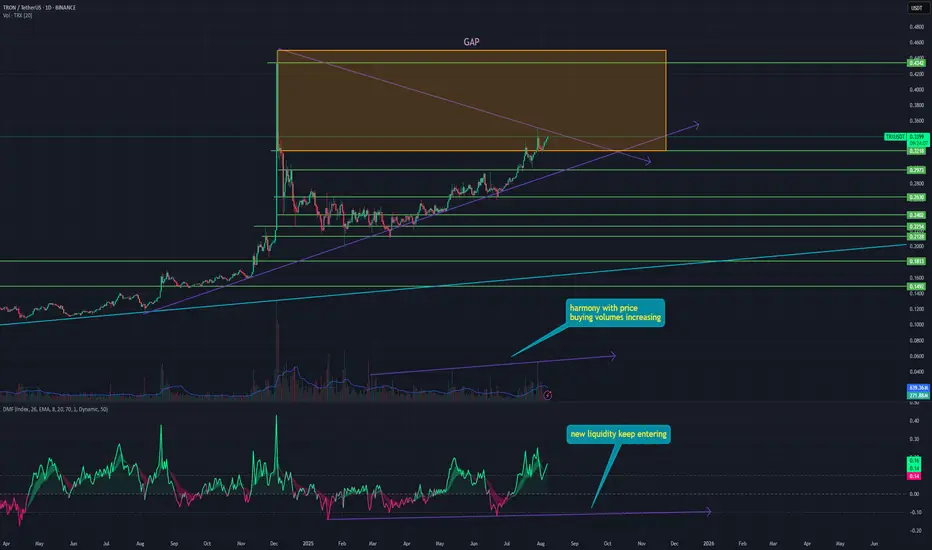
➡️ Firstly, it is one of the only tokens currently close to its ATH.
It is also important that the previous ATH was set in one day and formed a huge GAP at the levels of $0.45 - 0.32. And now the price has already started to close it. Movement along such a GAP is usually extremely fast, as there is no single resistance zone.
➡️ Secondly, it is one of the only tokens on the market with harmonious purchases right now. This means that for the last six months, starting in March 2025, purchase volumes have continued to grow as the price has risen. This indicates high consumer demand even at a rising price, which is a sign of healthy growth.
➡️ Thirdly, money flow is also in harmony with the price. Fresh liquidity continues to flow into the asset regularly, and drawdowns are not very deep, continuing to maintain a bullish structure.
📌 Conclusion:
TRX continues to develop actively, went public with its shares, and received a good boost in percentage terms. In addition, Justin Sun is an enterprising man, the top holder of TRUMP, regularly appearing everywhere, so this guy will not let the hype die down anytime soon.
I would also like to remind you that this is the cheapest network for transactions on ETH. (Don't even write to me about the poor ARB.)
✍️ Share in the comments whether you consider TRX to be a promising token or not?
I would be interested to hear your opinion.
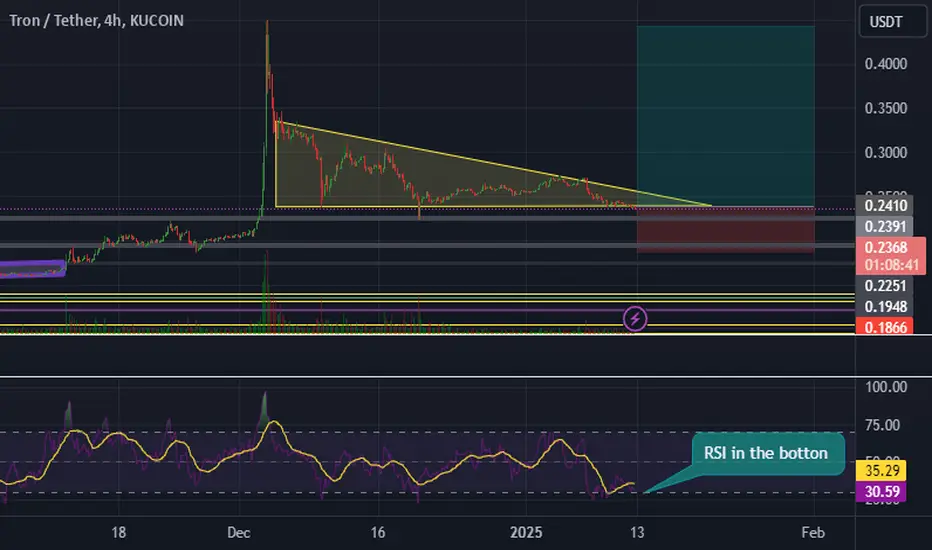
tron (TRX)trx usdt daily analyses
time frame 4 hours
risk riwards ratio > 3.5 (woooow)
****** ( My condolences to those who lost their lives in the California fires.) *******
there is no volume in the market yet.
RSI is in the bottom of chart
price is in the down side of triangle and sellers couldn't break the support line ( 0.225$)
I set LS on the down of another support line on 0.195$
if we hear a good news about cryptocurrency market or tron , maybe a pump happens and good benefit for traders.
be careful for stop hunters. in this situations
TRXUSDT Short Trade - Price CorrectionsBINANCE:TRXUSDT Short Day Trade - Low Risk, with my back testing of this strategy, it hits multiple possible take profits, manage your position accordingly.
Note: Manage your risk yourself, its risky trade, see how much your can risk yourself on this trade.
Use proper risk management
Looks like good trade.
Lets monitor.
Use proper risk management.
Disclaimer: only idea, not advice
Important Area: 0.30771-0.33084
Hello, fellow traders!
Follow us to get the latest information quickly.
Have a great day!
-------------------------------------
(TRXUSDT 1D Chart)
TRX is one of those coins (tokens) that has a lot of users, yet feels neglected.
For TRX to maintain its uptrend, the price must remain above the 0.30771-0.33084 range.
The circled areas represent important support and resistance zones.
When the M-Signal indicator on the 1W chart rises near the 0.30771-0.33084 range, a price decline below that level is highly likely to trigger a downtrend.
-
Thank you for reading to the end.
I wish you successful trading.
--------------------------------------------------
- This is an explanation of the big picture.
(3-year bull market, 1-year bear market pattern)
I will explain in more detail when the bear market begins.
------------------------------------------------------
Tron Wave Analysis – 15 August 2025- Tron reversed from a daily up channel
- Likely to fall to support level 0.3400
Tron cryptocurrency recently reversed from the resistance trendline of the narrow daily up channel from the end of June – standing well above the upper daily Bollinger Band.
The downward reversal from the resistance trendline created the daily Japanese candlesticks reversal pattern long-legged Doji.
Given the strongly bearish sentiment seen across the crypto markets today and the overbought daily Stochastic, Tron cryptocurrency can be expected to fall to the next support level 0.3400.
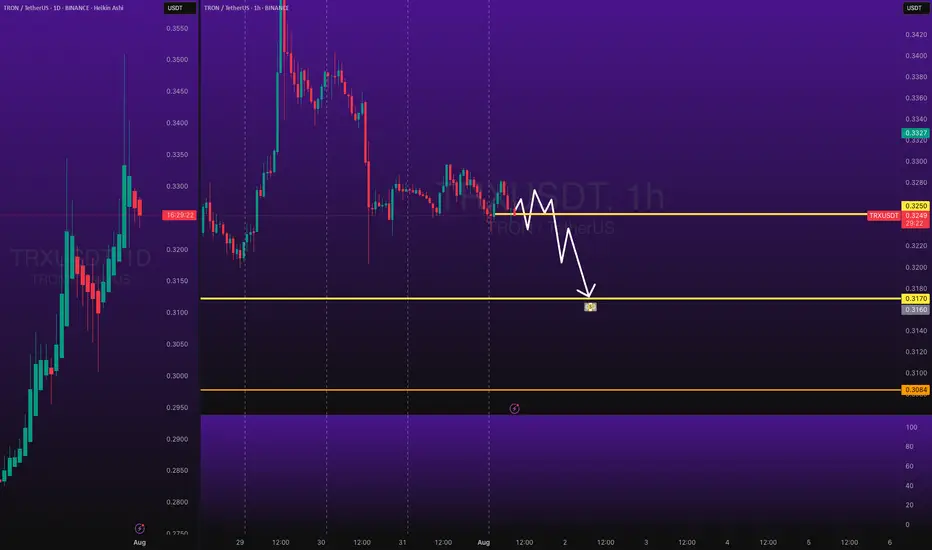
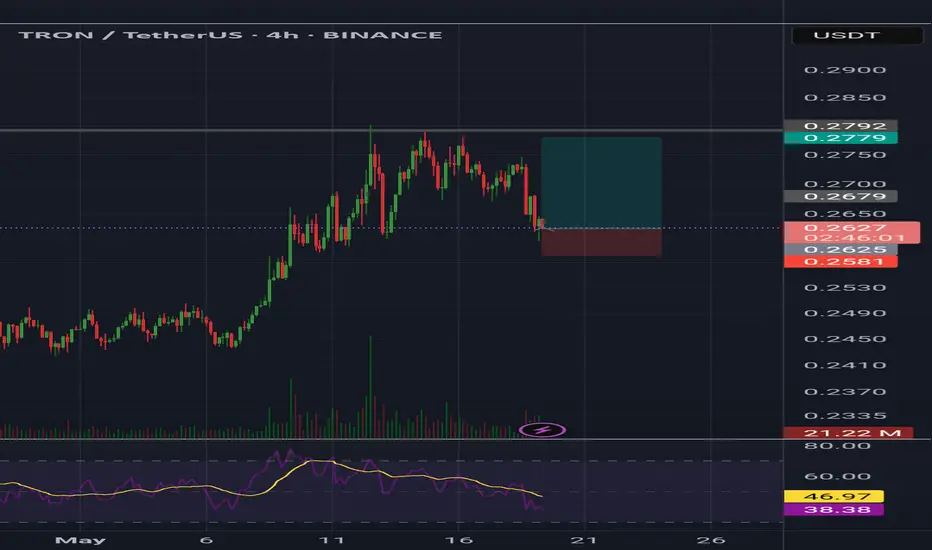
TronTrx usdt Daily analysis
Time frame hourly
Short time Target 0.278 $
Risk rewards ratio >3.5 👈👌
This short time analysis is in the big Daily analysis that you can see in my forecasts before
TRXUSDT Long SwingBINANCE:TRXUSDT Long Swing Trade, with my back testing of this strategy, it hits multiple possible take profits, manage your position accordingly.
This is good trade, don't overload your risk like greedy, be disciplined trader.
I manage trade on daily basis.
Use proper risk management
Looks like good trade.
Lets monitor.
Use proper risk management.
Disclaimer: only idea, not advice
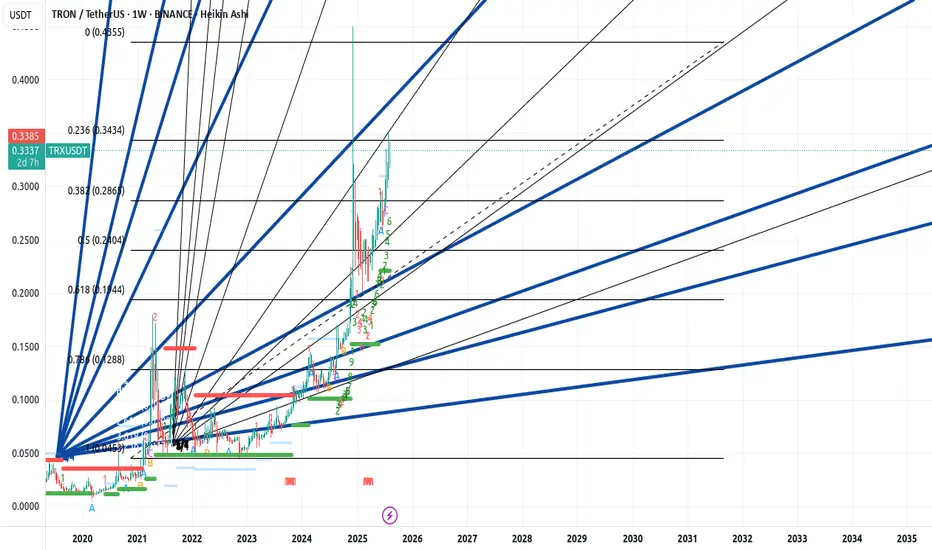
$TRX — "The Samurai Path" of Crypto? Long-term TRON outlook In a market where coins spike and crash from every tweet, CRYPTOCAP:TRX behaves like a stoic monk.
The price of OKX:TRXUSDT moves steadily, avoiding wild dumps and pumps — as if it exists in a parallel reality.
Now consider two events that would usually explode any altcoin’s chart — but not CRYPTOCAP:TRX :
📅 July 24 — Justin Sun’s TRON Inc gets listed on NASDAQ.
📅 July 28 — TRON Inc announces plans to raise $1B to buy back CRYPTOCAP:TRX and hold it on their balance sheet.
🔍 And yet… the chart remains calm. No hysteria. No euphoria.
Why?
Either CRYPTOCAP:TRX is so predictable that all news is already priced in —
or we simply don’t fully understand the inner mechanics of this ecosystem.
🧭 We call this "The Samurai Path":
Silent. Stable. Emotionless. But with serious long-term potential.
On the chart, we outlined how OKX:TRXUSDT has been moving — and what we expect next.
Because a market cap of $31B is already massive.
But $161B? That’s a statement...
📊 Can #TRON become the next “stable giant” of crypto — or will it surge when no one expects?
TRX SHORT TRADE SET UPNew Trade Setup: TRX-USDT
SHORT
Entry: 0.3312 OR CMP
Target: TP1: 0.3276, TP2: 0.3247, TP3: 0.3218, TP4: 0.3189
Stoploss: 0.3361
Leverage: 3X
Technical Analysis: TRX/USDT is currently facing strong resistance. There is a high probability of a short-term downward move.

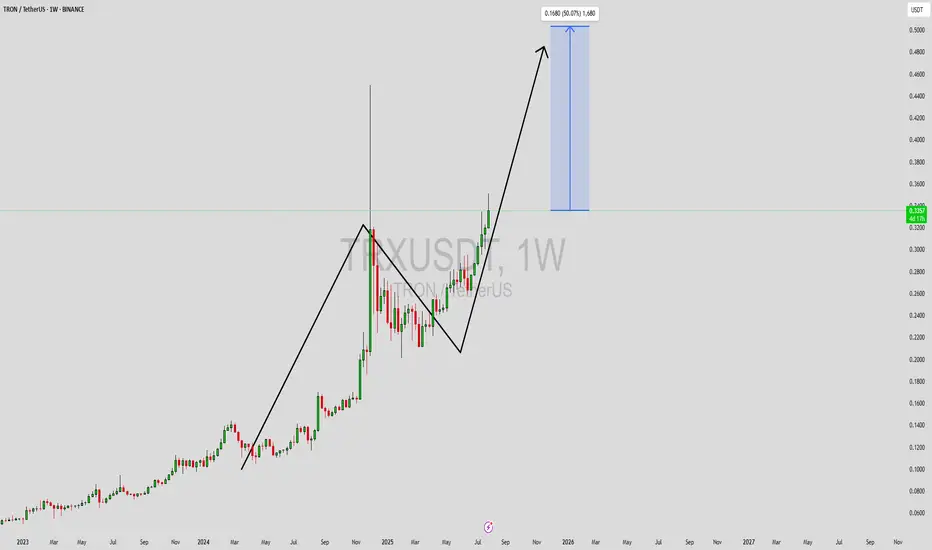
TRXUSDT Forming bullish continuationTRXUSDT (TRON/USDT) is currently showing a strong bullish continuation pattern on the weekly chart, suggesting that the momentum is far from over. After a solid upward rally followed by a corrective wave, the price has resumed its uptrend with clear higher highs and higher lows forming on the chart. The recent breakout to the upside signals renewed bullish strength, supported by increasing volume and investor confidence.
The chart setup indicates a potential 40% to 50% price increase in the coming weeks, based on the current market structure and projection from the previous swing high. TRX is now targeting a significant resistance zone, and a successful breakout above this level could trigger a fresh leg up. With broader market conditions stabilizing and TRON's fundamentals remaining strong, the likelihood of sustained gains remains high.
TRON has consistently maintained its presence as one of the top utility-focused blockchain projects, offering fast, low-cost transactions and ongoing ecosystem development. This fundamental strength, combined with the technical setup, is drawing attention from both retail and institutional investors. The rising volume supports the idea that smart money is accumulating ahead of a bigger move.
With momentum building and chart signals aligning in favor of bulls, TRXUSDT is positioned for a potential breakout run. Traders and investors may consider keeping this pair on their radar, especially if it retests support levels successfully before pushing higher.
✅ Show your support by hitting the like button and
✅ Leaving a comment below! (What is You opinion about this Coin)
Your feedback and engagement keep me inspired to share more insightful market analysis with you!
Check if the second step-up trend can be maintained
Hello, traders.
If you "Follow" us, you'll always get the latest information quickly.
Have a great day.
-------------------------------------
(TRXUSDT 1M Chart)
We need to see if the price can sustain itself by rising above the left Fibonacci level 3.618 (0.3607) and the right Fibonacci level 1 (0.3742).
When the next monthly candlestick is formed, we need to check the movements of the supporting indicators.
-
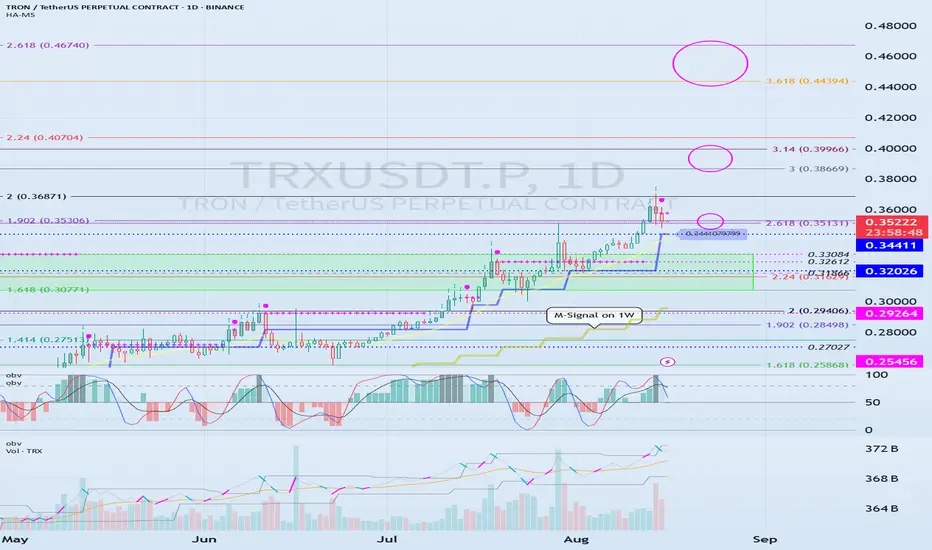
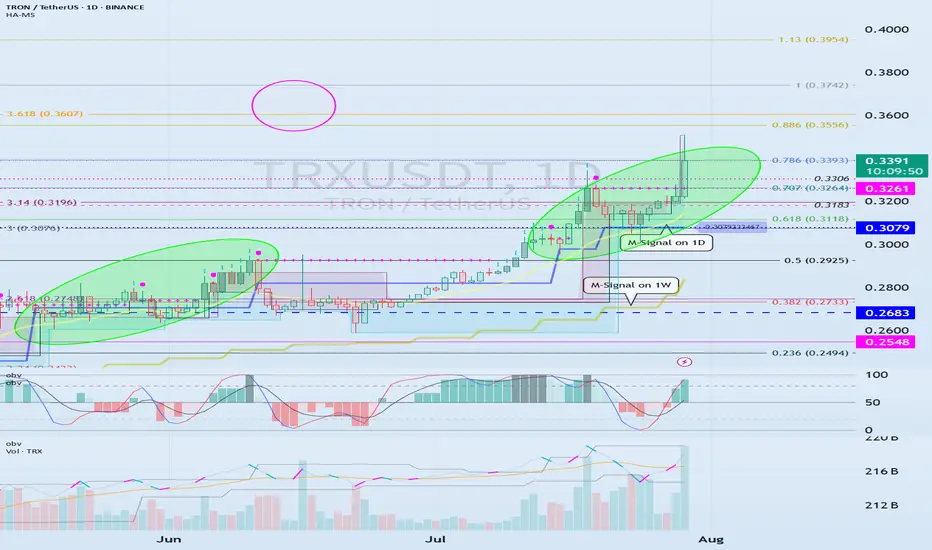
(1W Chart)
The DOM (60) indicator on the 1W chart is showing signs of forming a new trend.
Accordingly, we need to examine whether a rise above the left Fibonacci level of 3.618 (0.3607) will trigger a new wave.
The left Fibonacci level was created during the first rising wave.
Therefore, if the price rises above the left Fibonacci level of 3.618 (0.3607), a new wave is expected to form.
Since the HA-High indicator on the 1W chart is formed at 0.2683, if the price declines, support near 0.2683 will be crucial.
-
(1D chart)
If the price maintains above the 0.3079-0.3261 range, further upside is expected.
For the price to rise above the left Fibonacci ratio of 3.618 (0.3607) and the right Fibonacci ratio of 1 (0.3742), the OBV indicator of the Low Line ~ High Line channel must rise above the High Line and remain above it.
However, since the StochRSI indicator has entered an overbought zone, the upward movement may be limited.
Therefore, we need to consider how to reset the indicator.
-
The price is continuing a stepwise upward trend, rising above the HA-HIgh indicator.
It is currently in its second stepwise upward movement.
Therefore, the key is whether the price can sustain above the HA-High indicator.
Whether a third stepwise upward movement occurs will depend on whether the price can sustain itself around or above the 0.3079-0.3261 level.
-
Thank you for reading to the end.
I wish you successful trading.
--------------------------------------------------
- Here's an explanation of the big picture.
(3-year bull market, 1-year bear market pattern)
I'll explain more in detail when the bear market begins.
------------------------------------------------------
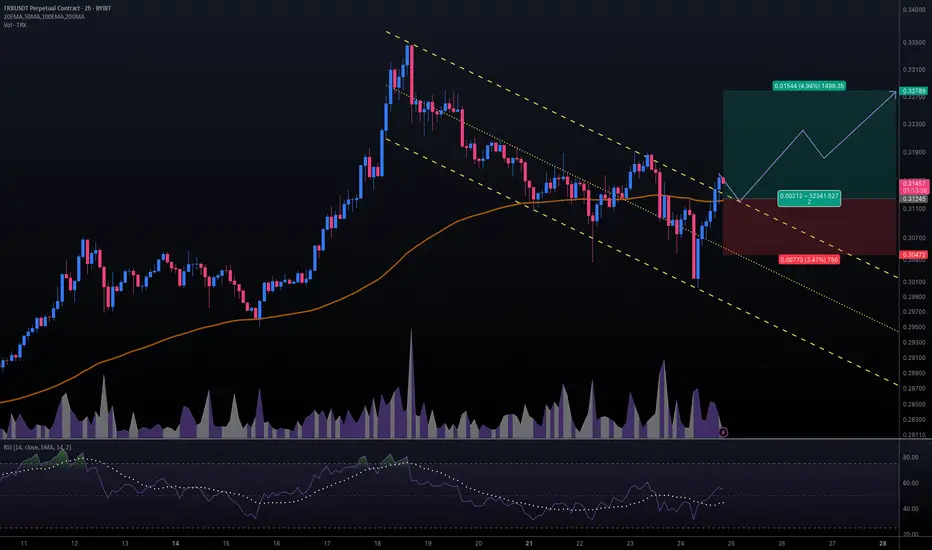
#TRXUSDT #2h (ByBit) Descending channel breakout and retestTron just regained 100EMA support and seems ready for bullish continuation after a pullback to it.
⚡️⚡️ #TRX/USDT ⚡️⚡️
Exchanges: ByBit USDT
Signal Type: Regular (Long)
Leverage: Isolated (16.0X)
Amount: 5.1%
Entry Targets:
1) 0.31245
Take-Profit Targets:
1) 0.32789
Stop Targets:
1) 0.30472
Published By: @Zblaba
CRYPTOCAP:TRX BYBIT:TRXUSDT.P #2h #TRON #DPoS #L1 #Web3 trondao.org tron.network
Risk/Reward= 1:2.0
Expected Profit= +79.1%
Possible Loss= -39.6%
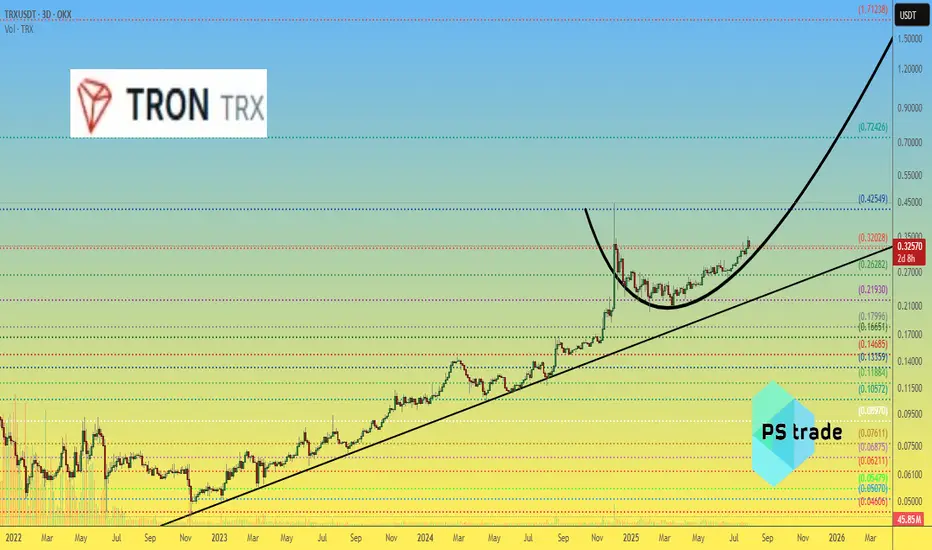
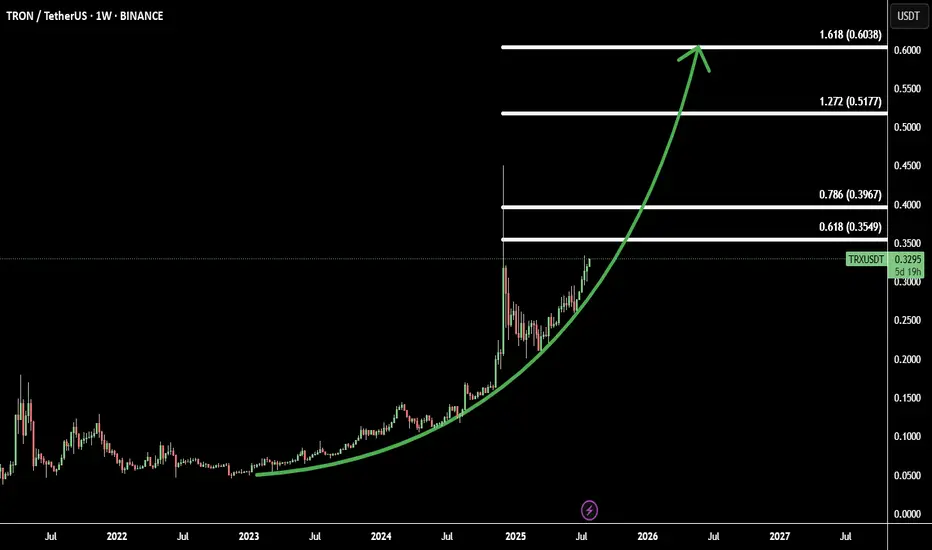
TRX/USDT Starting Parabolic Move: 4 Fibonacci Targets in SightTRX (Tron) is showing early signs of a parabolic breakout, supported by strong momentum and a solid technical structure.
After a long accumulation phase, TRX has gained bullish traction and is now accelerating. The price action suggests the beginning of a steep upward curve, often associated with parabolic rallies.
Using Fibonacci extensions, we identify 4 bullish targets:
Target 1: 0.618 Fib - 0.35 – initial breakout confirmation zone
Target 2: 0.786 Fib – 0.39 - key mid-level resistance
Target 3: 1.272 Fib – 0.51 - extended bullish target
Target 4: 1.618 Fib – 0.60 - full parabolic potential
This setup provides a great opportunity for trend traders aiming to ride the wave early.
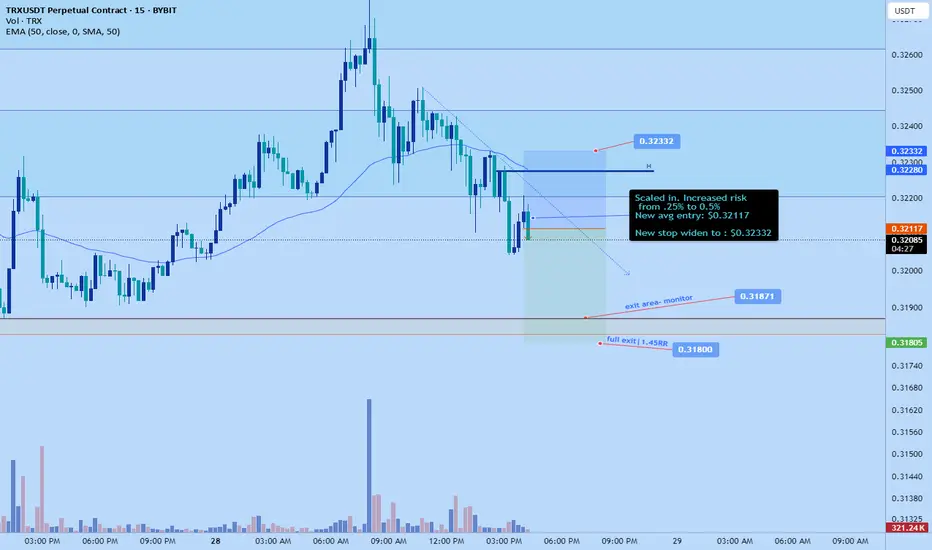
Trx scalp shortsl: $0.32332
Tp: $0.3180
Daily correction seems to be happening on trx. Lower tf flipping bearish to facilitate the move.
Time sensitive
Roughly 1:1 rr from current entry
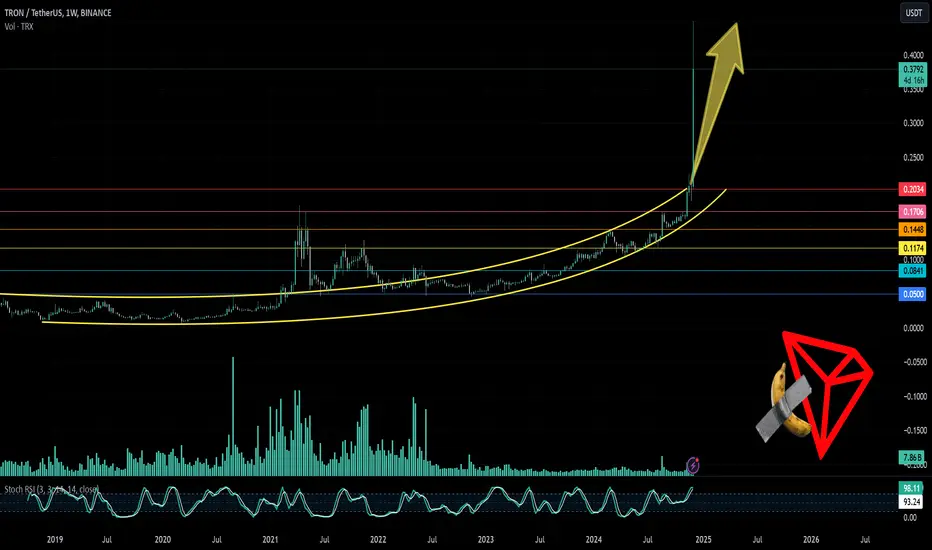
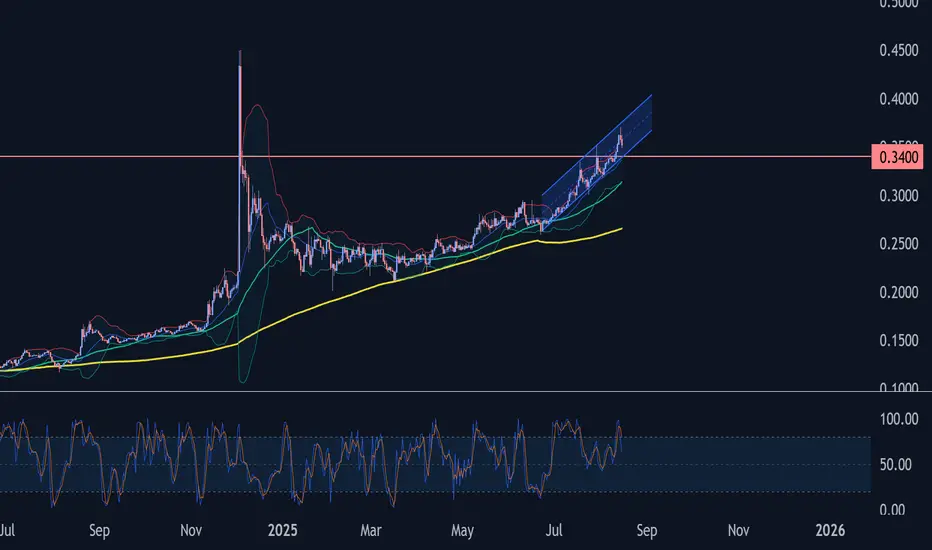
Tron (TRX): $0.40 Incoming | Strong Bullish DominanceTron coin is showing strong buyside dominance, where after the first wave of pump price has been stabilizing yet keeping itself above the lines of EMAs.
As we are seeing strong buyside dominance, we are getting ready for another pump, similar to the last one, so watch closely and be sure not to miss what might come next!
Swallow Academy
TRX 3000 RRRTrx is going to the moon, maybe. 5$ macro target imo on a super tight stop. A trader can dream let’s see mega moonshot