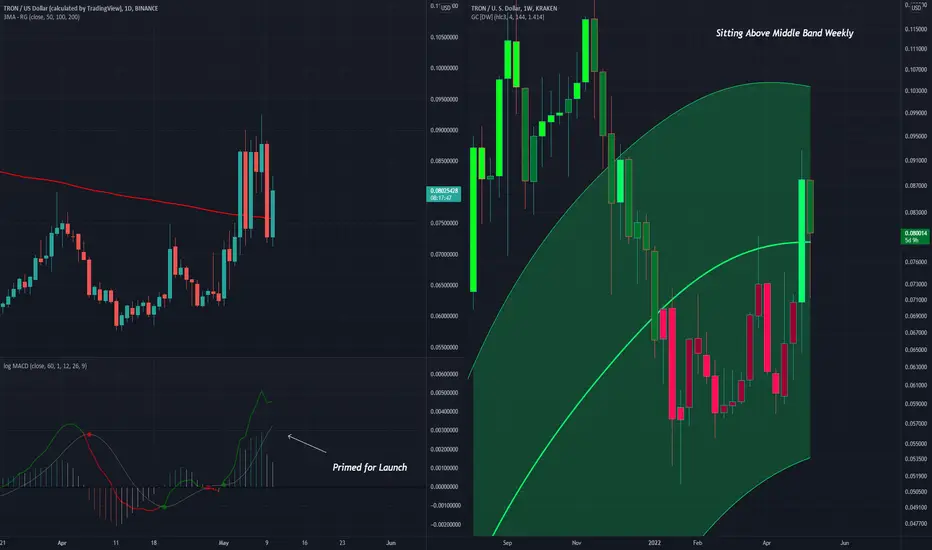
TRXUSD - Approaching A BreakoutTRXUSD on the left can be seen to be sitting on top of the 200MA in a very bullish formation (daily timeframe)
Supporting this bullish theory is the MACD which is in its preferred state before bullish takeoff
TRXUSD on the right can be seen to be sitting above the middle Gaussian Channel band on a Weekly timeframe
A great entry just above the line
TRXUSDT_26B410.USD trade ideas
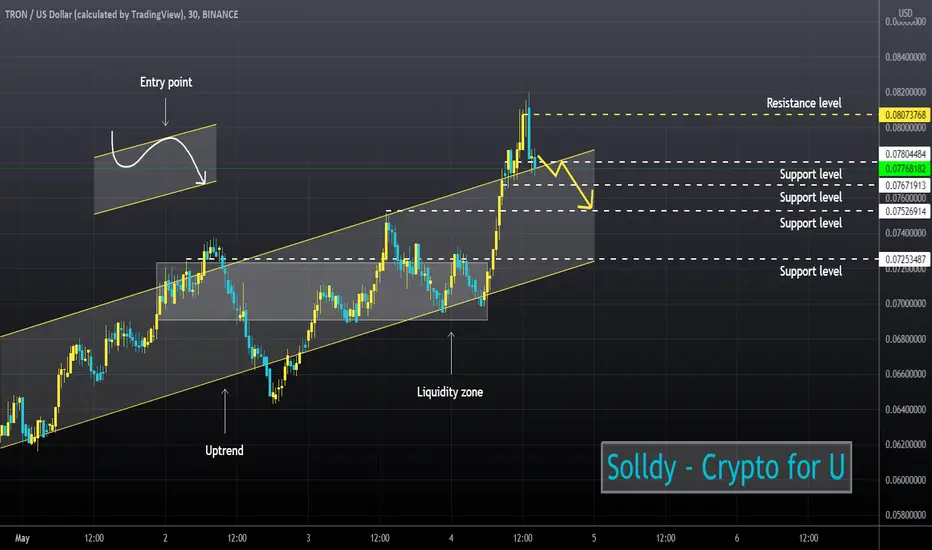
TS ❕ TRXUSD: expect a downtrendTRX has broken through the ascending channel and now we can expect a downtrend. Now the price is heading to the retest of the channel penetration level, after which a drop can be expected.
SELL scenario: short to 0.073.
----------------------------------------------------------------------------
Remember, there is no place for luck in trading - only strategy!
Thanks for the likes and comments.

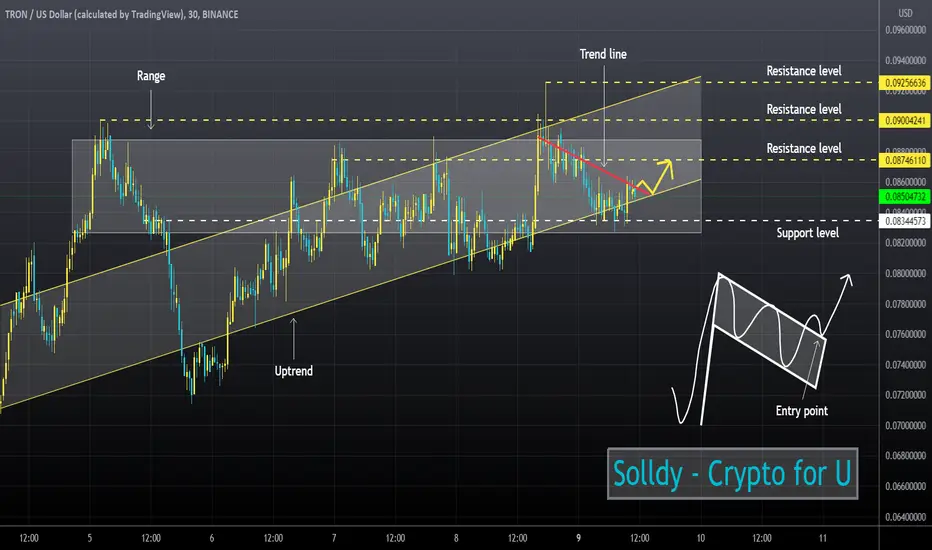
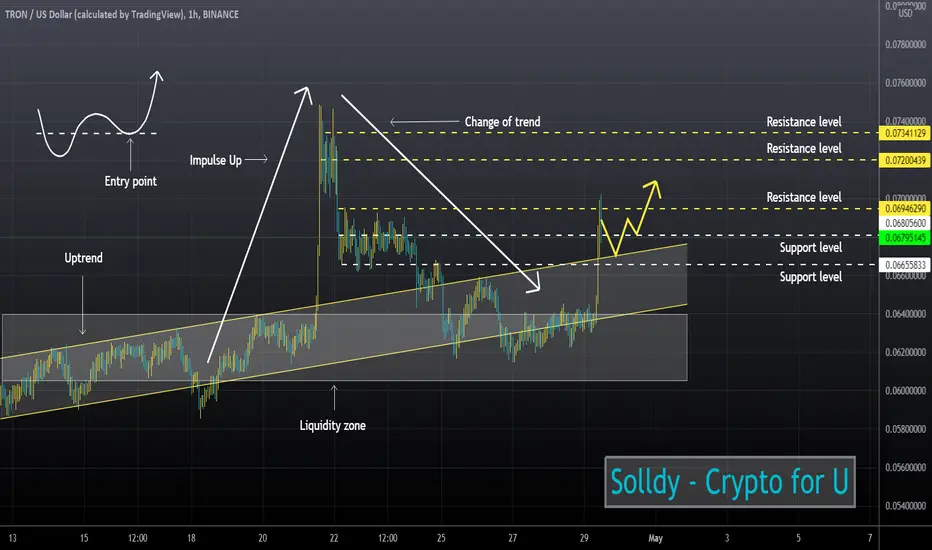
TRXUSD ❕ bullish flagTron is moving in an uptrend channel.
Trading volumes on the downtrend are declining.
The 50MA has crossed upward of the 100MA on the 30m Timeframe.
The price is now forming a bullish flag trend continuation pattern.
I expect that after fixing above the trend line the price will reach the resistance level.
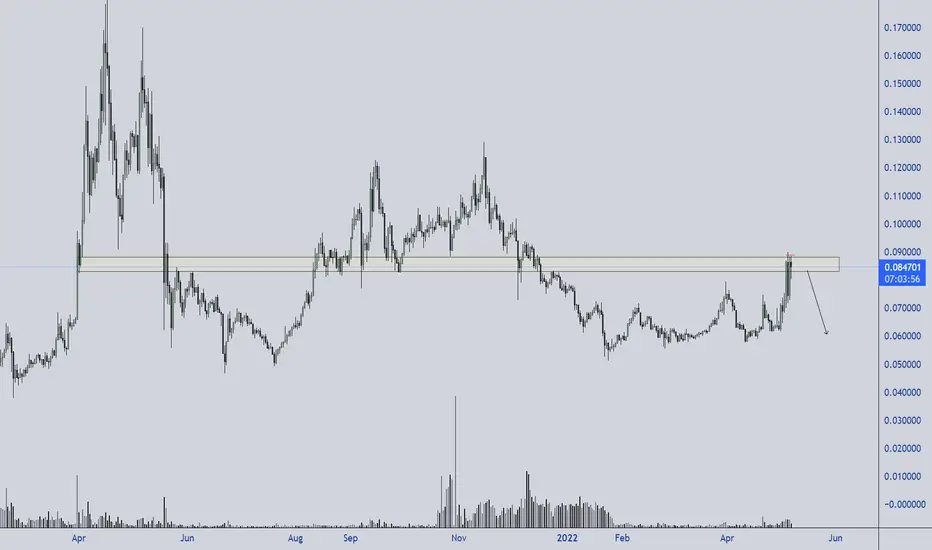
Tron SHORT IdeaPretty simple to read the chart. Broke Support & currently testing Resistance.
Good Short opportunity in my opinion
Target is 0.07 cents

TRX Sell Idea Pretty simple to read the chart. Broke Support & currently testing Resistance.
Good Short opportunity in my opinion
Target is 0.07 cents
SHORTING $TRXVery clear rejection of this key level supported by a bearish RSI divergence in the 4H time frame as you can see here:
trxusdtrxusdt i think it can break this line but if cant it will go down to .50 zone then start uptrend

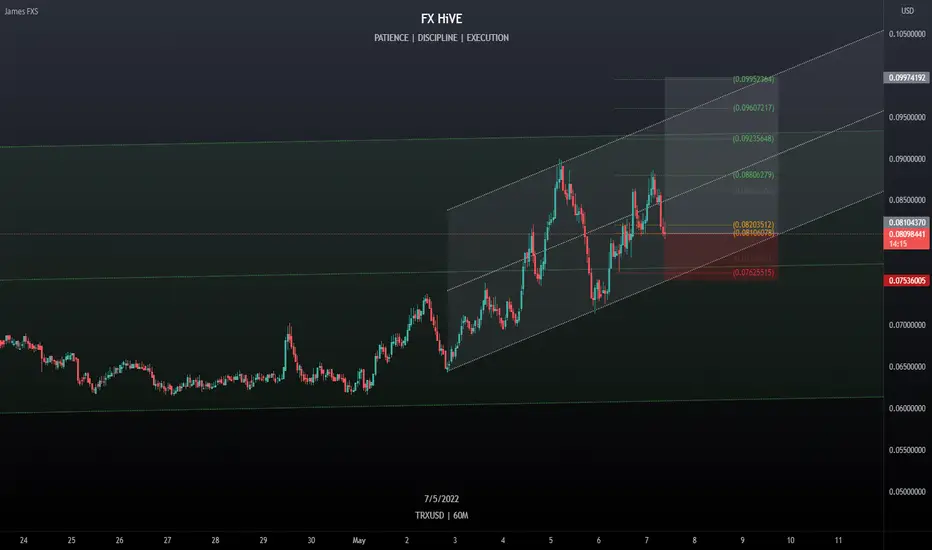
TRXPERP SHORTDouble Top Pattern (buy before breakout) Manage ur Risk DYOR
entry 0.08080
SL 0.08625
TP 0.07642
0.07364
0.07140
0.06915
0.06596

I think TRX is going to drop Trx saw a good move to the upside and is now exhausted and I think it’s going to drown
This is not a financial advice
DYOR

TRX short, 1.86RHey,
just a TRX short I quickly drew on the chart. 1.86 and based of a bearish 1D vector candle reversal (cryptomarket-maker.com)
Let me know what you think :)

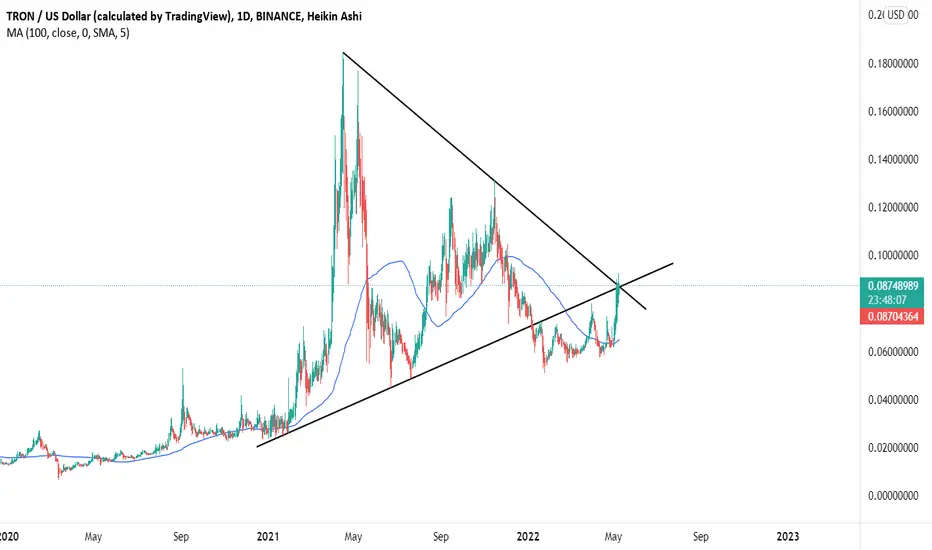
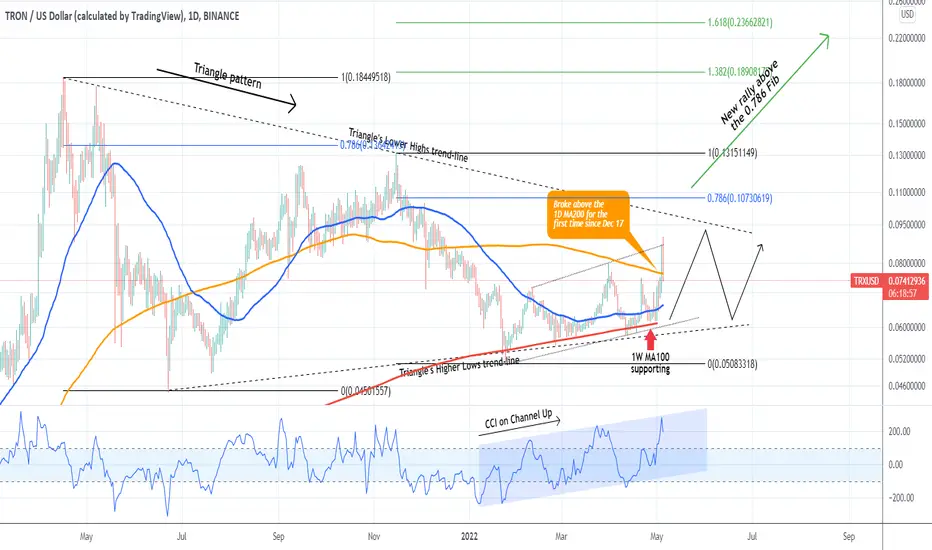
TRXUSD Strong short-term but long-term needs moreTron (TRXUSD) has showed incredible strength short-term since May 01 up until today. Even though it broke above the 1D MA200 (orange trend-line) yesterday for the first time since December 17 2021, the coin remains within a long-term Triangle pattern since the April 21 2021 High.
As a result it is still best to trade the Triangle (buy low - sell high) for as long as the 1W MA100 (red trend-line) supports and the Lower Highs (top) trend-line of the Triangle resists. In order for the market sentiment to turn bullish again on the long-term, we believe that a break above the 0.786 Fibonacci retracement level is needed (which contained the previous Lower High). In that case we expected a new rally towards the 1.382 Fib (matched the April 2021 High) and the 1.618 Fib in extension around 0.2200 - 0.2300.
Note that the 1D CCI has been within a Channel Up since the last Triangle Higher Low. Adds to the bullish break-out case.
--------------------------------------------------------------------------------------------------------
Please like, subscribe and share your ideas and charts with the community!
--------------------------------------------------------------------------------------------------------
trxusdtThe higher-time analysis shows that we are in a triangle, which is a flat in its higher degree
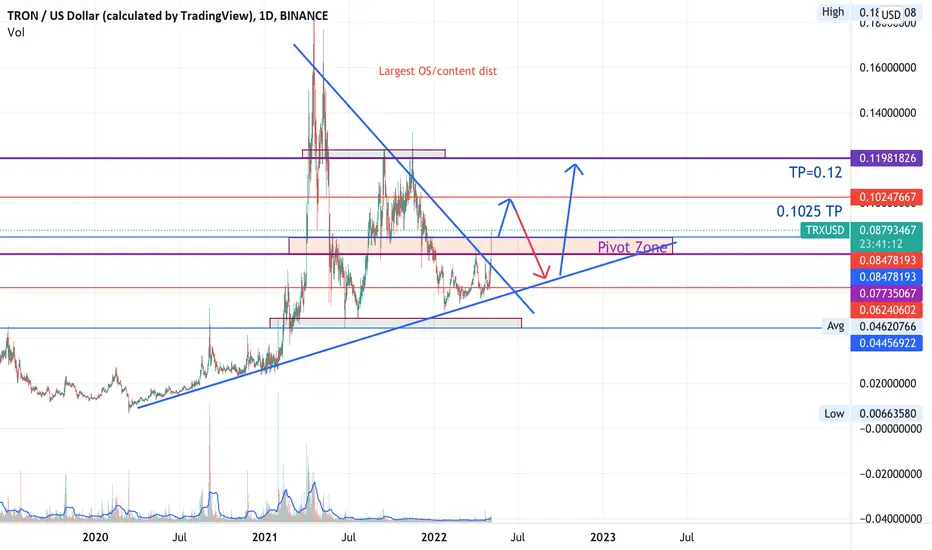
TRX 19% rally & BO of triangle & pivot zone; what next?TRX just made a big 19.2% rally breaking out of a triangle as well as an impt pivot zone. This pivot zone then turns into support.
Watch for the 2 TPs @ 0.1025 & 0.12. Fast retracement usually follows strong rallies. TRX should retrace back to the pivot zone or to the uptrend line for another buy point.
Not trading advice
TRXUSD ❕ false breakout?The Tron moved strongly upwards out of the uptrend channel, and then hit the resistance level. On increased trading volumes, the price went down after the doji candlestick was formed. I expect a quick correction after fixing under of upper boundary.
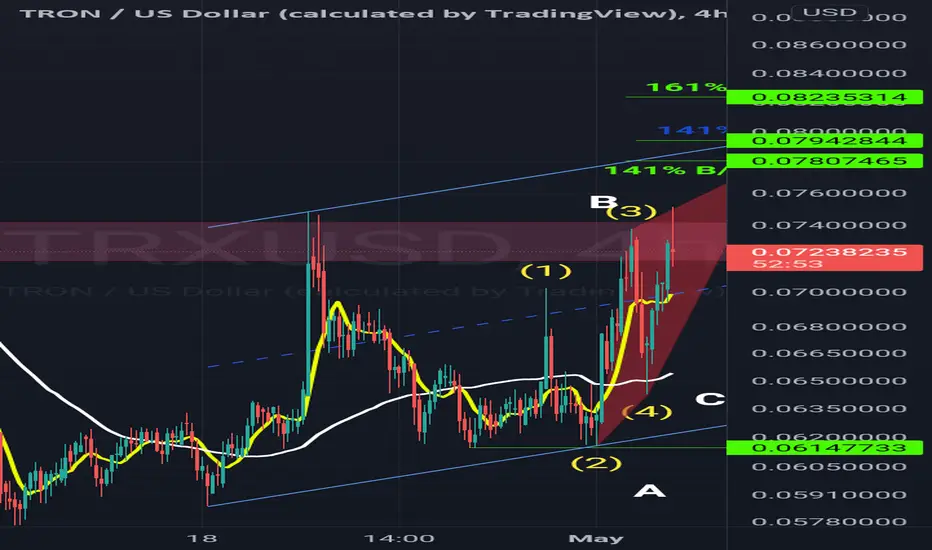
TRXUSDon the 4 hour chart
A bullish wave was identified within the price channel, also bullish, with the Wave and Harmonic waves, and it is trading above the average line, support 55 and 7 days. The targets were identified. Wave 5 is known to be long and boring. There is an area that was challenged. The third means that it has become weak, and we may see some fluctuation after it penetrates it
God knows
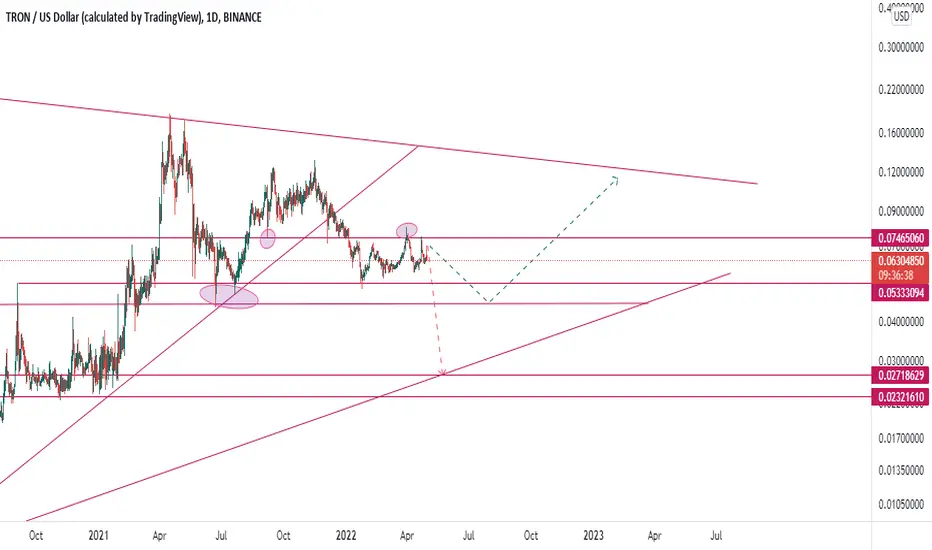
TRONThere is absolutely every chance of recovering at least 50% of the global fall in TRON.
TRON has approached a key point, the intersection of two trend lines at the level of 0.06500. After a significant drop since the end of 2021, there is every chance of a breakdown of the trend line of the descending channel with the subsequent formation of an upward trend. The first target of the ascending channel is the resistance level of 0.8000, breaking through which opens the possibility of testing the level of 0.10000, which will be 50% of the last long-term decline. If the level of intersection of two trend lines at 0.6500 holds and TRON remains within the long-term downward channel, the next local support may be 0.05000 with the prospect of testing the level of 0.03500. The level of 0.05000 is a strong historical support, below which large volumes of pending purchases are concentrated; this fact can provide significant support to this level.

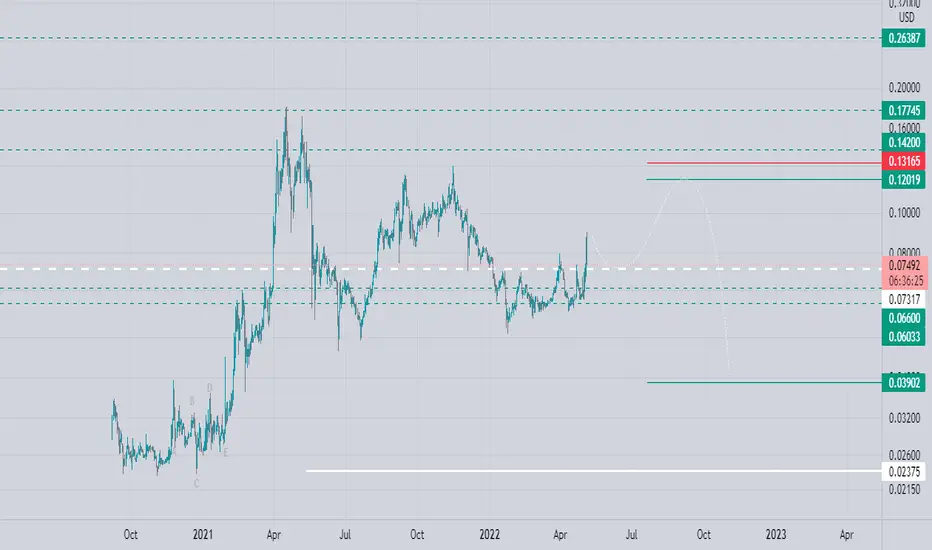
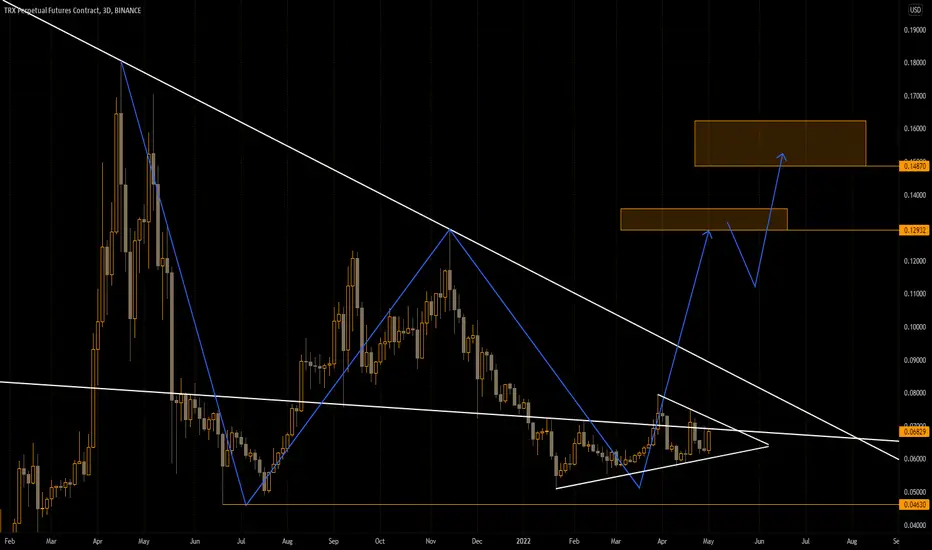
TRX MACRO LEVEL FOR SOME UPSIDE$TRX as long as it holds $0.0463 bottom we can look for $0.129 - $0.148 for the MACRO level. Strong resistances to break but possible.
#TRX #TRON

TRXUSD Trend line analysisAs I mentioned in the chart daily up-trend line broke and now it is going to complete its correction!
By the way, there are some important support levels that would be its final correction move!
Which one do you go with?
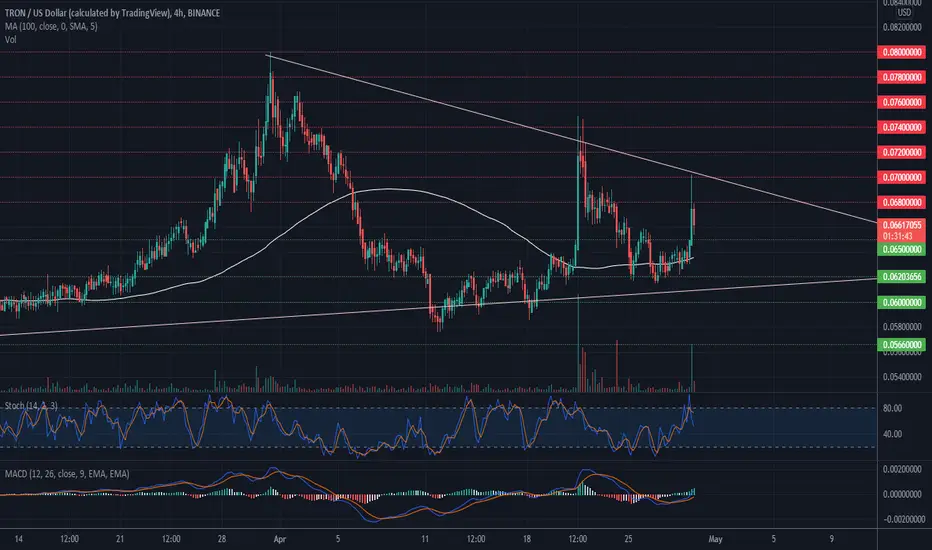
Tron Price Analysis — April 29Despite the broader weakness in the crypto market on Friday, TRX has traded against the grain as it tapped a new weekly high above the $0.0700 top. However, it appears that bulls lack the composure to sustain this rally as the cryptocurrency falls back to the $0.0650 support.
With the recent surge and rejection, TRX has lighted up a descending trendline, which is acting on the price to retest the $0.0600 low. Regardless, I anticipate a bullish rebound to the $0.0700 top over the coming days and a possible break towards the $0.07500 top. In the meantime, a bearish continuation below $0.0620 is highly unlikely.
Meanwhile, my resistance levels are $0.0680, $0.0700, and $0.0720, and my support levels are $0.0650, $0.0620, and $0.0600.
Total Market Capitalization: $1.78 trillion
Tron Market Capitalization: $6.7 billion
Tron Dominance: 0.37%
Market Rank: #22
TRXUSD ❕ volume growth50MA and 100MA formed a golden cross at 1H Timeframe.
Price is above the liquidity level.
I expect retest and fixation above the support level with further reaching the resistance level.
TRX 4hTRON dropped to 50 EMA and below 200 MA. The price has broken the downtrend line and may drop to 100 MA. Bullish scenario - return to the uptrend line and continue to rise if the price can close above the line
