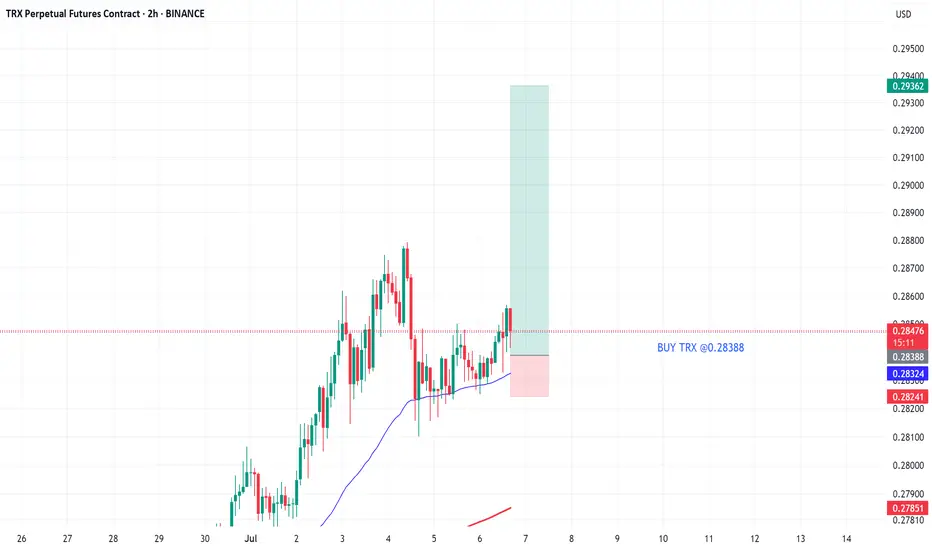
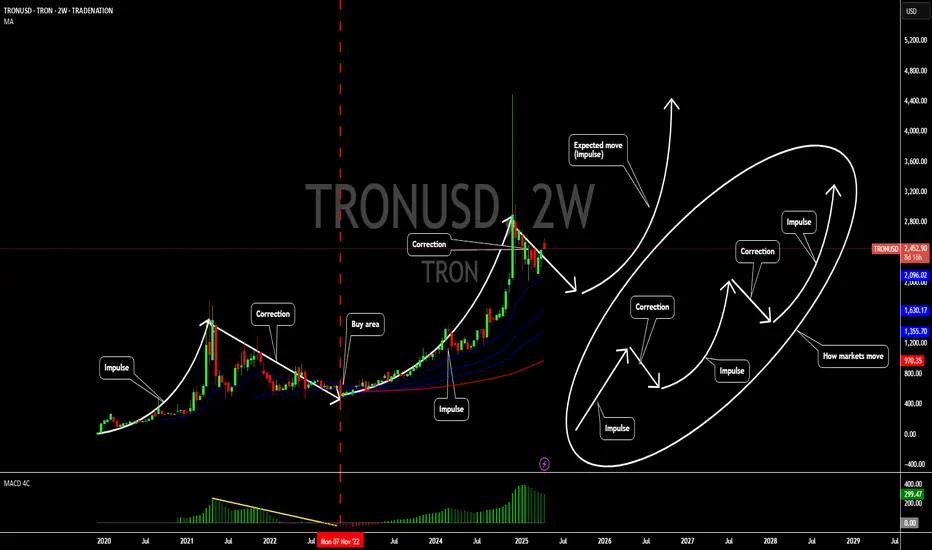
TRON/TRX: The Hottest Chart in All of CryptoThe ascending triangle pattern is obvious as day. Price action has broken out and the triangle's already been tested from the top. Soon TRON will go on price discovery. The target of such ascending triangle is the height of the base of the triangle. I'm a bit conservative so my TP is $8 bucks.
Don't be angry at me please. I don't make the rules. And this isn't financial advice.
Peace out y'all!
TRXWETH_5C48CB.USD trade ideas

TRX Grinding Higher – Are These the Next Targets?📈🔥 TRX Grinding Higher – Are These the Next Targets? 🧱🚀
Continuing the Altcoin Series, let’s take a look at TRX (Tron) — quietly grinding higher while the crowd stays distracted elsewhere.
As I’ve said before: I’m preparing to divorce altcoins at the top of this cycle. But until then, I’m a trader — and TRX is a chart that deserves our attention right now.
🔍 Two Perspectives, One Message
The 1H intraday chart shows clear structure within an ascending channel, holding its higher lows beautifully.
Meanwhile, the 2D macro chart reveals a long-term channel breakout, now pressing up into key resistance.
📊 Levels That Matter
Short-Term Support (1H):
🔹 $0.29926
🔹 Mid-channel trendline
Macro Zones (2D):
🔸 Current Price: $0.30991
🔸 Next key levels:
$0.38540
$0.46122
Structure to Watch:
Price remains well-supported by the orange trendline — a multi-year diagonal that’s been acting as dynamic support. As long as that holds, TRX remains on the offense.
⚠️ Narrative-Free Trading
Let’s be real — Tron isn’t the sexiest narrative play.
But the chart doesn't lie: structure is intact, trend is up, and targets are in sight.
This is the kind of setup where emotion gets left at the door — we trade the level, not the label.
Buy over support
Exit near resistance
Control risk — always
TRX may not trend forever — but for now, it’s trending just fine.
One Love,
The FXPROFESSOR 💙
Disclosure: I am happy to be part of the Trade Nation's Influencer program and receive a monthly fee for using their TradingView charts in my analysis. Awesome broker, where the trader really comes first! 🌟🤝📈

TRXUSD – Still Holding the ClimbTRX climbed steadily into $0.289 before rolling into a correction phase. It has now printed a clean bounce off $0.285 and is testing the $0.2875 area. A reclaim of $0.2885 could reestablish bullish momentum. Structure still favors higher lows as long as $0.2845 holds.
TRON Technical & On-chain Analysis: Is a Breakout Imminent?The TRX/USDT weekly chart is showing TRON testing a major resistance zone near $0.32, while forming a classic ascending triangle pattern just below this level. This bullish structure typically signals increasing momentum from buyers and raises the potential for a breakout above resistance.
What makes the bullish case even more compelling is the strong on-chain activity. According to Cryptoonchain (using CryptoQuant data), daily transactions on the TRON network have surged above 9 million, with the 100-day moving average also hovering close to its all-time highs. This significant growth reflects not only rising user engagement but also a sustained demand for network utility. Historically, sharp increases in on-chain activity have often fueled major price moves, especially when combined with clear bullish technical charts.
If TRX can achieve a decisive breakout above the $0.32 resistance with meaningful trading volume, a new bullish phase could be triggered in the medium term. However, traders should be cautious about the potential for fake-outs or temporary pullbacks after the first breakout.
Summary:
A combination of the ascending triangle formation and record-high on-chain activity (as reported by Cryptoonchain with CryptoQuant data) noticeably increases the odds of a successful breakout for TRON. Still, true confirmation relies on a clear, sustained close above the $0.32 level.

TRON the next rally for an AltcoinTRON seems to be the next ALt Coin Crypto that is ready to rally with the Crypto Summer kicking in with Bitcoin and Ethereum.
So this one looks exciting for upside.
Here are SOME fundamentals for upside first.
🏛 1. Institutional Money Flows
Big players are backing TRON with institutional-scale adoption, fueling network demand and price strength
🔗 2. SkyLink Launch
The new SkyLink protocol lets users earn yield on tokenized Treasuries, boosting excitement around TRX utility
💱 3. USDT Powerhouse
TRON has minted over $22 billion USDT in H1 2025—cementing its role as a stablecoin hub
Here are the technicals.
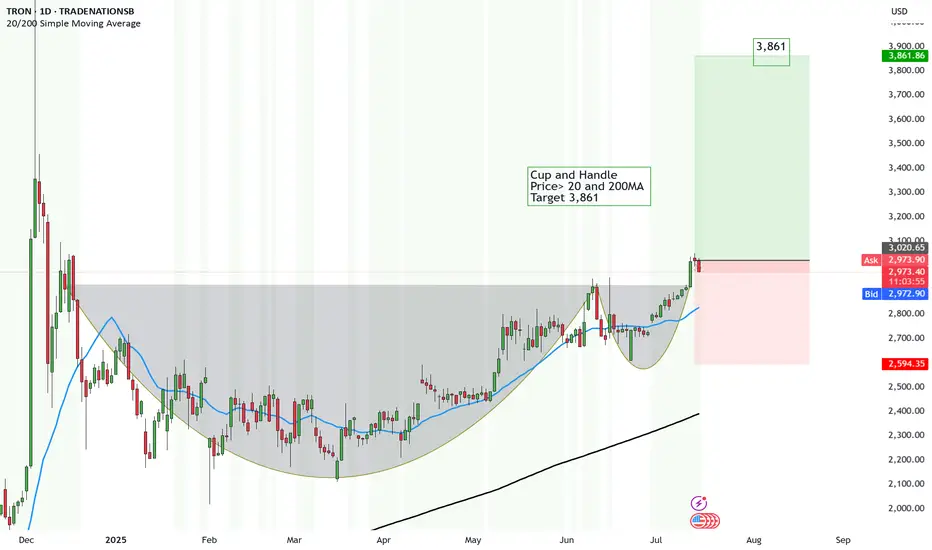
Cup and Handle
Price> 20 and 200MA
Target 3,861
Disclosure: I am part of Trade Nation's Influencer program and receive a monthly fee for using their TradingView charts in my analysis.
TRXUSD – Climbing, Testing the LidTRX rallied strongly off the $0.287 base and is forming higher highs and higher lows. Current price is just under $0.306 resistance. A breakout could send it to $0.312–$0.315 fast. Support to watch is $0.302 — lose that and the setup weakens.
TRX USD Hidden Bearish DivergenceGood day all. TRX puts in hidden bearish divergence. Time to be cautious. Not financial advice. Good luck with your trade.
TA on Litecoin, Ripple, Dogecoin, Polkadot, TronQuick TA on Litecoin, Ripple, Dogecoin, Polkadot, Tron. What do you think?
CRYPTO:LTCUSD
CRYPTO:XRPUSD
CRYPTO:DOGEUSD
CRYPTO:DOTUSD CRYPTO:TRXUSD
Let us know what you think in the comments below.
Thank you.
77.3% of retail investor accounts lose money when trading CFDs with this provider. You should consider whether you understand how CFDs work and whether you can afford to take the high risk of losing your money. Past performance is not necessarily indicative of future results. The value of investments may fall as well as rise and the investor may not get back the amount initially invested. This content is not intended for nor applicable to residents of the UK. Cryptocurrency CFDs and spread bets are restricted in the UK for all retail clients.


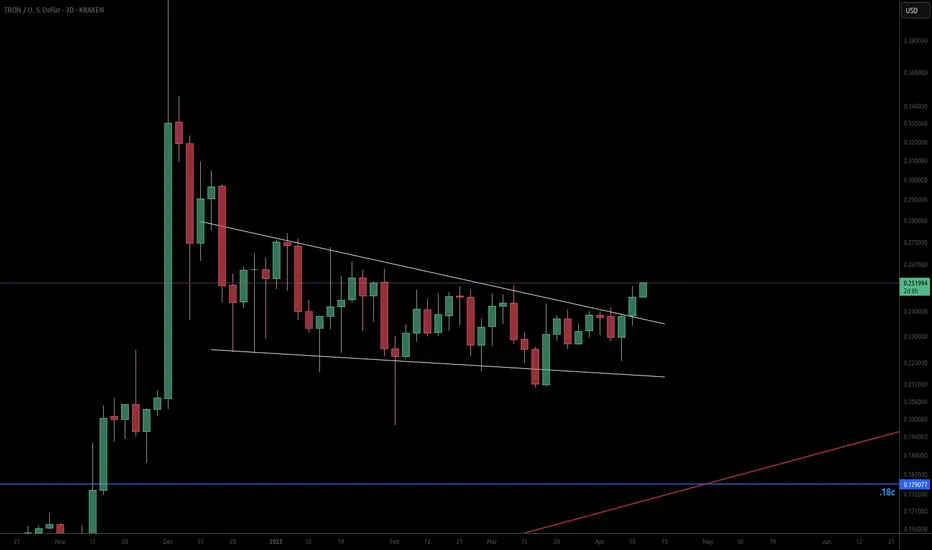
TRXUSD – Rounded Top, Weak Follow-ThroughTRX has been consolidating in a slow grind down after a failed breakout near $0.276. Price remains inside a rounded top formation, with no strong directional momentum. Bears have been capping upside at every mini-pump. Unless bulls step up above $0.2745 soon, lower supports near $0.2685 could be the next test. This is a no-man's-land zone – patience is key here.

TRON Slides into Range-Bound Chop Near $0.27TRON (TRX) is showing a whipsaw pattern with multiple rejections above $0.273 and support near $0.267. The pair is fluctuating with no clear breakout, reflecting indecision and lack of trend direction.
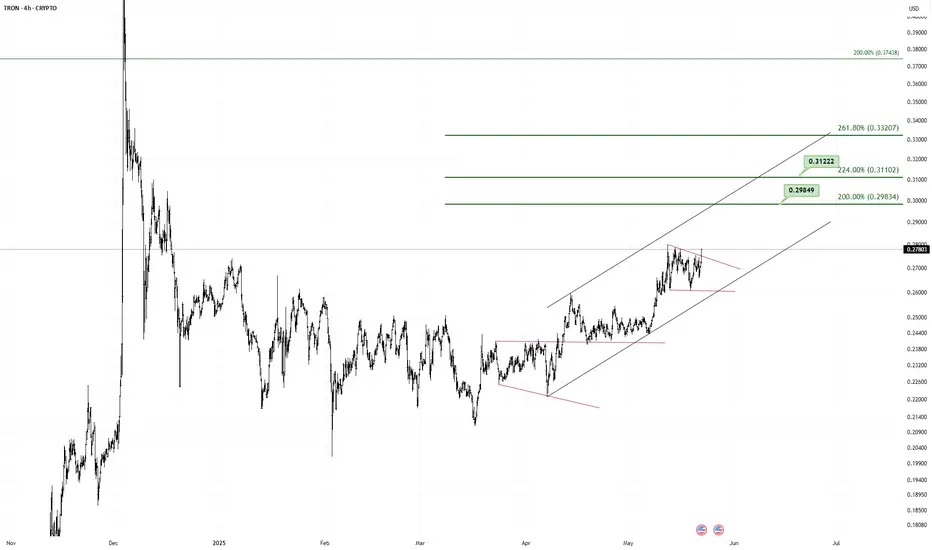
TRX/USDT Breakout Setup – Eyes on 0.298–0.332 Fibonacci TargetsTRON (TRX) is showing a bullish continuation structure within an ascending channel, following a breakout from a falling wedge pattern.
Currently, the price is consolidating inside a small bullish pennant, indicating a potential breakout to the upside. If this breakout materializes, it could trigger a rally toward the Fibonacci extension levels.
📌 Key Targets:
0.29849 (200% Extension)
0.31102 – 0.31222 (224% Cluster)
0.33207 (261.8% Extension)
📈 Technical Confluences:
Price is trending steadily within an ascending channel
Previous breakout from a falling wedge pattern confirms bullish sentiment
Higher lows structure remains intact
The pennant pattern typically resolves in the direction of the prevailing trend
📉 Invalidation Level:
A breakdown below the lower trendline and 0.258 support would invalidate the bullish scenario.
This chart setup offers a favorable risk/reward opportunity if the breakout is confirmed with strong volume.
Crypto update for 2025.05.22Bitcoin hits a new all-time high, but others are lagging. What's the deal?
Let's dig in...
CRYPTO:BTCUSD
CRYPTO:BCHUSD
CRYPTO:ETHUSD
CRYPTO:XRPUSD
CRYPTO:LTCUSD
CRYPTO:DOGEUSD
CRYPTO:DOTUSD
CRYPTO:TRXUSD
Let us know what you think in the comments below.
Thank you.
77.3% of retail investor accounts lose money when trading CFDs with this provider. You should consider whether you understand how CFDs work and whether you can afford to take the high risk of losing your money. Past performance is not necessarily indicative of future results. The value of investments may fall as well as rise and the investor may not get back the amount initially invested. This content is not intended for nor applicable to residents of the UK. Cryptocurrency CFDs and spread bets are restricted in the UK for all retail clients.

Crypto update for 2025.05.08A quick little technical crypto update for 2025.05.08.
Let us know what you think.
CRYPTO:BTCUSD
CRYPTO:BCHUSD
CRYPTO:ETHUSD
CRYPTO:XRPUSD
CRYPTO:DOGEUSD
CRYPTO:DOTUSD
CRYPTO:TRXUSD
Let us know what you think in the comments below.
Thank you.
77.3% of retail investor accounts lose money when trading CFDs with this provider. You should consider whether you understand how CFDs work and whether you can afford to take the high risk of losing your money. Past performance is not necessarily indicative of future results. The value of investments may fall as well as rise and the investor may not get back the amount initially invested. This content is not intended for nor applicable to residents of the UK. Cryptocurrency CFDs and spread bets are restricted in the UK for all retail clients.

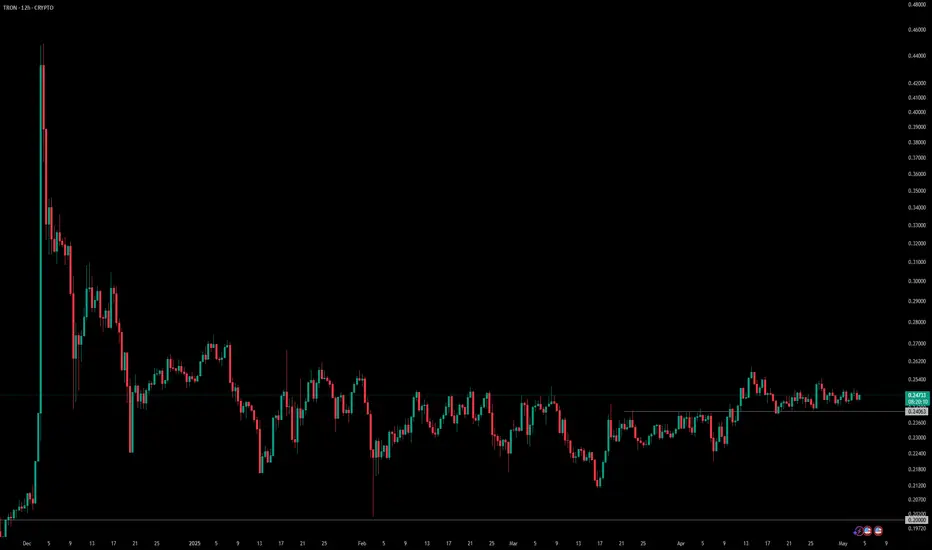
TRX Poised for Breakout After Weeks of CompressionTRX has been consolidating in a tight range between 0.24 and 0.26 for several weeks, showing signs of strength in a weak market. Price action has been orderly, with higher lows tightening into flat resistance — a textbook buildup.
This kind of compression often leads to sharp directional movement, especially when paired with low volatility and reduced attention. Volume remains muted, but any breakout with conviction above 0.26 could spark a strong trend continuation
Invalidation: Breakdown of support or rejection with high sell volume near 0.26.
Watching closely. No need to predict — just react.
#TRX #Crypto #BreakoutSetup #Altcoins #TradingViewIdeas
TRONUSD: A pair to keep on your watchlistHello,
Another coin pair or coin available in the market to look out at is TRONUSD or Tron. According to Wikipedia, Tron (stylized as TRON) is a decentralized, proof-of-stake blockchain with smart contract functionality. TRON adopts a 3-layer architecture divided into storage layer, core layer, and application layer. The TRON protocol adheres to Google protocol buffers, which intrinsically supports multi-language extension.
Very important for investors to remember is that the TRON coin is very different from the TON coin. TRON has a market cap of $23.29B with an average volume of $716.35M in 24 hours. While the maximum supply of this coin remains infinity (acting against the coin), the current total supply of the coin is 94.95B coins (circulating supply).
From a technical point, the pair is currently undergoing a correction and may present better buying/holding opportunities in the future. Both the moving averages and the MACD indicator show that better buying opportunities will come once the pair moves closer to the moving averages or the MACD does a zero crossover.
What might cause the correction is the SEC legal challenges against Tron founder Justin Sun over alleged securities law violations and undisclosed celebrity endorsements. The support the current president is giving to the crypto markets might also be the catalyst for the next move to the upside. We see this as a great coin to add to your watchlist going forward due to the potential opportunities it has.
Disclosure: I am part of Trade Nation's Influencer program and receive a monthly fee for using their TradingView charts in my analysis.
Crypto update 2025.04.14The current market moves due to tariffs are pushing away the interest from cryptos, as those are stuck somewhere between potentially being a safe-haven and still classed as a risky asset.
Let's dig in.
CRYPTO:BTCUSD
CRYPTO:BCHUSD
CRYPTO:ETHUSD
CRYPTO:LTCUSD
Let us know what you think in the comments below.
Thank you.
77.3% of retail investor accounts lose money when trading CFDs with this provider. You should consider whether you understand how CFDs work and whether you can afford to take the high risk of losing your money. Past performance is not necessarily indicative of future results. The value of investments may fall as well as rise and the investor may not get back the amount initially invested. This content is not intended for nor applicable to residents of the UK. Cryptocurrency CFDs and spread bets are restricted in the UK for all retail clients.

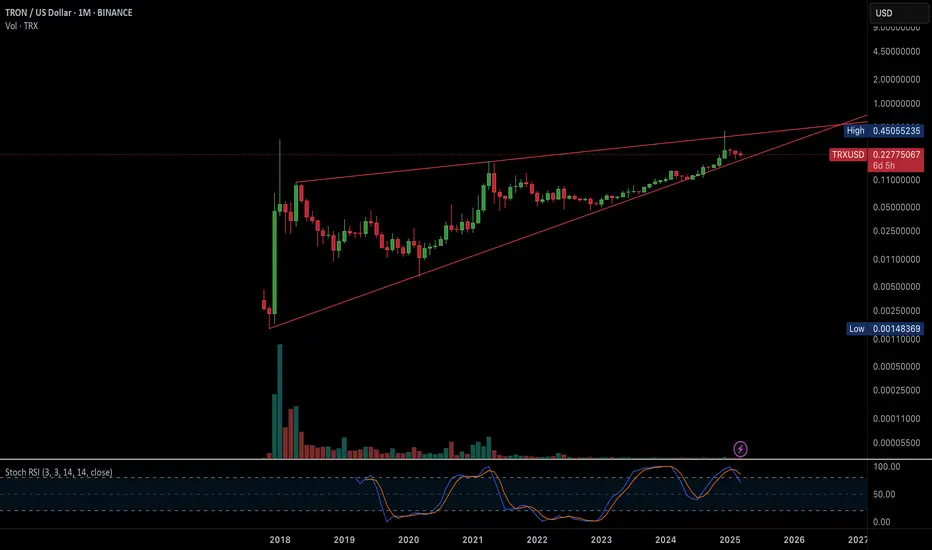
TRON Showing StrengthTRX has made a strong move. It's consolidated nicely and is peaking out of the falling wedge. Things are looking great so far.
TRX bullish soon!CRYPTOCAP:TRX -@trondao
TRON is dedicated to building the infrastructure for a decentralized internet. 🌐
#TRX is currently rejecting a strong demand zone marked in blue.
For the bulls to take over and initiate the next upward impulse phase, a break above the last major high marked in green at $0.252 is needed.🚀

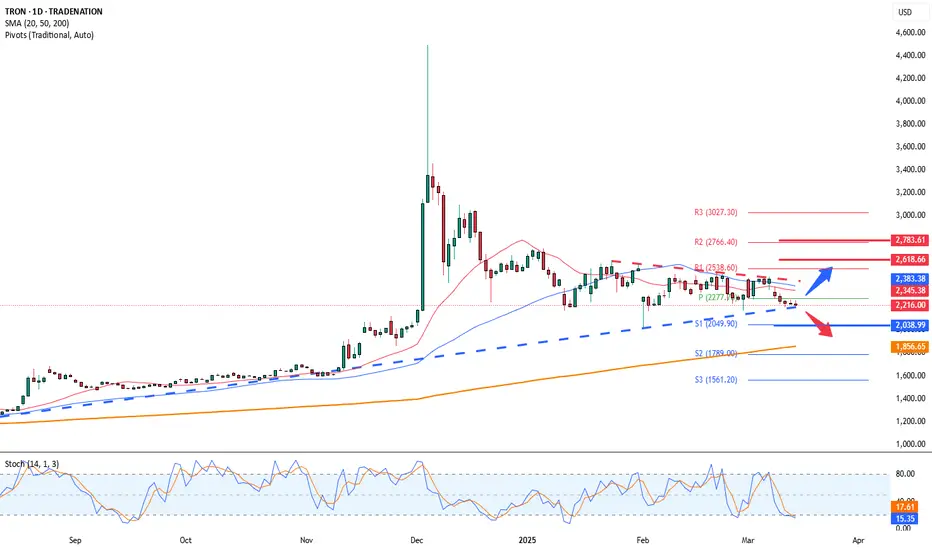
TRON The Week Ahead 17th March ‘25TRON (TRONUSD) remains in a bullish trend, supported by a longer-term uptrend. However, recent intraday price action suggests a sideways consolidation, with the rising support trendline acting as a key structural level.
Key Levels to Watch
Resistance Levels: 2,466, 2,614, 2,780
Support Levels: 2,034, 1,925, 1,741
Bullish Scenario
A successful bounce from the 2,034 support level, which aligns with the rising trendline and previous consolidation zone, could confirm bullish continuation. If buyers step in at this level, TRON could target the next resistance at 2,466, followed by 2,614 and potentially 2,780 over the longer term.
Bearish Scenario
A confirmed breakdown below 2,034, with a daily close beneath this level, would weaken the bullish outlook. This could lead to a deeper correction toward the 1,925 support level, with extended downside risk toward 1,741 if bearish momentum accelerates.
Conclusion
TRON remains in a broader uptrend, but the 2,034 level serves as a key pivot zone. A bounce from this level would reaffirm bullish strength, while a breakdown could lead to further downside corrections. Traders should watch price action around these levels for confirmation of the next directional move.
This communication is for informational purposes only and should not be viewed as any form of recommendation as to a particular course of action or as investment advice. It is not intended as an offer or solicitation for the purchase or sale of any financial instrument or as an official confirmation of any transaction. Opinions, estimates and assumptions expressed herein are made as of the date of this communication and are subject to change without notice. This communication has been prepared based upon information, including market prices, data and other information, believed to be reliable; however, Trade Nation does not warrant its completeness or accuracy. All market prices and market data contained in or attached to this communication are indicative and subject to change without notice.
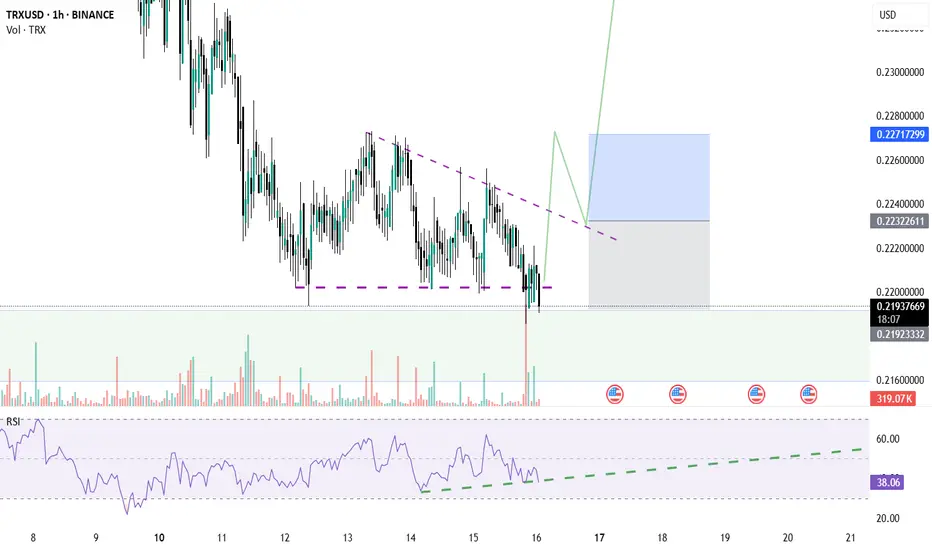
TRXUSDT: Possible buy trend shiftTRXUSDT: Possible buy trend shift. We see RSI divergence at the support level. If price breaks above the resistance line with high volume, then buy setup activates.