Possible Cup & Handle on SUGARI'd like to buy SUGAR at $11.55, expecting an upward move from this level. If we go up, a big cup & handle pattern will become visible to everyone. If that happens, I'll look to sell half of my position soon after the pattern is confirmed.
Key stats
About WISDOMTREE COMMODITY SECURITIES LTD ENERGY
Home page
Inception date
Sep 27, 2006
Structure
Limited Recourse Debt Obligations
Replication method
Synthetic
Primary advisor
WisdomTree Commodity Services LLC
ISIN
GB00B15KYB02
WisdomTree Energy is designed to enable investors to gain an exposure to a total return investment in a basket of commodity futures by tracking the Bloomberg Energy Subindex (the Index) and providing a collateral yield.
Related funds
Classification
What's in the fund
Exposure type
Government
Bonds, Cash & Other100.00%
Government100.00%
Top 10 holdings

Soybean Oil - Unveiling Insights Beyond the Common PerspectiveAnalyzing Soybean Oil CBOT:ZL1! on a monthly chart, my focus is on WisdomTree Soybean Oil LSE:SOYO on the LSE. Here's the rundown:
Bullish Surge: Prices skyrocketed by 281% from 2020 to 2022!
Pullback: A retracement to the 61.8% Fibonacci level occurred from 2022-2024.
Pattern Aler

AIGE might be gearing up for a bull run!We've seen a correction retracing over 61.8% of the prior uptrend. Does this signal a bear market? Not necessarily. Early bull markets can see deep corrections, but as long as the 61.8% level holds, the bull market is still going, just not at full strength.
Look closer at the chart. In the past, ma

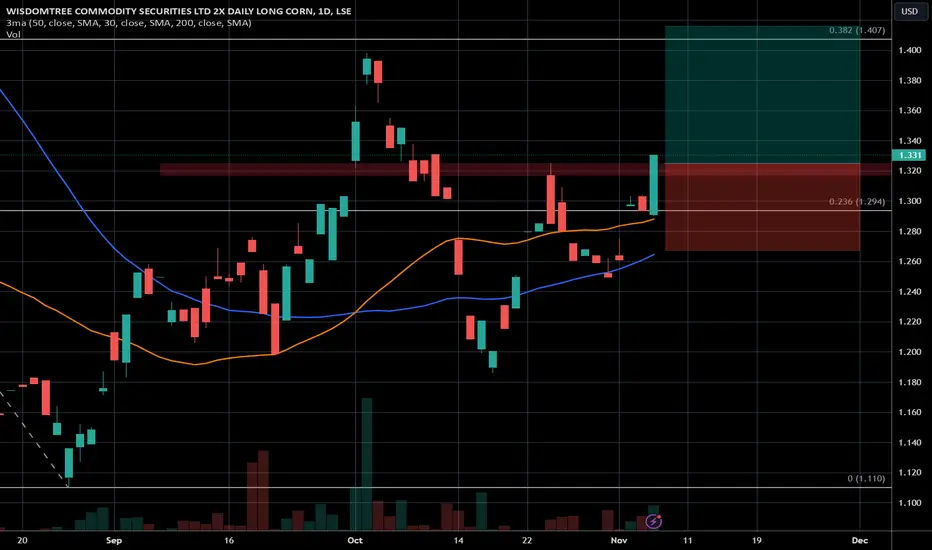
<0RN - strategic long tradeAs discussed in another idea on TradingView () I expect the corn price to rise. To participate in this rise, one might use this leveraged ETF. The buy order could be placed above the former local high as seen on the chart.
TINM - Triangle breakout if bullishTINM - Triangle breakout if bullish
Light trading but looks like the start of something here.

COFF - Weekly Triangle break out neckline at ATHBullish case, COFF - retraced to ATH and consolidated making an Ascending triangle with volume diminishing
I like the fact that the ASC TRI neckline sits on the ATH
expect the price to break up on the balance of probabilities

Massive H&S for Sugar? Right shoulder forming?Is this a massive Head and Shoulders pattern for Sugar? The head and left shoulder are complete but will the right shoulder form and head to the mid 7s?
Time will tell and we'll know by early 2025.
This all started in June 2014.

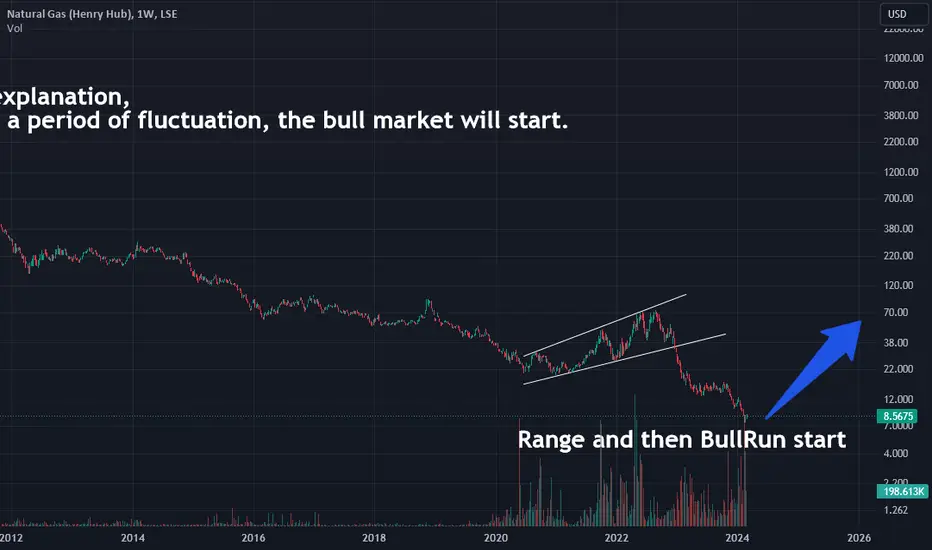
The Start of the BullRun NGAS (2024/03/02)Hi, Fasten your Seatbelts
No additional explanation, Probably, after a period of fluctuation, the bull market will start.
Is Zinc about to break 13 year resistance?Zinc could be about to breakout with a strong month so far.
However, technically it might need to pullback before another push.

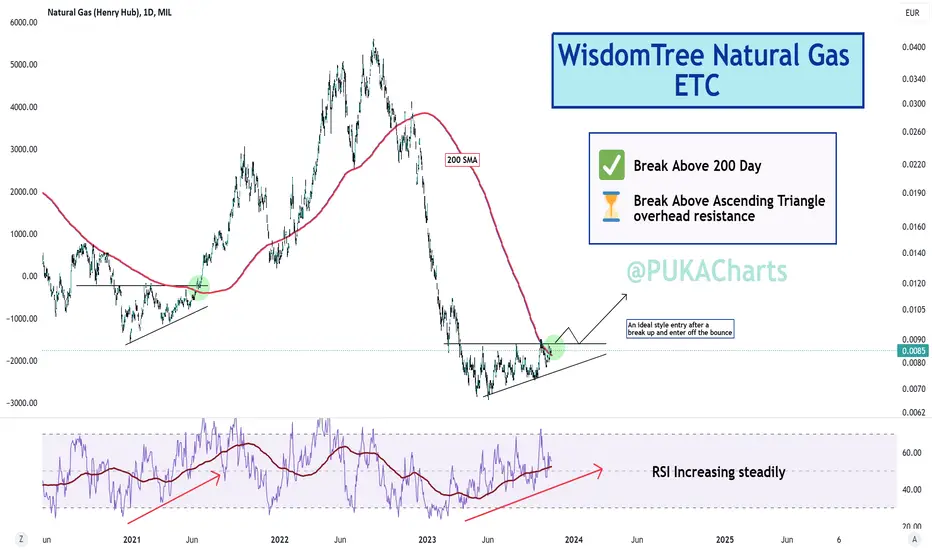
Wisdom Tree Natural Gas Potential Set upWisdomTree Natural Gas
Exchange Traded Commodity (ETC)
Noticed a potential repeating reversal pattern:
- Break above the 200 day
- Ascending triangle forming
- Rising RSI
Ideal Trade: Waiting for a break above the Triangle, enter then with a stop under the breakout point. We can revisit this a
See all ideas
Summarizing what the indicators are suggesting.
Oscillators
Neutral
SellBuy
Strong sellStrong buy
Strong sellSellNeutralBuyStrong buy
Oscillators
Neutral
SellBuy
Strong sellStrong buy
Strong sellSellNeutralBuyStrong buy
Summary
Neutral
SellBuy
Strong sellStrong buy
Strong sellSellNeutralBuyStrong buy
Summary
Neutral
SellBuy
Strong sellStrong buy
Strong sellSellNeutralBuyStrong buy
Summary
Neutral
SellBuy
Strong sellStrong buy
Strong sellSellNeutralBuyStrong buy
Moving Averages
Neutral
SellBuy
Strong sellStrong buy
Strong sellSellNeutralBuyStrong buy
Moving Averages
Neutral
SellBuy
Strong sellStrong buy
Strong sellSellNeutralBuyStrong buy
Displays a symbol's price movements over previous years to identify recurring trends.
Frequently Asked Questions
An exchange-traded fund (ETF) is a collection of assets (stocks, bonds, commodities, etc.) that track an underlying index and can be bought on an exchange like individual stocks.
1685 trades at 514.5 JPY today, its price has fallen −12.47% in the past 24 hours. Track more dynamics on 1685 price chart.
1685 net asset value is 544.22 today — it's risen 11.49% over the past month. NAV represents the total value of the fund's assets less liabilities and serves as a gauge of the fund's performance.
1685 assets under management is 7.40 B JPY. AUM is an important metric as it reflects the fund's size and can serve as a gauge of how successful the fund is in attracting investors, which, in its turn, can influence decision-making.
1685 price has risen by 4.69% over the last month, and its yearly performance shows a −16.08% decrease. See more dynamics on 1685 price chart.
NAV returns, another gauge of an ETF dynamics, showed a −3.20% decrease in three-month performance and has decreased by −11.70% in a year.
NAV returns, another gauge of an ETF dynamics, showed a −3.20% decrease in three-month performance and has decreased by −11.70% in a year.
1685 fund flows account for −622.80 M JPY (1 year). Many traders use this metric to get insight into investors' sentiment and evaluate whether it's time to buy or sell the fund.
Since ETFs work like an individual stock, they can be bought and sold on exchanges (e.g. NASDAQ, NYSE, EURONEXT). As it happens with stocks, you need to select a brokerage to access trading. Explore our list of available brokers to find the one to help execute your strategies. Don't forget to do your research before getting to trading. Explore ETFs metrics in our ETF screener to find a reliable opportunity.
1685 invests in bonds. See more details in our Analysis section.
1685 expense ratio is 0.49%. It's an important metric for helping traders understand the fund's operating costs relative to assets and how expensive it would be to hold the fund.
No, 1685 isn't leveraged, meaning it doesn't use borrowings or financial derivatives to magnify the performance of the underlying assets or index it follows.
In some ways, ETFs are safe investments, but in a broader sense, they're not safer than any other asset, so it's crucial to analyze a fund before investing. But if your research gives a vague answer, you can always refer to technical analysis.
Today, 1685 technical analysis shows the sell rating and its 1-week rating is sell. Since market conditions are prone to changes, it's worth looking a bit further into the future — according to the 1-month rating 1685 shows the sell signal. See more of 1685 technicals for a more comprehensive analysis.
Today, 1685 technical analysis shows the sell rating and its 1-week rating is sell. Since market conditions are prone to changes, it's worth looking a bit further into the future — according to the 1-month rating 1685 shows the sell signal. See more of 1685 technicals for a more comprehensive analysis.
No, 1685 doesn't pay dividends to its holders.
1685 trades at a premium (7.88%).
Premium/discount to NAV expresses the difference between the ETF’s price and its NAV value. A positive percentage indicates a premium, meaning the ETF trades at a higher price than the calculated NAV. Conversely, a negative percentage indicates a discount, suggesting the ETF trades at a lower price than NAV.
Premium/discount to NAV expresses the difference between the ETF’s price and its NAV value. A positive percentage indicates a premium, meaning the ETF trades at a higher price than the calculated NAV. Conversely, a negative percentage indicates a discount, suggesting the ETF trades at a lower price than NAV.
1685 shares are issued by WisdomTree, Inc.
1685 follows the Bloomberg Energy. ETFs usually track some benchmark seeking to replicate its performance and guide asset selection and objectives.
The fund started trading on Sep 27, 2006.
The fund's management style is passive, meaning it's aiming to replicate the performance of the underlying index by holding assets in the same proportions as the index. The goal is to match the index's returns.