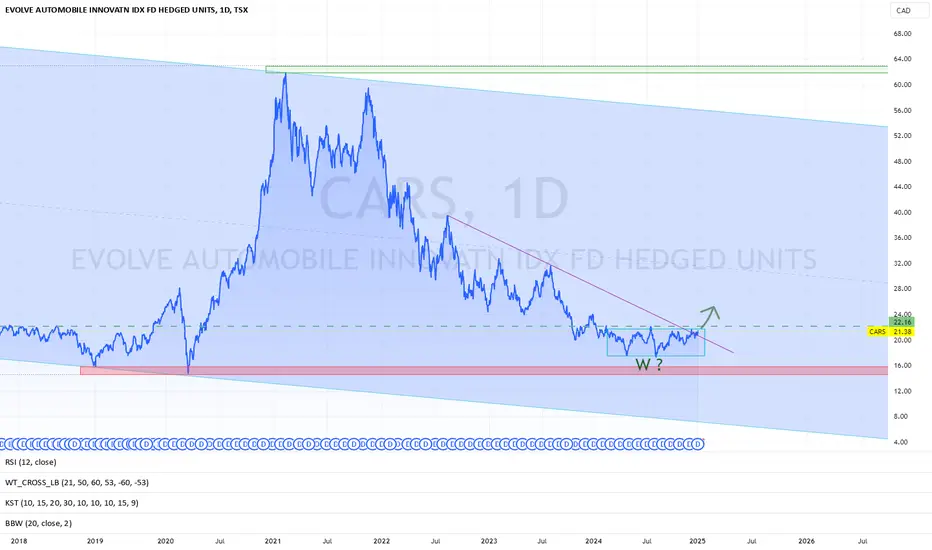
ON THE ROAD AGAIN?Have we recently seen a double bottom in CARS, and will it now be on the road again?
Key stats
About EVOLVE AUTOMOBILE INNOVATN IDX FD HEDGED UNITS
Home page
Inception date
Sep 29, 2017
Structure
Canadian Mutual Fund Trust (ON)
Dividend treatment
Distributes
Distribution tax treatment
Return of capital
Primary advisor
Evolve Funds Group, Inc.
The fund is a passively managed ETF that provides exposure to stocks, including ADRs and GDRs, from developed markets that are working towards the development of automobiles, whether directly or as part of its ecosystem. The fund holds companies, stretching across multiple sub-industries under FactSets Revere Business Industry Classification System as car manufacturers, auto interior comfort/safety/electronics products, fuel cell equipment and technology providers, heavy-duty and high-end batteries manufacturing, video multimedia semiconductors, and general analog and mixed signal semiconductors. The index is reviewed quarterly, assigning each eligible company an equal weight.
Classification
What's in the fund
Exposure type
Electronic Technology
Producer Manufacturing
Consumer Durables
Stock breakdown by region
Top 10 holdings

Summarizing what the indicators are suggesting.
Oscillators
Neutral
SellBuy
Strong sellStrong buy
Strong sellSellNeutralBuyStrong buy
Oscillators
Neutral
SellBuy
Strong sellStrong buy
Strong sellSellNeutralBuyStrong buy
Summary
Neutral
SellBuy
Strong sellStrong buy
Strong sellSellNeutralBuyStrong buy
Summary
Neutral
SellBuy
Strong sellStrong buy
Strong sellSellNeutralBuyStrong buy
Summary
Neutral
SellBuy
Strong sellStrong buy
Strong sellSellNeutralBuyStrong buy
Moving Averages
Neutral
SellBuy
Strong sellStrong buy
Strong sellSellNeutralBuyStrong buy
Moving Averages
Neutral
SellBuy
Strong sellStrong buy
Strong sellSellNeutralBuyStrong buy
Displays a symbol's price movements over previous years to identify recurring trends.
Related funds
Frequently Asked Questions
An exchange-traded fund (ETF) is a collection of assets (stocks, bonds, commodities, etc.) that track an underlying index and can be bought on an exchange like individual stocks.
CARS trades at 20.10 CAD today, its price has fallen −1.62% in the past 24 hours. Track more dynamics on CARS price chart.
CARS net asset value is 20.39 today — it's fallen 2.70% over the past month. NAV represents the total value of the fund's assets less liabilities and serves as a gauge of the fund's performance.
CARS assets under management is 16.09 M CAD. AUM is an important metric as it reflects the fund's size and can serve as a gauge of how successful the fund is in attracting investors, which, in its turn, can influence decision-making.
CARS price has fallen by −3.27% over the last month, and its yearly performance shows a 0.65% increase. See more dynamics on CARS price chart.
NAV returns, another gauge of an ETF dynamics, have risen by −2.70% over the last month, have fallen by −2.70% over the last month, showed a 4.01% increase in three-month performance and has increased by 3.12% in a year.
NAV returns, another gauge of an ETF dynamics, have risen by −2.70% over the last month, have fallen by −2.70% over the last month, showed a 4.01% increase in three-month performance and has increased by 3.12% in a year.
CARS fund flows account for −8.18 M CAD (1 year). Many traders use this metric to get insight into investors' sentiment and evaluate whether it's time to buy or sell the fund.
Since ETFs work like an individual stock, they can be bought and sold on exchanges (e.g. NASDAQ, NYSE, EURONEXT). As it happens with stocks, you need to select a brokerage to access trading. Explore our list of available brokers to find the one to help execute your strategies. Don't forget to do your research before getting to trading. Explore ETFs metrics in our ETF screener to find a reliable opportunity.
CARS invests in stocks. See more details in our Analysis section.
CARS expense ratio is 0.89%. It's an important metric for helping traders understand the fund's operating costs relative to assets and how expensive it would be to hold the fund.
No, CARS isn't leveraged, meaning it doesn't use borrowings or financial derivatives to magnify the performance of the underlying assets or index it follows.
In some ways, ETFs are safe investments, but in a broader sense, they're not safer than any other asset, so it's crucial to analyze a fund before investing. But if your research gives a vague answer, you can always refer to technical analysis.
Today, CARS technical analysis shows the neutral rating and its 1-week rating is neutral. Since market conditions are prone to changes, it's worth looking a bit further into the future — according to the 1-month rating CARS shows the neutral signal. See more of CARS technicals for a more comprehensive analysis.
Today, CARS technical analysis shows the neutral rating and its 1-week rating is neutral. Since market conditions are prone to changes, it's worth looking a bit further into the future — according to the 1-month rating CARS shows the neutral signal. See more of CARS technicals for a more comprehensive analysis.
Yes, CARS pays dividends to its holders with the dividend yield of 1.18%.
CARS trades at a premium (1.41%).
Premium/discount to NAV expresses the difference between the ETF’s price and its NAV value. A positive percentage indicates a premium, meaning the ETF trades at a higher price than the calculated NAV. Conversely, a negative percentage indicates a discount, suggesting the ETF trades at a lower price than NAV.
Premium/discount to NAV expresses the difference between the ETF’s price and its NAV value. A positive percentage indicates a premium, meaning the ETF trades at a higher price than the calculated NAV. Conversely, a negative percentage indicates a discount, suggesting the ETF trades at a lower price than NAV.
CARS shares are issued by Evolve Funds Group, Inc.
CARS follows the Solactive Future Cars Index Canadian Dollar Hedged - CAD. ETFs usually track some benchmark seeking to replicate its performance and guide asset selection and objectives.
The fund started trading on Sep 29, 2017.
The fund's management style is passive, meaning it's aiming to replicate the performance of the underlying index by holding assets in the same proportions as the index. The goal is to match the index's returns.