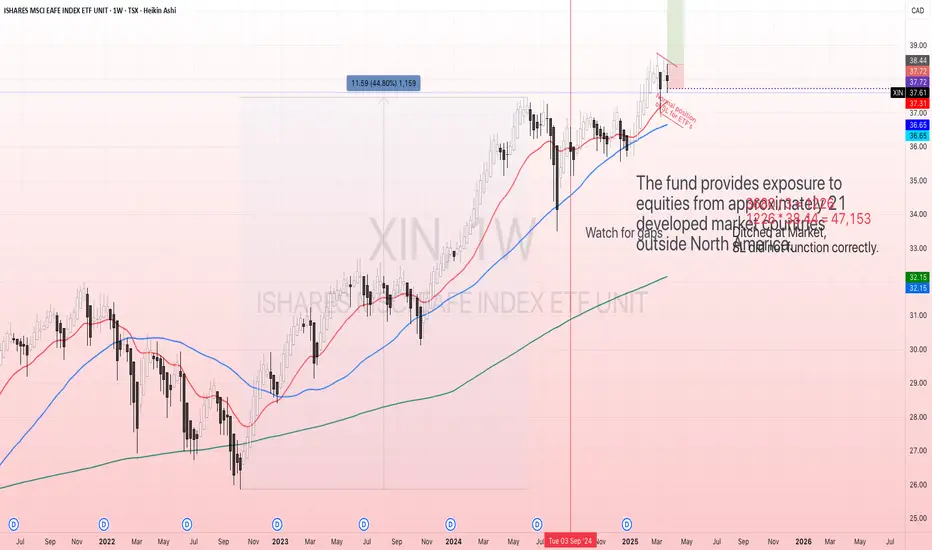
XIN Long Entry and ExitSharing to remind myself that mistake happen more often for me in bear markets.
Here I have entered on a CCI trigger. Not a particularly bad entry although there was an immediate pullback. But the SL placement was poor. I am still trying to discover what I pinned it on but cannot see why.
BLACKROCK ASSET MANAGEMENT CA LTD ISHARES MSCI EAFE INDEX ETF (CAD-HEDGED)
No trades
Key stats
About BLACKROCK ASSET MANAGEMENT CA LTD ISHARES MSCI EAFE INDEX ETF (CAD-HEDGED)
Home page
Inception date
Sep 6, 2001
Structure
Canadian Mutual Fund Trust (ON)
Dividend treatment
Distributes
Distribution tax treatment
Return of capital
Income tax type
Capital Gains
Primary advisor
BlackRock Asset Management Canada Ltd.
The fund provides exposure to equities from approximately 21 developed market countries outside North America. The fund holds large- and mid-cap stocks only, in contrast with the IMI version of the index that includes small cap stocks. XGI will mainly invest in one or more iShares ETFs that reflects the underlying index exposure. The index is 100% hedged to the CAD. The index hedges back to a CAD by selling currency forwards at the one-month forward rate. Sibling fund XFH follows the IMI version.
Related funds
Classification
What's in the fund
Exposure type
ETF
Stock breakdown by region
Top 10 holdings
Summarizing what the indicators are suggesting.
Oscillators
Neutral
SellBuy
Strong sellStrong buy
Strong sellSellNeutralBuyStrong buy
Oscillators
Neutral
SellBuy
Strong sellStrong buy
Strong sellSellNeutralBuyStrong buy
Summary
Neutral
SellBuy
Strong sellStrong buy
Strong sellSellNeutralBuyStrong buy
Summary
Neutral
SellBuy
Strong sellStrong buy
Strong sellSellNeutralBuyStrong buy
Summary
Neutral
SellBuy
Strong sellStrong buy
Strong sellSellNeutralBuyStrong buy
Moving Averages
Neutral
SellBuy
Strong sellStrong buy
Strong sellSellNeutralBuyStrong buy
Moving Averages
Neutral
SellBuy
Strong sellStrong buy
Strong sellSellNeutralBuyStrong buy
Displays a symbol's price movements over previous years to identify recurring trends.
Frequently Asked Questions
An exchange-traded fund (ETF) is a collection of assets (stocks, bonds, commodities, etc.) that track an underlying index and can be bought on an exchange like individual stocks.
XIN trades at 38.13 CAD today, its price has fallen −1.45% in the past 24 hours. Track more dynamics on XIN price chart.
XIN net asset value is 38.19 today — it's fallen 0.42% over the past month. NAV represents the total value of the fund's assets less liabilities and serves as a gauge of the fund's performance.
XIN assets under management is 1.44 B CAD. AUM is an important metric as it reflects the fund's size and can serve as a gauge of how successful the fund is in attracting investors, which, in its turn, can influence decision-making.
and its yearly performance shows a 5.51% increase. See more dynamics on XIN price chart.
NAV returns, another gauge of an ETF dynamics, have risen by −0.42% over the last month, have fallen by −0.42% over the last month, showed a 2.80% increase in three-month performance and has increased by 7.21% in a year.
NAV returns, another gauge of an ETF dynamics, have risen by −0.42% over the last month, have fallen by −0.42% over the last month, showed a 2.80% increase in three-month performance and has increased by 7.21% in a year.
XIN fund flows account for 23.14 M CAD (1 year). Many traders use this metric to get insight into investors' sentiment and evaluate whether it's time to buy or sell the fund.
Since ETFs work like an individual stock, they can be bought and sold on exchanges (e.g. NASDAQ, NYSE, EURONEXT). As it happens with stocks, you need to select a brokerage to access trading. Explore our list of available brokers to find the one to help execute your strategies. Don't forget to do your research before getting to trading. Explore ETFs metrics in our ETF screener to find a reliable opportunity.
XIN invests in funds. See more details in our Analysis section.
XIN expense ratio is 0.53%. It's an important metric for helping traders understand the fund's operating costs relative to assets and how expensive it would be to hold the fund.
No, XIN isn't leveraged, meaning it doesn't use borrowings or financial derivatives to magnify the performance of the underlying assets or index it follows.
In some ways, ETFs are safe investments, but in a broader sense, they're not safer than any other asset, so it's crucial to analyze a fund before investing. But if your research gives a vague answer, you can always refer to technical analysis.
Today, XIN technical analysis shows the sell rating and its 1-week rating is buy. Since market conditions are prone to changes, it's worth looking a bit further into the future — according to the 1-month rating XIN shows the buy signal. See more of XIN technicals for a more comprehensive analysis.
Today, XIN technical analysis shows the sell rating and its 1-week rating is buy. Since market conditions are prone to changes, it's worth looking a bit further into the future — according to the 1-month rating XIN shows the buy signal. See more of XIN technicals for a more comprehensive analysis.
Yes, XIN pays dividends to its holders with the dividend yield of 1.56%.
XIN trades at a premium (0.17%).
Premium/discount to NAV expresses the difference between the ETF’s price and its NAV value. A positive percentage indicates a premium, meaning the ETF trades at a higher price than the calculated NAV. Conversely, a negative percentage indicates a discount, suggesting the ETF trades at a lower price than NAV.
Premium/discount to NAV expresses the difference between the ETF’s price and its NAV value. A positive percentage indicates a premium, meaning the ETF trades at a higher price than the calculated NAV. Conversely, a negative percentage indicates a discount, suggesting the ETF trades at a lower price than NAV.
XIN shares are issued by BlackRock, Inc.
XIN follows the MSCI EAFE 100% Hedged to CAD Net Variant. ETFs usually track some benchmark seeking to replicate its performance and guide asset selection and objectives.
The fund started trading on Sep 6, 2001.
The fund's management style is passive, meaning it's aiming to replicate the performance of the underlying index by holding assets in the same proportions as the index. The goal is to match the index's returns.